[Preprint]. 2025 Jul 29:rs.3.rs-7014295.
doi: 10.21203/rs.3.rs-7014295/v1.

The PLK4 inhibitor RP-1664 demonstrates potent single-agent efficacy in neuroblastoma models through a dual mechanism of sensitivity

Affiliations

The PLK4 inhibitor RP-1664 demonstrates potent single-agent efficacy in neuroblastoma models through a dual mechanism of sensitivity

John Maris et al. Res Sq. .

Abstract

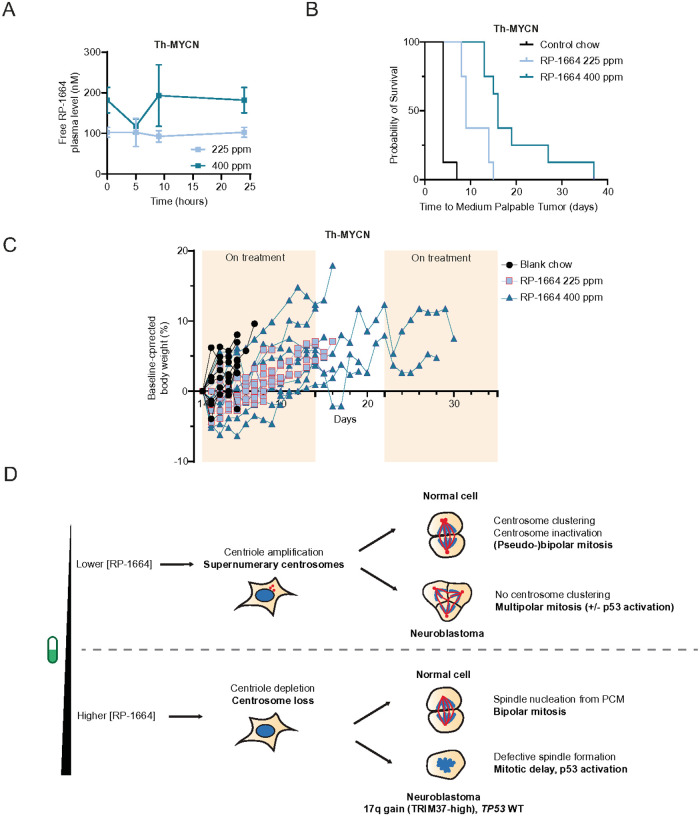
It was recently shown that inhibition of polo-like kinase 4 (PLK4) induces TP53-dependent synthetic lethality in cancers with chromosome 17q-encoded TRIM37 copy number gain due to cooperative regulation of centriole duplication and mitotic spindle nucleation. We show here that chromosome 17q/TRIM37 gain is a pathognomonic feature of high-risk neuroblastoma and renders patient-derived cell lines hypersensitive to the novel PLK4 inhibitor RP-1664. We demonstrate that centriole amplification at low doses of RP-1664 contributes to this sensitivity in a TRIM37- and TP53-independent fashion. CRISPR screens and live cell imaging reveal that upon centriole amplification, neuroblastoma cells succumb to multipolar mitoses due to an inability to cluster or inactivate supernumerary centrosomes. RP-1664 showed robust anti-tumor activity in 14/15 neuroblastoma xenograft models and significantly extended survival in a transgenic murine neuroblastoma model. These data support biomarker-directed clinical development of PLK4 inhibitors for high-risk neuroblastoma and other cancers with somatically acquired TRIM37 overexpression.


Figures

Figure 1
Figure 1. RP-1664 is a potent and selective PLK4i.
A,B. RP-1664 induces PLK4 stabilization. A. Top: Model of PLK4 self-regulation. PLK4 autophosphorylation leads to its degradation. This is blocked by RP-1664. Bottom: Representative capillary immunodetection of PLK4 in RPE1-hTERT Cas9 TP53-KO whole cell extracts. Total protein shown as a loading control. B. Representative (of N=3 independent experiments) quantification of PLK4 protein levels in capillary immunodetection assays. Mean of two technical replicates from one representative experiment ±SD. C,D. RP-1664 modulates centrosome biogenesis. C. Top: Schematic of bimodal modulation of centriole numbers by RP-1664. Low concentrations induce centriole amplification, higher concentrations lead to centriole loss. Bottom:Representative micrographs of RPE1-hTERT Cas9 TP53-KO cells after no treatment or treatment with indicated RP-1664 concentrations and immunofluorescence staining with γ-Tubulin (visualizing centrosomes) and H3-pS10 (mitotic marker) antibodies. DAPI is a nuclear counterstain. D. Quantification of mitotic RPE1 Cas9 TP53-WT and KO cells with <2, 2, and >2 centrosomes at indicated RP-1664 concentrations in N=3 independent experiments. Mean value (bars) is shown ±SD. E-G. WT p53 and high TRIM37 sensitize to RP-1664. E. Representative (of N≥2 independent experiments) TRIM37 capillary immunodetection (left) and TP53 immunoblot (right) of RPE1-hTERT Cas9 TP53-WT and KO cells with or without CMV-TRIM37 overexpression. Total protein and vinculin are loading controls. F. Dose-response of RP-1664 on growth (measured by Incucyte) of RPE1 TP53-WT and KO cells, with or without CMV-TRIM37. Mean of N=3 independent experiments ±SD. Solid lines show a non-linear regression fit to a four-parameter dose-response model. G. Tumor volume measurements of MCF7 mouse xenograft tumors in animals fed blank chow or RP-1664-containing chow at indicated doses and schedules. TGI = percent tumor growth inhibition relative to blank chow. Mean of N=6 mice/group ±SEM.
Figure 2.
Figure 2.. TRIM37 gain is a pathognomonic feature of high-risk neuroblastoma.
A. Copy number variation across chromosome 17 in 42 high-risk neuroblastomas from the Gabriella Miller Kids First (GMKF) patient cohort. Colors indicate copy number as described below the plot. Cytogenetic map of chromosome 17 is shown for reference. B. Correlation between TRIM37 mRNA expression and 17q (left) or TRIM37 (right) copy number in the GMFK neuroblastoma dataset as in A. P values were calculated using a T-test based on the Pearson’s correlation coefficient (R) and the sample size (N) where the T-statistic=R(N2)/(1R2). C. TRIM37 mRNA expression across tumor indications in the Open Targets dataset.
Figure 3
Figure 3. TRIM37- and p53-independent sensitivity of neuroblastoma cells to centrosome amplification.
A. RP-1664 cell growth IC50 values for indicated cell lines. Data from non-linear least square fitting of mean viability values (N≥3 independent experiments) in growth (Incucyte (RPE1, CHP134) or CellTiter Glo (all others)) assays ±95% confidence interval. Dashed line shows the lowest concentration inducing centrosome loss in RPE1 cells. B. Quantification of mitotic CHP134 and CHP212 cells with <2, 2, and >2 centrosomes at indicated RP-1664 concentrations in N=3 independent experiments. Mean value (bars) is shown ±SD. C,D. Representative TRIM37 capillary immunodetection (left) and p53 immunoblots (right) of CHP134 (C) and CHP212 (D) of indicated genotypes. Total protein and vinculin are loading controls. E,F. Cell viability of CHP134 (E; measured by Incucyte) and CHP212 (F; CellTiter Glo) cells of indicated genotypes treated with indicated RP-1664 concentrations. Pink area shows concentrations causing centrosome amplification, blue represents centrosome depletion. Mean of N=3 to 5 independent experiments ±SD. G. Tumor volume measurement of CHP134 WT, TRIM37-KO and TP53-KO mouse xenografts treated with blank chow or 300ppm RP-1664 chow using a 17d on / 7d off schedule. Mean of 7 mice/group ±SEM.
Figure 4
Figure 4. CRISPR screens for genes modulating sensitivity to RP-1664.
A,B. Screen for gene knockouts causing RP-1664 resistance in CHP134 TRIM37-low/TP53-KO cells. A. Experimental design. See methods for details. B. Screen results. Median sgRNA fold changes per gene in RP-1664-treated cells (Y axis) vs. untreated (X axis). Resistor hits with known functions in centriole/centrosome biogenesis (blue), apoptosis (red) or the PIDDosome (green) are highlighted. C,D. Screen for genes knockouts causing RP-1664 resistance or sensitivity in RPE1-hTERT Cas9 cells. C. Experimental design. See methods for details. D. Screen results. Gene-level DrugZ scores in cells treated with 50nM RP-1664 (centrosome amplification; Y axis) vs. 150nM (centrosome depletion; X axis). Hits with known functions in centriole/centrosome biogenesis (blue), the mitotic surveillance pathway (red) or the PIDDosome (green) are highlighted.
Figure 5
Figure 5. Lack of clustering/exclusion of extra centrosomes leads to RP-1664 sensitivity.
A. Representative tempograms from time-lapse imaging of CHP134 (top) and RPE1-hTERT Cas9 (bottom) cells stained with SPY555-Tubulin for microtubules (yellow) and SPY650-DNA for DNA (red) and treated with DMSO or 50nM RP-1664. Example cells undergoing normal division, multipolar segregation, or pseudo-bipolar division with centrosome clustering or centrosome exclusion are shown. B. Left: Workflow for quantification of multipolar segregation frequency. RPE1 or neuroblastoma cells were treated with 50nM RP-1664, fixed and immunostained for centrosomes (g-Tubulin) and mitosis (H3-pS10). DAPI was a nuclear counterstain. Anaphase and telophase cells undergoing either bipolar or multipolar division were quantified. Right: Frequency of multipolar segregation in anaphase or telophase with or without RP-1664 in indicated cell lines. Data from N=3 independent experiments (open symbols) with mean (bars) ±SD. C. Representative KIFC1 capillary immunodetection of KIFC1-WT and KIFC1-KO RPE1-hTERT Cas9 cells. Total protein is a loading control. D. Representative micrographs of KIFC1-WT and KO cells processed for immunofluorescence with g-Tubulin and H3-pS10 antibodies with or without RP-1664 treatment. DAPI used as a nuclear counterstain. E. Quantification of KIFC1-WT and KO cells in anaphase or telophase undergoing multipolar vs. bipolar division in presence or absence of RP-1664. Data from N=3 independent experiments (open symbols) with mean (bars) ±SD. P values determined with an unpaired two-tailed T-test. F. RP-1664 sensitivity of KIFC1-WT and KIFC1-KO cells. Mean viability measurements from N=3 independent Incucyte growth assays ±SD.
Figure 6
Figure 6. Potent single-agent efficacy of RP-1664 in neuroblastoma xenograft models.
A. Free (not bound to plasma protein) plasma concentrations of RP-1664 in mice treated with indicated doses of RP-1664 chow. Mean of N=3 mice. B. Tumor volume measurement of COG-N-424x mouse xenografts treated with blank chow or indicated doses of RP-1664 chow using a xxx schedule continuous dosing schedule of RP-1664 for six weeks, followed by two cycles of one week on and one week off as detailed in method section. Mean of N=6 mice/group ±SEM. C. PLK4 protein level quantification by capillary immunodetection in lysates from COG-N-424x tumors treated for 7 days with indicated doses of RP-1664. Mean of N=3 mice ±SEM. D. Tumor volume measurements in 15 xenograft models of high-risk neuroblastoma treated with vehicle or 450 ppm of RP-1664 chow. Treatment periods and endpoint events are indicated. Data are mean of N=3 mice/group.
Figure 7
Figure 7. RP-1664 extends survival of immunocompetent mice with spontaneous neuroblastomas.
A. Free (not bound to plasma protein) plasma concentrations of RP-1664 in Th-MYCN mice treated with indicated doses of RP-1664 chow. Mean of N=3 mice at indicated time points ±SEM. B. Kaplan-Meier survival curves showing survival of Th-MYCN mice treated with RP-1664 at presentation of small palpable tumor. N=8 mice/group. C. Percentage weight loss of mice treated with RP-1664 over time. Data show individual mice. D. A two-component model of neuroblastoma sensitivity to PLK4i. See main text for details.

References

    1. Matthay K. K. et al. Neuroblastoma. Nat Rev Dis Primers 2, 16078 (2016). - PubMed
    1. Bown N. et al. Gain of chromosome arm 17q and adverse outcome in patients with neuroblastoma. N Engl J Med 340, 1954–1961 (1999). - PubMed
    1. Gilbert F. et al. Human neuroblastomas and abnormalities of chromosomes 1 and 17. Cancer Res 44, 5444–5449 (1984). - PubMed
    1. Morowitz M. et al. Detection of single-copy chromosome 17q gain in human neuroblastomas using real-time quantitative polymerase chain reaction. Mod Pathol 16, 1248–1256 (2003). - PubMed
    1. Mlakar V. et al. 17q Gain in Neuroblastoma: A Review of Clinical and Biological Implications. Cancers (Basel) 16, 338 (2024). - PMC - PubMed

Publication types

LinkOut - more resources