. 2025 Jul 22:15:1593815.
doi: 10.3389/fonc.2025.1593815. eCollection 2025.

Targeting PDCD4 in cancer and atrial fibrillation: mechanistic insights from integrated multi-omics and single-cell analysis

Affiliations

Targeting PDCD4 in cancer and atrial fibrillation: mechanistic insights from integrated multi-omics and single-cell analysis

Juledezi Hailati et al. Front Oncol. .

Abstract

Background: Atrial fibrillation (AF) is a complicated and varied cardiovascular disorder with inadequate understanding of its molecular underpinnings. While Programmed cell death factor 4 (PDCD4) has been associated in several illnesses, its particular significance in AF remains unknown. This work seeks to discover PDCD4-associated critical genes and clarify their regulation processes.

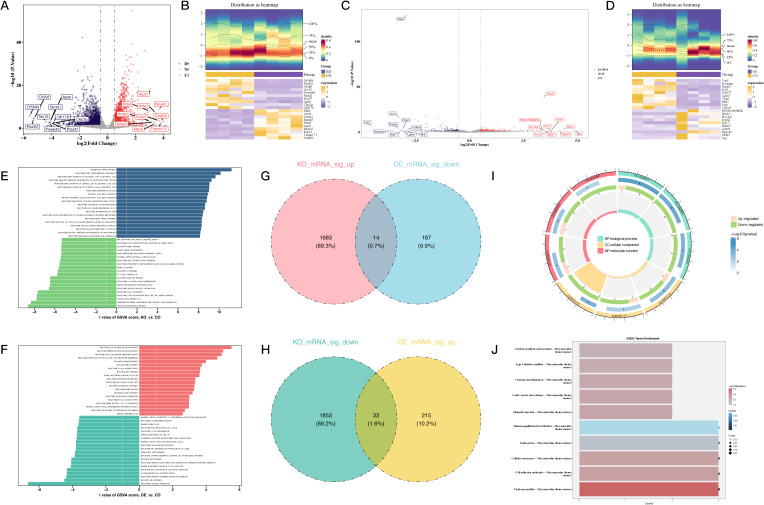
Method: We built a protein-protein interaction (PPI) network to emphasize important biological interactions and used transcriptome analysis to find differentially expressed genes (DEGs). Regulatory mechanisms were explored through miRNA-mRNA and transcription factor (TF) analysis. Single-cell RNA sequencing (SCRNA-SEQ) data were utilized to identify crucial cell types and intercellular communication patterns associated with key genes.

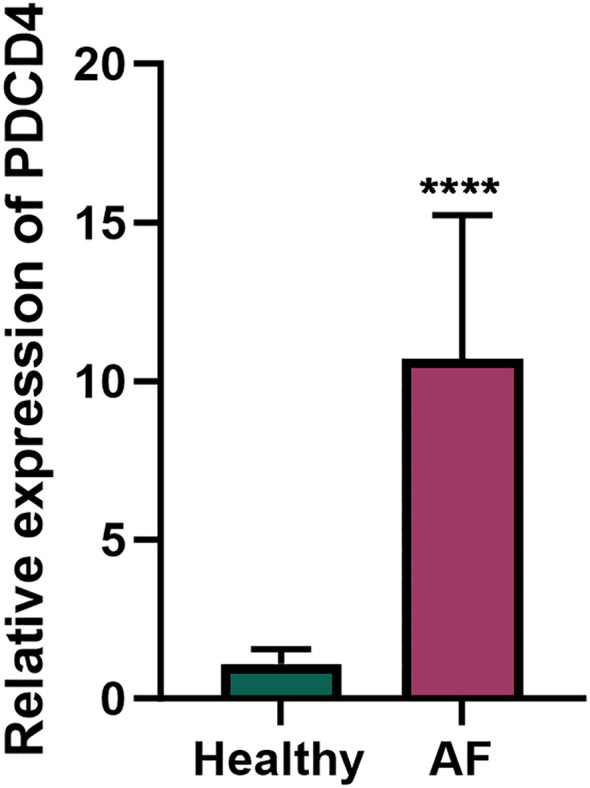
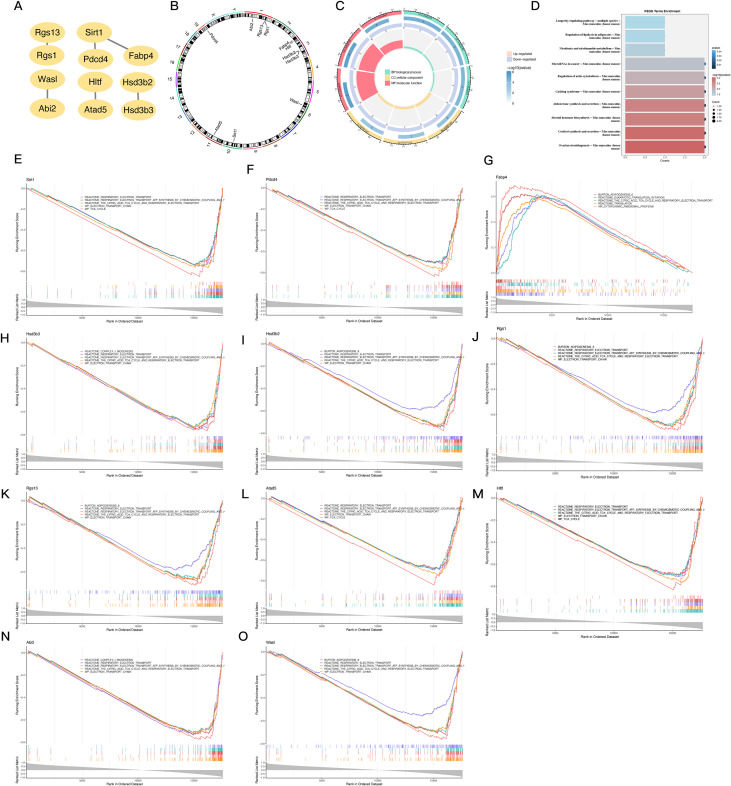
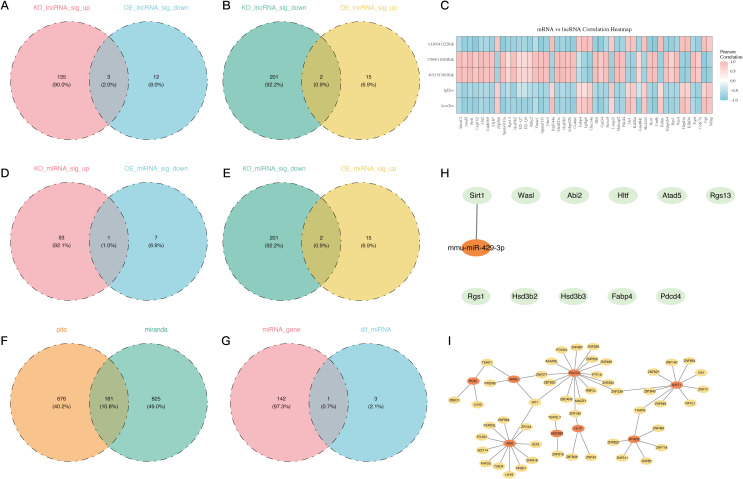
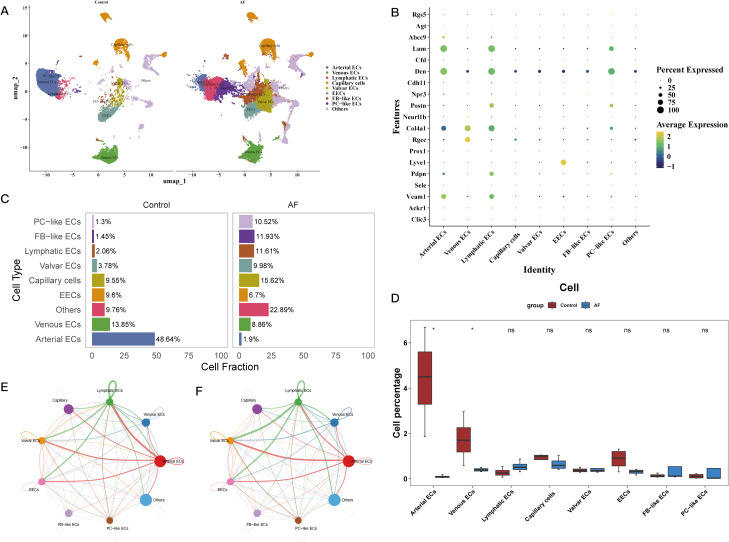
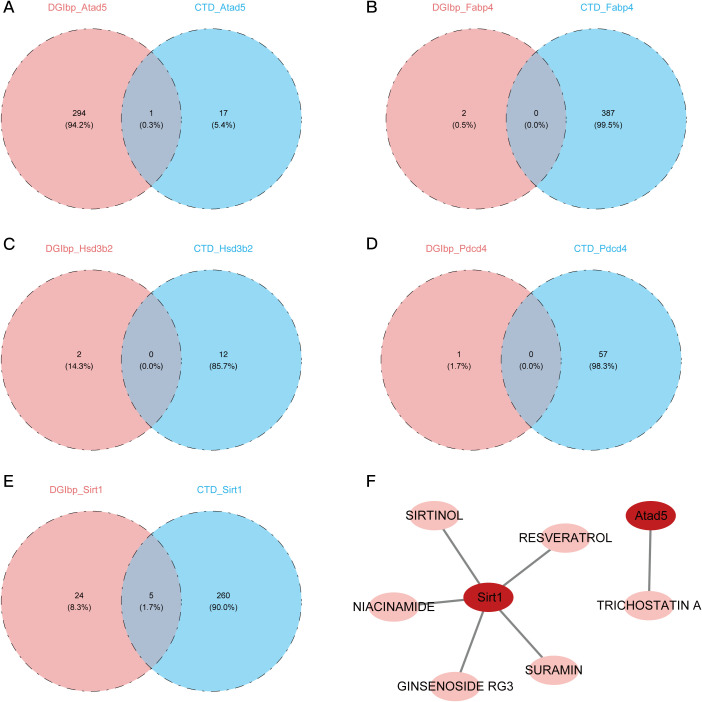
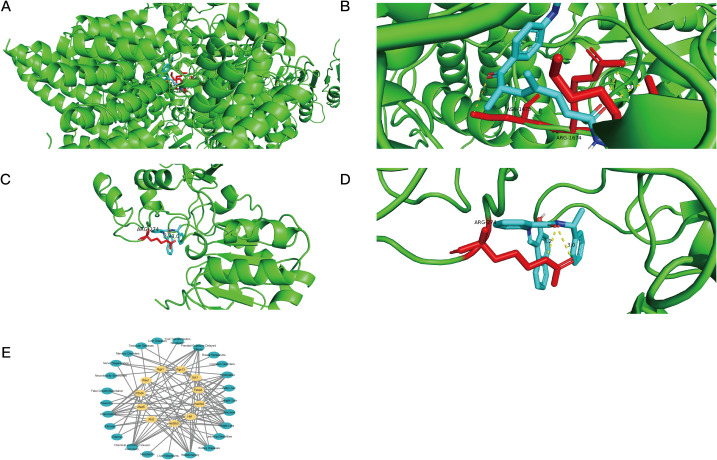
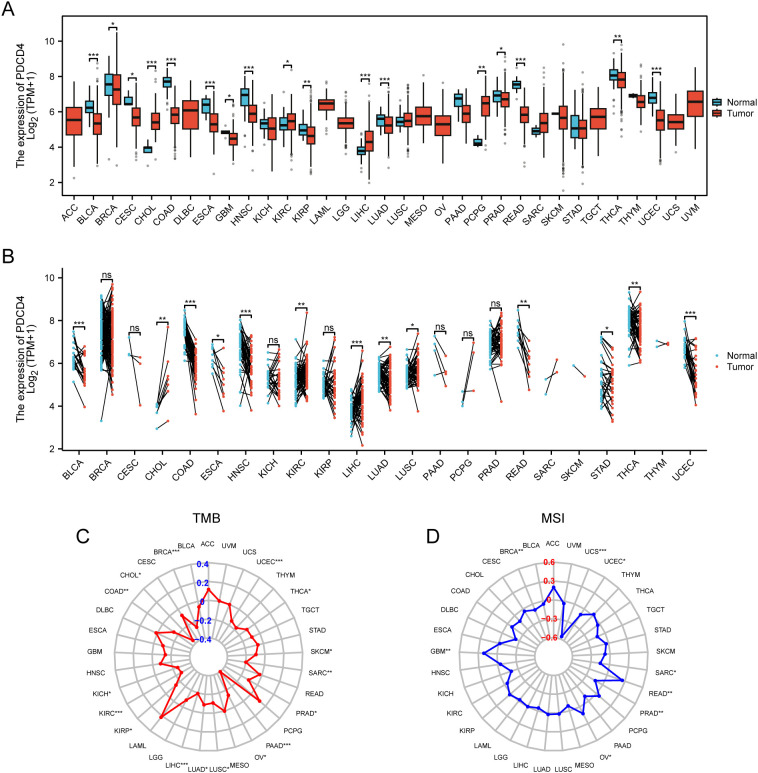
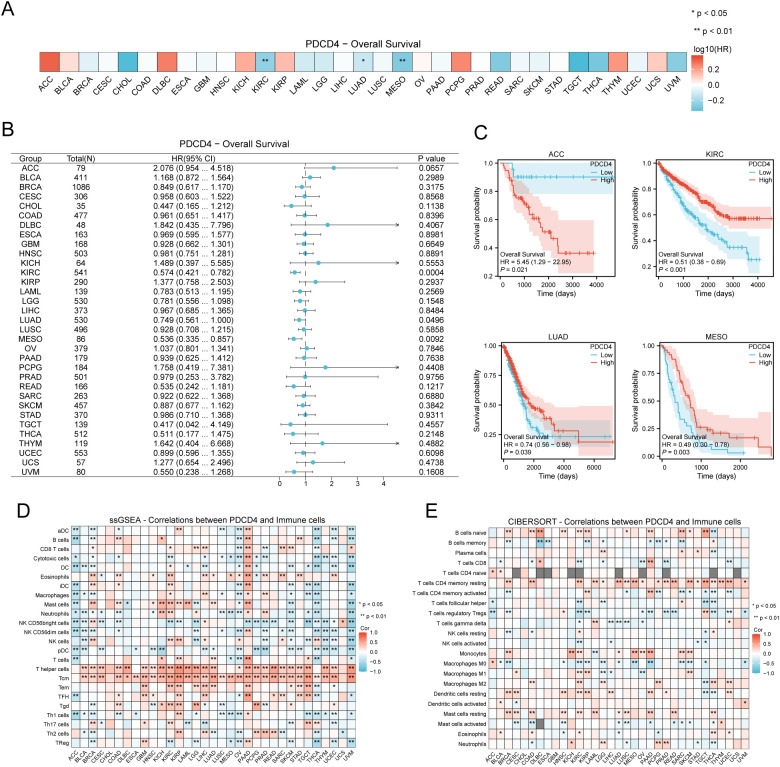
Results: qRT-PCR analysis of peripheral blood mononuclear cells (PBMCs) from AF patients and healthy controls revealed a significant upregulation of PDCD4 in AF patients. Through differential expression analysis and PPI network construction, 11 key genes were identified. In addition, mmu-miR-429-3p regulates Sirt1 while Wt1 shares regulatory roles with PDCD4, Wasl, and Abl2, and that Sirt1 and Atad5 are both regulated by Thap9. Drug prediction analyses revealed sirtinol and trichostatin as promising therapeutic drugs for targeting Atad5 and Sirt1, respectively, with good molecular docking scores (< -5 kcal/mol). SCRNA-SEQ data pinpointed arterial and venous endothelial cells as critical cell types associated with the key genes. Finally, we also found that PDCD4 dysregulation in cancers like ACC may increase AF risk through immune modulation, suggesting that targeting PDCD4 could benefit both AF and ACC patients.

Conclusions: This study demonstrates that PDCD4 modulates AF progression by regulating key genes and pathways involved in inflammation, fibrosis, and metabolic processes. Insights from transcriptome and single-cell analysis give a full knowledge of the molecular processes underlying AF and indicate PDCD4 as a possible therapeutic target.

Keywords: PDCD4; atrial fibrillation; pan-cancer analysis; single-cell RNA sequencing; transcriptome sequencing.


Conflict of interest statement

The authors declare that the research was conducted in the absence of any commercial or financial relationships that could be construed as a potential conflict of interest.

Figures

Figure 1
Figure 1
PDCD4 expression in peripheral blood mononuclear cells (PBMCs) of atrial fibrillation (AF) patients and healthy controls. Bar chart showing the relative expression levels of PDCD4 in PBMCs from AF patients (n=5) and healthy controls (n=5), determined by qRT-PCR; "****" indicates p < 0.0001. GAPDH was used as the internal control. Statistical significance was assessed using an unpaired t-test.
Figure 2
Figure 2
Differential gene expression and functional analysis associated with PDCD4 regulation in atrial fibrillation. (A) Volcano plot illustrating DEGs in the PDCD4-KO group compared to the control group, highlighting the top 10 upregulated and downregulated genes. (B) Heatmap showing the expression levels of the top 10 upregulated and downregulated DEGs in the PDCD4-KO group compared to the control group. (C) Volcano plot illustrating DEGs in the PDCD4-OE group compared to the control group, highlighting the top 10 upregulated and downregulated genes. (D) Heatmap showing the expression levels of the top 10 upregulated and downregulated DEGs in the PDCD4-OE group compared to the control group. (E) Bar chart of GSEA results for pathway enrichment analysis in the PDCD4-KO group. (F) Bar chart of GSEA results for pathway enrichment analysis in the PDCD4-OE group. (G) Venn diagram showing overlapping genes significantly upregulated in the PDCD4-KO group and downregulated in the PDCD4-OE group. (H) Venn diagram showing overlapping genes significantly downregulated in the PDCD4-KO group and upregulated in the PDCD4-OE group. (I) Circular plot summarizing GO enrichment analysis for intersecting DEGs. (J) Bar chart summarizing KEGG enrichment analysis for intersecting DEGs.
Figure 3
Figure 3
PPI network construction, chromosomal localization, and functional enrichment analysis of 11 PDCD4-associated key genes. (A) PPI network constructed using STRINGP for 47 candidate genes, with 11 nodes and 6 edges retained after removing isolated nodes. (B) Chromosomal localization of the 11 key genes visualized using RCircos, displaying their distribution across specific chromosomes. (C) Circular plot summarizing GO enrichment analysis for the 11 key genes, categorized by biological processes, cellular components, and molecular functions. (D) Bar chart summarizing KEGG pathway enrichment analysis for the 11 key genes. (E–O) GESEAN results for the 11 key genes, showing enrichment in distinct pathways related to energy metabolism, mitochondrial function, and specialized metabolic processes.
Figure 4
Figure 4
Regulatory network analysis of LncRNAs, miRNAs, and TFs associated with 11 PDCD4-related key genes. (A) Venn diagram showing overlapping LNC-RNA significantly upregulated in the PDCD4-KO group and downregulated in the PDCD4-OE group. (B) Venn diagram showing overlapping LNC-RNA significantly downregulated in the PDCD4-KO group and upregulated in the PDCD4-OE group. (C) Heatmap illustrating the correlation between 5 intersecting differentially expressed LncRNAs and the 11 key genes. (D) Venn diagram showing overlapping miRNA significantly upregulated in the PDCD4-KO group and downregulated in the PDCD4-OE group. (E) Venn diagram showing overlapping miRNA significantly downregulated in the PDCD4-KO group and upregulated in the PDCD4-OE group. (F) Venn diagram showing the overlap of miRNAs targeting differentially expressed genes as predicted by PITA and miRanda databases, with 181 common miRNAs identified. (G) Venn diagram showing the intersection of database-predicted miRNAs targeting PDCD4-associated genes and miRNAs differentially expressed in sequencing data. (H) Key miRNA-mRNA regulatory network visualized using Cytoscape (I) Transcription factor regulatory network of the 11 PDCD4-related key genes.
Figure 5
Figure 5
Characterization of cell type composition and interactions in the cardiac microenvironment of atrial fibrillation. (A) UMAP plot showing eight major cell subtypes identified via SCRNA-SEQ, including Arterial ECs, Venous ECs, Lymphatic ECs, Capillary ECs, Valvular ECs, EECs, FB-like ECs, and PC-like ECs. (B) Bubble plot illustrating the expression of marker genes specific to each identified cell subtype. (C) Bar chart displaying the cell type composition in the control and AF groups. (D) Comparative analysis of cell type proportions between the AF and control groups. (E, F) Cell-cell communication analysis between eight cell subtypes.
Figure 6
Figure 6
Prediction and identification of potential drugs targeting key genes. (A) Venn diagram showing the intersection of potential drugs targeting ATAD5 predicted by DUGID and COTD databases. (B) Venn diagram showing the intersection of potential drugs targeting FABP4 predicted by DUGID and COTD databases. (C) Venn diagram showing the intersection of potential drugs targeting HSD3B2 predicted by DUGID and COTD databases. (D) Venn diagram showing the intersection of potential drugs targeting PDCD4 predicted by DUGID and COTD databases. (E) Venn diagram showing the intersection of potential drugs targeting SIRT1 predicted by DUGID and COTD databases. (F) Identification of specific drugs targeting SIRT1, including SURAMIN, SIRTINOL, RESVERATROL, NIACINAMIDE, and GINSENOSIDE RG3, as well as a drug targeting ATAD5, TRICHOSTATIN A.
Figure 7
Figure 7
Molecular docking and disease associations of key genes. (A, B) Visualization of molecular docking results showing the interaction between ATAD5 and Trichostatin A. Blue helices represent the protein molecule, yellow dashed lines indicate hydrogen bonds, colored ring structures represent the drug ligand, and red bars mark the protein binding sites of the drug ligand. (C, D) Visualization of molecular docking results showing the interaction between SIRT1 and Sirtinol. Blue helices represent the protein molecule, yellow dashed lines indicate hydrogen bonds, colored ring structures represent the drug ligand, and red bars mark the protein binding sites of the drug ligand. (E) Analysis showing the relationships between key genes and various diseases.
Figure 8
Figure 8
Pan-cancer analysis of PDCD4 expression and mutational characteristics. (A) Boxplot showing PDCD4 expression levels across different cancer types. Tumor tissues (red) and normal tissues (blue) are compared to highlight expression differences. (B) Paired sample analysis illustrating changes in PDCD4 expression between tumor and matched normal tissues from the same patients, with black lines connecting paired samples. (C) Radar plot depicting the correlation between PDCD4 expression and TMB across various cancer types, with significance levels indicated. (D) Radar plot showing the correlation between PDCD4 expression and MSI in different cancers, with significance levels indicated. Statistical significance is marked as follows: *p < 0.05; **p < 0.01; ***p < 0.001. ns, not significant.
Figure 9
Figure 9
Prognostic value of PDCD4 and its association with immune cell infiltration in pan-cancer analysis. (A) Heatmap displaying the OS analysis results for PDCD4 across different cancer types. The color scale represents the log10(hazard ratio, HR), where blue indicates higher survival in the PDCD4 high-expression group and red indicates lower survival. (B) Forest plot summarizing the survival analysis of PDCD4 across multiple cancers. The x-axis represents the HR, with points indicating HR values and horizontal lines denoting 95% confidence intervals. (C) Kaplan-Meier survival curves illustrating the survival differences between PDCD4 high- and low-expression groups in ACC, KRCC, LADC, and MESO. (D) ssGESEAN analysis evaluating the correlation between PDCD4 expression and the infiltration of various immune cell types. Red indicates a positive correlation, while blue indicates a negative correlation. (E) CIBERSORT analysis assessing the association between PDCD4 expression and immune cell infiltration, with red indicating a positive correlation and blue indicating a negative correlation. Statistical significance is marked as follows: *p < 0.05; **p < 0.01.

Similar articles

References

    1. Al-Khatib SM. Atrial fibrillation. Ann Internal Med. (2023) 176:ITC97–112. doi: 10.7326/AITC202307180, PMID: - DOI - PubMed
    1. Lippi G, Sanchis-Gomar F, Cervellin G. Global epidemiology of atrial fibrillation: An increasing epidemic and public health challenge. Int J Stroke. (2021) 16:217–21. doi: 10.1177/1747493019897870, PMID: - DOI - PubMed
    1. Andrade J, Khairy P, Dobrev D, Nattel S. The clinical profile and pathophysiology of atrial fibrillation: relationships among clinical features, epidemiology, and mechanisms. Circ Res. (2014) 114:1453–68. doi: 10.1161/CIRCRESAHA.114.303211, PMID: - DOI - PubMed
    1. Elliott AD, Middeldorp ME, Van Gelder IC, Albert CM, Sanders P. Epidemiology and modifiable risk factors for atrial fibrillation. Nat Rev Cardiol. (2023) 20:404–17. doi: 10.1038/s41569-022-00820-8, PMID: - DOI - PubMed
    1. Chyou JY, Barkoudah E, Dukes JW, Goldstein LB, Joglar JA, Lee AM, et al. Atrial fibrillation occurring during acute hospitalization: A scientific statement from the American heart association. Circulation. (2023) 147:e676–e698. doi: 10.1161/CIR.0000000000001133, PMID: - DOI - PubMed

LinkOut - more resources