[Preprint]. 2025 Jul 28:2025.07.24.666633.
doi: 10.1101/2025.07.24.666633.

Polycomb Repressive-Deubiquitinase Complex Safeguards Oocyte Epigenome and Female Fertility by Restraining Polycomb Activity

Affiliations

Polycomb Repressive-Deubiquitinase Complex Safeguards Oocyte Epigenome and Female Fertility by Restraining Polycomb Activity

Jinwen Kang et al. bioRxiv. .

Abstract

Mouse oocytes exhibit a unique chromatin landscape characterized by broad H3K27ac and H3K27me3 domains, demarcating euchromatin and facultative heterochromatin, respectively. However, the mechanisms underlying this non-canonical landscape remain elusive. Here we report BAP1, a core component of the Polycomb Repressive-Deubiquitinase (PR-DUB) complex, as a key negative regulator of Polycomb activity during oogenesis. BAP1 restricts pervasive H2AK119ub1 accumulation in oocytes and protects oocyte-specific broad H3K27ac, particularly within gene-poor regions, from ectopic H3K27me3 deposition. While PR-DUB has been linked to gene repression, in oocytes BAP1 primarily promotes transcription and contributes minimally to Polycomb-mediated silencing. BAP1-dependent transcriptional activation is essential for oocyte developmental competence and female fertility. BAP1 loss disrupts the maternal-to-zygotic transition and impairs embryonic enhancer activation, ultimately compromising preimplantation development. Notably, while H3K27ac patterns are reset after fertilization, the aberrant H3K27me3 landscape established in BAP1-deficient oocytes persists in early embryos. Together, these findings reveal a critical role for PR-DUB in safeguarding the oocyte epigenome by protecting euchromatin from ectopic Polycomb activity, rather than enforcing transcriptional repression.

Keywords: BAP1; H2AK119ub1; H3K27ac; H3K27me3; PR-DUB; female fertility; oocyte.


Conflict of interest statement

Competing interests The authors declare no competing interests.

Figures
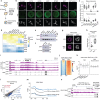
Figure 1.
Figure 1.. Loss of BAP1 causes pervasive increase of H2AK119ub1 and primarily results in gene downregulation in oocytes.
a) Experimental design. MII: metaphase II; IVF: in vitro fertilization; DUB: deubiquitinase; hpi: hrs post IVF. b) Immunofluorescence images of H2AK119ub1 and Flag tag signals for non-injected zygotes, and zygotes injected with the indicated candidate H2A DUB mRNAs. Number of zygotes analyzed are indicated. M: maternal pronuclei; P: paternal pronuclei; Pb: polar body. Scale bar: 20 μm. c) Quantification of H2AK119ub1 fluorescence intensity from panel (b). Boxplot: center line, median; box limits, 25th–75th percentiles; whiskers, ±1.5× interquartile range. ***: p < 0.001, two-sided Student’s t-test. d) RNA expression profiles of Polycomb Repressive Deubiquitinase (PR-DUB) subunits in mouse oocytes and preimplantation embryos. FGO: fully grown oocyte; LPI: late prometaphase I; PN: pronuclei; ICM: inner cell mass; mESC: mouse embryonic stem cell; FPKM: fragments per kilobase per million mapped reads. Data from public RNA-seq datasets (Xiong et al., 2022). e) Immunoblot showing dynamic expression of BAP1 across oocytes and preimplantation stages. 100 oocytes/embryos were used per sample for FGO, MII, zygote, and late 2-cell stages; 50 embryos were used for 8-cell and morula stages. f) Immunoblot confirming BAP1 depletion in FGOs from Bap1 CKO mice. 100 oocytes per group. CTR: control; CKO: conditional knockout. g) Immunofluorescence images of H2AK119ub1 in nuclei of CTR and CKO FGOs. Number of analyzed FGOs are indicated. Scale bar: 10 μm. h) Quantification of H2AK119ub1 fluorescence intensity from panel (g). Boxplot format as in (c). p-value calculated by two-sided Student’s t-test. i) Genome browser views of H2AK119ub1 and RNA levels in FGOs at the indicate genomic region. j) Heatmaps of H2AK119ub1 levels at the H2AK119ub1 domains (see Methods, n=9,921) in CTR and CKO FGOs. k) Boxplot illustrating the changes of H2AK119ub1 at the indicated genomic regions in FGO and mESC. Boxplot format as in (c). mESC H2AK119ub1 data from public datasets (Fursova et al., 2021). FC, fold change. l) Scatter plot comparing gene expression in CTR versus CKO FGOs. Red: upregulated; blue: downregulated genes in CKO. Differential expression criteria: fold change (FC) ≥ 2, adjusted p < 0.05, and FPKM ≥ 0.5. m) Metaplot showing H2AK119ub1 enrichment at gene loci that are unchanged or downregulated in Bap1 CKO FGOs. TSS: transcription start site; TES: transcription ending sites. n) Genome browser views of H2AK119ub1 and RNA levels at the Rps6kc1 and Angel2 loci in FGOs.
Figure 2.
Figure 2.. BAP1 preserves H3K27ac by preventing ectopic H3K27me3 deposition in oocytes
a) Immunofluorescence images of H3K27ac and H3K27me3 in nuclei of Bap1 control (CTR) and conditional knockout (CKO) fully grown oocytes (FGOs). Number of FGOs analyzed are indicated. Scale bar: 10 μm. b) Quantification of H3K27ac and H3K27me3 intensities from panel (a). Boxplot: center line, median; box limits, 25th–75th percentiles; whiskers, ±1.5× interquartile range. p-value: two-sided Student’s t-test. c) Heatmaps showing CUT&RUN signal intensity of H3K27ac and H3K27me3 across defined H3K27ac (n = 10,363) and H3K27me3 (n = 15,751) domains in Bap1 CTR and CKO FGOs (see Methods). d) Genome browser view depicting H3K27ac and H3K27me3 signals at the indicated genomic locus. Regions with significantly reduced H3K27ac levels in CKO FGOs (“H3K27ac-lost domains”) are indicated. e) Genomic annotation of the H3K27ac-lost domains in Bap1 CKO FGOs. f) RNA expression changes for genes associated with the indicated H3K27ac domain categories following Bap1 deletion. Boxplot format as in (b). p-value: two-sided Wilcoxon rank-sum test. g) Stacked bar plot showing the proportions of H3K27ac-lost and unchanged domains located in gene-rich versus gene-poor genomic regions. Chi-square test: ***p < 2.2×10⁻¹⁶. h) Heatmap showing H3K27ac signal during oocyte growth across H3K27ac-lost domains. The H3K27ac data for postnatal day 7 (P7), P10 growing oocytes and FGOs are from public datasets (Liu et al., 2024). i) Genome browser view of H3K27ac and H3K27me3 profiles at the Fgf10 locus. j) RNA expression levels of downregulated and unchanged genes upon Bap1 depletion in wild-type growing oocytes (GO1 and GO2) and FGOs. GO1 and GO2 are oocytes from early secondary and secondary follicles, respectively. GO1/GO2/FGO RNA-seq are from public datasets (Zhang et al., 2020). Boxplot format as in (b). p-value: two-sided Wilcoxon rank-sum test; ns: not significant.
Figure 3.
Figure 3.. BAP1 plays a limited role in Polycom-mediated gene silencing in oocytes.
a) Metaplots displaying signal intensities of H2AK119ub1, H3K27me3, and H3K27ac at Polycomb group (PcG) target genes in Bap1 control (CTR) and conditional knockout (CKO) fully grown oocytes (FGOs) (see Methods). b) Genome browser views of H2AK119ub1, H3K27me3, and H3K27ac signals at the PcG target loci Emx2 and Gata5. Public RING1B and SUZ12 ChIP-seq data in embryonic stem cells (ESCs) are included for comparison (Fursova et al., 2019). c) Venn diagram showing the overlap of PcG target genes that are de-repressed in PRC1, PRC2, and Bap1 CKO FGOs. PRC1/2 RNA-seq are from public datasets (Du et al., 2020). d) Heatmap depicting expression levels of PcG targets that are de-repressed in Bap1 CKO FGOs, compared across PRC1 and PRC2 CKO oocytes.
Figure 4.
Figure 4.. Loss of BAP1 severely impairs female reproductive capacity.
a) Fertility assessment of Bap1 control (CTR, n = 6) and conditional knockout (CKO, n = 5) female mice. Starting at 7 weeks of age, females were continuously housed with wild-type B6 males for six months. Data are presented as mean ± SD. *p < 0.05, ***p < 0.001, two-sided Student’s t-test. b) Total number of litters produced during the 6-month mating trial for Bap1 CTR (n = 6) and CKO (n = 5) females. Data are presented as mean ± SD. **p < 0.01, two-sided Student’s t-test. c) Average number of pups per litter. A total of 36 and 18 litters were analyzed for CTR and CKO groups, respectively. Data are presented as mean ± SD. ***p < 0.001 two-sided Student’s t-test. d) Number of E3.5 embryos per litter from Bap1 CTR (n=10) and CKO (n=7) females. Data are presented as mean ± SD. *p-values < 0.05, two-sided Student’s t-test. e) Brightfield images of E3.5 embryos collected from Bap1 CTR and CKO females. Embryos were cultured ex vivo for an additional 24 hours. Scale bar, 100 μm. f) Percentages of CTR and maternal knockout (matKO) embryos that reached the blastocyst stage at E3.5 and after 24-hour culture. At E3.5, 79 embryos from 10 litters (CTR) and 41 embryos from 7 litters (matKO) were analyzed. For E3.5 + 24hr culture, 36 embryos from 4 litters (CTR) and 19 embryos from 4 litters (matKO) were analyzed. Data are presented as mean ± SD. Chi-square test: ***p < 2.2×10⁻¹⁶. g) Immunofluorescence staining of CTR and matKO blastocysts (E3.5 + 24 hr culture) using antibodies against NANOG, GATA4, and CDX2. Number of blastocysts analyzed are indicated. Scale bar, 20 μm. h) Quantification of cell numbers for blastocysts shown in (j). Data are presented as mean ± SD. *p < 0.05, **p < 0.01, ***p < 0.001, two-sided Student’s t-test. i) Number of viable pups per litter at embryonic day 18.5 (E18.5) in Bap1 CTR (n = 6) and CKO (n = 8) groups. Data are presented as mean ± SD. *p-values < 0.001, two-sided Student’s t-test. j) Embryonic resorption rates at E18.5 for Bap1 CTR (n = 6) and CKO (n = 8) females. Data are presented as mean ± SD. ***p-values < 0.001, two-sided Student’s t-test. k) Schematics of IVF groups. Mat: maternal; Pat: paternal. l) Brightfield images of blastocysts of the indicated groups at 96 and 120 hrs post IVF (hpi). Scale bar, 100 μm. m) Stacked bar plot showing developmental progression of IVF embryos at specified time points. 26 (CTR), 55 (matKO), 28 (patKO), and 39 (mzKO) embryos were analyzed. 1C: one-cell stage. *p = 0.06, **p < 0.001, chi-square test.
Figure 5.
Figure 5.. Loss of maternal BAP1 causes defective maternal-to-zygotic transition
a) Schematic of sample collection timeline for total RNA-seq analysis. ZGA: zygotic genome activation; MII: metaphase II eggs. b) Scatter plots comparing gene expression between Bap1 control (CTR) and conditional knockout (CKO) oocytes/embryos at the indicated developmental stages. Red and blue dots indicate significantly upregulated and downregulated genes in Bap1 mutant, respectively. Differential expression was defined by fold change ≥ 2, adjusted p < 0.05, and FPKM ≥ 0.5. c) Venn diagram illustrating the overlap of downregulated genes in Bap1 mutant samples at GV, MII, and L1C stages. d) Bubble plot showing enrichment of differentially expressed genes in selected gene categories from the DBTMEE database. Statistical significance determined using a hypergeometric test; adjusted p-values are indicated. e) Pie charts showing the proportion of downregulated ZGA genes and upregulated maternal genes in Bap1 matKO embryos. Gene categories were defined according to Wang et al., 2022. f) Balloon plot depicting RNA expression dynamics of representative maternal, minor ZGA, and major ZGA genes at E2C and L2C stages. Three biological replicates were analyzed for each condition. g) GO terms enriched among downregulated genes in Bap1 matKO L2C embryos. h) Venn diagrams illustrating the overlap of differentially expressed genes between Bap1 and Usp16 maternal KO embryos. RNA-seq data for Usp16 samples are from public datasets (Rong et al., 2022). p-value: hypergeometric test.
Figure 6.
Figure 6.. Aberrant H3K27me3 landscapes in Bap1 null oocytes, but not H3K27ac changes, persist in early embryos
a) Quantification of H2AK119ub1, H3K27me3, and H3K27ac fluorescence intensities. Boxplot: center line, median; box limits, 25th–75th percentiles; whiskers, ±1.5× interquartile range. * p < 0.05, **: p < 0.01, ***: p < 0.001, two-sided Student’s t-test. Mat: maternal pronuclei; Pat: paternal pronuclei; hpi: hrs post IVF. b) Metaplot showing H3K27ac enrichment at maternal genes, major ZGA genes, and enhancers in Bap1 CTR and matKO late 2-cell (L2C) embryos. TSS: transcription start site. p-value: two-sided Wilcoxon rank-sum test. c) Metaplot showing H3K27me3 enrichment same as in panel b). d) Metaplots (top) and heatmaps (bottom) showing changes in H3K27me3 and H3K27ac profiles at the H3K27ac-lost domains in fully grown oocytes (FGOs) and L2C embryos from Bap1 CTR and CKO groups. For L2C embryos, allelic signals are shown separately for maternal (Mat) and paternal (Pat) alleles (see Methods). e) Genome browser views of H3K27me3 and H3K27ac profiles in FGOs and L2C embryos at the indicated genomic loci. f) Metaplots showing allelic H3K27me3 enrichment at a subset of Polycomb group (PcG) targets in late 2-cell embryos from Bap1 CTR and matKO groups. g) Genome browser views of H3K27me3 profiles in FGOs and L2C embryos at the indicated genomic loci.
Figure 7.
Figure 7.. A model illustrating the functions of PR-DUB in oocyte epigenome and female fertility.
a) BAP1 depletion causes pervasive increase of H2AK119ub1 in fully grown oocytes (FGOs), with a less extent at highly transcribed gene loci. Genes within gene deserts are preferentially down-regulated in Bap1-null FGOs, which is associated with increased H3K27me3 and reduced H3K27ac. Polycomb silencing is largely maintained at the target genes in FGOs despite moderate reduction of H3K27me3 and increase of H3K27ac. b) The aberrant H3K27me3 landscapes, but not H3K27ac, established in Bap1-null oocytes persist in early embryos. H3K27ac at enhancers, but not at ZGA gene promoters, are reduced in Bap1 maternal KO embryos. The abnormal maternal-to-zygotic transition (MZT) in Bap1 maternal KO embryos impairs preimplantation development, leading to compromised blastocyst quality and female subfertility.

Similar articles

References

    1. Blackledge N.P., Farcas A.M., Kondo T., King H.W., McGouran J.F., Hanssen L.L.P., Ito S., Cooper S., Kondo K., Koseki Y., et al. (2014). Variant PRC1 complex-dependent H2A ubiquitylation drives PRC2 recruitment and polycomb domain formation. Cell 157, 1445–1459. 10.1016/j.cell.2014.05.004. - DOI - PMC - PubMed
    1. Blackledge N.P., Fursova N.A., Kelley J.R., Huseyin M.K., Feldmann A., and Klose R.J. (2020). PRC1 Catalytic Activity Is Central to Polycomb System Function. Mol Cell 77, 857–874 e859. 10.1016/j.molcel.2019.12.001. - DOI - PMC - PubMed
    1. Blackledge N.P., and Klose R.J. (2021). The molecular principles of gene regulation by Polycomb repressive complexes. Nat Rev Mol Cell Biol 22, 815–833. 10.1038/s41580-021-00398-y. - DOI - PMC - PubMed
    1. Bonnet J., Boichenko I., Kalb R., Le Jeune M., Maltseva S., Pieropan M., Finkl K., Fierz B., and Muller J. (2022). PR-DUB preserves Polycomb repression by preventing excessive accumulation of H2Aub1, an antagonist of chromatin compaction. Genes Dev 36, 1046–1061. 10.1101/gad.350014.122. - DOI - PMC - PubMed
    1. Burton A., and Torres-Padilla M.E. (2025). Epigenome dynamics in early mammalian embryogenesis. Nat Rev Genet. 10.1038/s41576-025-00831-4. - DOI - PubMed

Publication types