[Preprint]. 2025 Jul 31:2025.07.28.667211.
doi: 10.1101/2025.07.28.667211.

A stem cell-based platform for functional analysis of genetic variants in lung disease

Affiliations

A stem cell-based platform for functional analysis of genetic variants in lung disease

Daniel J Wallman et al. bioRxiv. .

Abstract

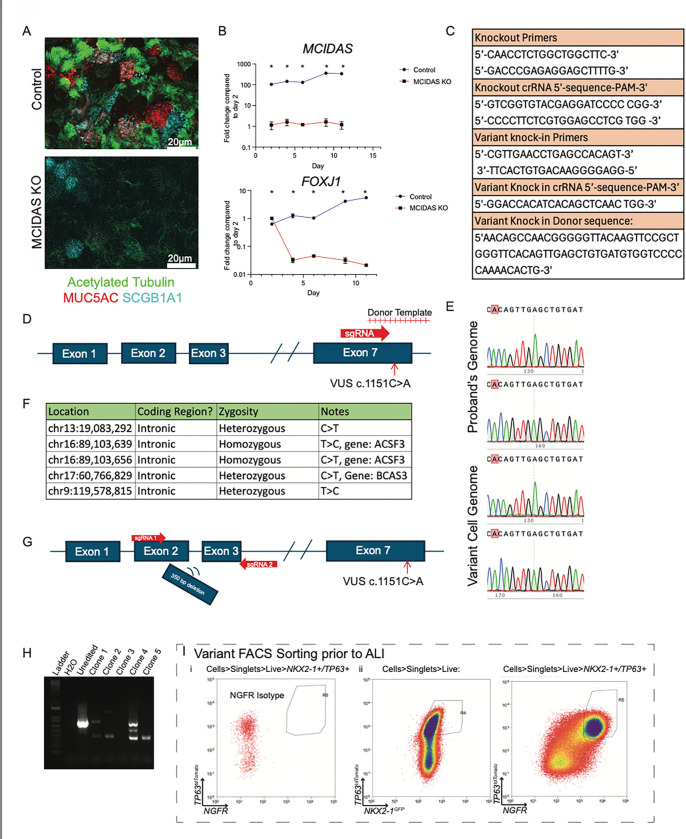
Advances in genetic and transcriptomic technologies have identified large numbers of genes and variants of potential importance to human disease. Determining the function of these genes and variants is a critical bottleneck in understanding disease etiology. Variants of uncertain significance (VUS) are highly prevalent in our genomes, but our ability to identify them significantly outpaces our ability to determine their molecular and clinical consequences. We developed a genetically tractable induced pluripotent stem cell (iPSC) based platform to investigate gene variant pathogenicity in lung disease, using primary ciliary dyskinesia (PCD) as a model. We identified an individual with a clinical diagnosis of PCD and a VUS in the gene Multiciliate differentiation and DNA synthesis associated cell cycle protein (MCIDAS). Through gene-editing of iPSC-derived airway basal stem cells (iBCs), we precisely defined the molecular and cellular pathogenicity of the variant providing a successful application of the iPSC system to diagnose a lung disease.


Figures

Extended Data 1
Extended Data 1
A) Graphical representation of nNO from combined nares compared to threshold for non-diseased controls. B) Alphafold Cofold simulation of WT MCIDAS vs MCIDAS VUS c.1151C>A demonstrating a difference in predicted quaternary structure. C) Panel of in silico prediction scores obtained via gnomAD demonstrating disconcordant predictions of pathogenicity.
Extended Data 2
Extended Data 2
A) iPSC colony immunolabeled with the pluripotency marker TRA-1–81. B) Normal karyotype (46, XX) of the proband’s iPSCs. C) Forward and reverse chain termination sequencing of proband’s iPSCs (arrows depicting VUS c.1151C>A). D) Representative flow cytometry plot of proband-iPSC-derived lung progenitors on day 15 immunolabeled with Carboxypeptidase M (CPM). E) Representative flow cytometry plot of airway progenitors derived proband-iPSCs prior to ALI culture for E) isotype and F) NGFR. F) Relative gene expression via RT-qPCR of MUC5AC from pseudostratified epithelia (n=3 Transwells per iPSC line, grown simultaneously under the same conditions as the immunolabeled specimens with ALI for 21 days. Error bars = SEM. Baseline is identified as the relative expression of the gene listed in the control sample.
Extended Data 3
Extended Data 3
A) Confocal microscopy of pseudostratified epithelium generated with ALI from unedited iBCs (top panels) and MCIDAS KO iBCs (bottom panels) immunolabeled with the antibodies indicated. Scale bar = 20 μm B) Time course analysis of relative gene expression of MCIDAS (top) and FOXJ1 (bottom) via RT-qPCR across multiple time points (day 2, 4,6,9,11 of ALI) of pseudostratified epithelia derived from Control vs MCIDAS KO iBCs. Baseline gene expression defined as relative gene expression of gene indicated at Day 2 of MCIDAS KO sample. N=3. Statistics: * = statistically significant discovery made based on multiple, unpaired two tailed Student’s t tests with False Discovery Rate (Q) of 1.00% and a Two-stage step-up (Benjamini, Krieger, and Yekutieli) method. C) Select sequences listed for: PCR amplification for knockout reaction, crRNAs used for knockout reaction, PCR amplification of variant knock-in reaction, crRNA for variant knock-in, single stranded donor sequence for variant insertion. D) Schematic depicting precision mutagenesis approach using a single guide RNA and single stranded donor template to target the VUS c.1151C>A E) Chain termination sequencing of genomic DNA from the proband (forward and reverse) vs the variant cells (forward and reverse). F) The 5 off-target effects caused by precision mutagenesis, all found in intronic regions. These 5 off-target effects were included in the 112 predicted off target effects by CHOPCHOP and CRISPOR. No other off-target effects were found via whole genome sequencing. G) Editing schematic of MCIDAS knockout targeting a 350bp deletion that includes exons 2 and 3 with VUS c.1151C>A identified for reference. H) PCR gel electrophoresis for clonal screening of putative MCIDAS knockouts with unedited amplicon length ~750nt and edited amplicon length of ~350nt. I) FACS sorting of Variant knock-in iBCs for i) NGFR isotype and ii) NKX2–1+/TP63+ and TP63+/NGFR.
Extended Data 4
Extended Data 4
A) MCC 1, 2 and 3 module scores overlayed onto UMAP of scRNA-Seq of pseudostratified epithelia derived from iPSCs over 14 days of ALI created by Hawkins et al Cell stem cell 2021, now demonstrating a distinct MCC 1 stage. B) UMAPs of the expression of module scores for cell identities in control cells C) UMAPS of the expression of module scores for all cell identities in the variant cells D) Select canonical DEGs representing distinct cell types as measured in control and variant cells. E) Jaccard similarity analysis comparing cell-type clusters from the variant and control groups. Notably, similarity is highest between Basal, Secretory, Intermediate and Dividing clusters; there is no overlap between any of the MCC clusters.
Extended Data 5
Extended Data 5
A) Top 15 Differentially expressed genes (DEGs) in each cluster of control cells B) Top 15 Differentially expressed genes (DEGs) in each cluster of variant cells
Extended Data 6
Extended Data 6
A) Map of pHAGE-EF1aL- hMCIDAS – UBC – GFP lentivirus. B) Immunolabeling of cells derived from Proband-iBCs differentiated in ALI over 14 days identifying vector transduced cells (GFP+) co-expressing acetylated Tubulin of cilia. Scale bars as listed = 5μm
Figure 1:
Figure 1:. Clinical information and genetic information for individual with clinical PCD and a VUS in MCIDAS.
A) Summary of the key testing performed on the individual to diagnose PCD include: (i) Flow volume loop demonstrating air flow obstruction (left panel, blue limb is pre-bronchodilator, red limb is post-bronchodilator, grey limb is normal tidaling or expected normal curves), (ii & iii) CT sinuses and chest (center panels) demonstrating maxillary sinus disease (blue arrow), ethmoid sinus disease (green arrow), and bronchiectasis (yellow arrows), and (iv) nasal nitric oxide testing for both nares compared to non-disease controls (right panel). PEF = peak expiratory flow; FEF25%,50%,75% = forced expiratory flow 25%,50%,75%. B) Graphical depiction of known coding variants of MCIDAS in ClinVar with pathogenicity designations listed in the legend. The TIRT domain of exon 7 is identified. The 5’ region of Exon 7 magnified to depict the variants identified with arrows color coded based on their pathogenicity in this region along with the variant c.1151C>A (p.Pro384His), depicted with a larger arrow. C) Overall schematic of the experimental approach. Human nasoepithelial cells were harvested via nasocurretage from the proband. iPSCs were generated from peripheral blood mononuclear cells (PBMC) from the proband. Precision mutagenesis to knock in the variant into iBCs from a well characterized healthy donor was performed. Samples were analyzed with transmission electron microscopy (TEM), ciliary beating frequency (CBF), single-cell RNA sequencing (scRNA-Seq) confirming PCD, conclusively determined variant pathogenicity, and identified the molecular consequence of the defect along the spectrum of MCC specification and ciliogenesis.
Figure 2:
Figure 2:. Reduced number of cilia identified in nasoepithelial cells.
A) Schematic of experimental approach to isolate the proband’s HNECs and differentiate HNECs at the air liquid interface (ALI) into a mucociliary epithelium. B) Confocal microscopy of mucociliary epithelium generated with ALI for 21 days. Top row are images from non-diseased HNEC control (“Control”) and bottom row are images from proband HNECs (“Proband”). Immunolabeling of cells listed includes MCCs (acetylated Tubulin+), Goblet (MUC5AC+) and Club (SCGB1A1+) cells. White boxes depict magnified insert. White arrows indicate a single MCC in the proband image. Scale bars include 500 μm, 40μm and 20μm. C) TEM of pseudostratified epithelia. Top row are samples from a healthy control subject demonstrating the presence of normal cilia (red arrowhead) surrounded by microvilli (white asterisk) docked in the plasma membrane via basal bodies (yellow arrow) with appropriate 9+2 axonemal structure. Bottom row are samples from the proband lacking cilia with microvilli present (white asterisk) and basal bodies present in cell cytoplasm (yellow arrow). Scale bars as listed: 1μm, 500nm, 200nm. D) Number of control MCCs per high powered field in the control (48.0 ± SEM 5.3) vs proband MCCs (1.0 ± SEM 0.3 MCC) (statistics: Error bars = SEM, Unpaired parametric Student’s t test, **** = p <0.0001). E) Mean ciliary beating frequency in hertz comparing cilia from the control to cilia from the proband. (Statistics: Error bars = SEM, Unpaired parametric Student’s t test, **** = p < 0.0001). F) Relative gene expression via RT-qPCR of MCIDAS, FOXJ1, CCDC40, MUC5AC and SCGB1A1 from pseudostratified epithelia derived from control and the proband’s HNECs. Baseline is identified as the relative expression of the gene listed in the “control” sample. (n=3 Transwells per individual, grown simultaneously under the same conditions as the immunolabeled specimens with ALI for 21 days. Error bars = SEM, Unpaired parametric Student’s t test, * = p < 0.05, ** = p < 0.01, **** = p < 0.0001).
Figure 3:
Figure 3:. Proband-derived iPSCs fail to generate MCCs
A) Schematic depicting iPSC generation, differentiation to iBCs, expansion and differentiation with ALI. B) Confocal microscopy of mucociliary epithelium generated with ALI over 20 days from unedited iBCs (“Control”) with antibodies indicated in left panel and from proband-derived (“Proband”) iBCs harboring the MCIDAS VUS c.1151C>A variant in right panel. Scale bar: 40μm. C) Transmission electron microscopy of pseudostratified epithelia derived from (left panel) control iPSCs demonstrating the presence of normal cilia (red arrowheads) surrounded by microvilli (white asterisk), docked in the plasma membrane via basal bodies (yellow arrow) and with an appropriate 9+2 axonemal structure and from (right panel) proband-iPSCs lacking cilia with microvilli present and undocked, non-replicating basal bodies present in cell cytoplasm (yellow arrows). Scale bars: 2μm, 200nm, 500nm. D) Number of MCCs per high powered field. n= 6 random fields per sample assessed, 3 biological replicates (different colors) with average depicted with open circles or squares, grown to 20 days. E) Mean CBF of MCCs derived from control iPSC vs proband iPSCs depicting a significant decrease of beating frequency in samples derived from the individual’s cells. Error bars = SEM, Unpaired parametric Student’s t test, **** = p < 0.0001. F) Relative gene expression via RT-qPCR of MCIDAS, FOXJ1, CCDC40 and SCGB1A1 from mucociliary epithelia derived from control and proband iPSCs (n=3 Transwells per iPSC line, grown simultaneously under the same conditions as the immunolabeled specimens with ALI for 21 days). Error bars = SEM, Unpaired parametric Student’s r test **** = p < 0.0001). Baseline is identified as the relative expression of the gene listed in the control sample.
Figure 4:
Figure 4:. MCIDAS VUS c.1151>A is sufficient to cause PCD
A) Schematic depicting gene editing of control iBCs using CRISPR/Cas9 to insert the MCIDAS VUS c.1151C->A into the BU3 NGPT cell line to create the “variant” and “MCIDAS KO” cell lines and compare to unedited controls. B) Confocal microscopy of mucociliary epithelium generated with ALI from control iBCs (left panels) and MCIDAS KO iBCs (right panels) immunolabeled with the antibodies indicated. Scale bar = 20μm C) Confocal imaging of mucociliarey epithelium derived from control cells (top panels i-v) and variant cells (bottom panels vi-x) for the airway epithelial markers listed. MCCs are identified by expression of acetylated-tubulin (example: yellow arrowheads) and DNAH5 (example: red arrowheads). Scale bar as listed - 20μm and 10μm. D) Immunolabeling of control cells in top panel and variant cells in bottom panel for CEP164 and acetylated Tubulin with the control sample demonstrating co-staining of acetylated-tubulin and CEP164 in the merged image. Scale bar = 50μm and 10μm as shown. E) Number of control and variant MCCs per high powered field. N= 6 random fields per sample assessed, each sample a different color with average of control in unfilled circles, average of variant as unfilled squares, replicates grown to 21 days of ALI n=3 biological replicates. Error bars = SEM, Unpaired parametric Student’s t test, * = p < 0.05). F) Relative gene expression via RT-qPCR of MCIDAS, FOXJ1, CCDC40 and DNAH5 from mucociliary epithelia derived from control and variant cells (n=3 transwells, grown simultaneously under the ALI condition to 21 days). Baseline is identified as the relative expression of the gene listed in the control sample. Error bars = SEM, Unpaired parametric Student’s t test, * = p < 0.05, ** = p < 0.01. G) Time course analysis of gene expression over 17 days of ALI differentiation comparing control to variant cells. Baseline is identified as the relative expression of the gene listed on day-1 of the variant sample. Statistics: * = statistically significant discovery made based on multiple, unpaired two tailed Student’s t tests with False Discovery Rate (Q) of 1.00% and a Two-stage step-up (Benjamini, Krieger, and Yekutieli) method.
Figure 5:
Figure 5:. ScRNA-seq benchmarks stages of multiciliogenesis and confirms that MCIDAS VUS c.1151C>A cells fail to specify to MCCs
A) Schematic of experiment detailing synchronous differentiation of variant cells vs control cells into mucociliary epithelia to undergo scRNA-Seq. B) Uniform manifold approximation and projection (UMAP) of control vs variant cells (combined analysis) grown in ALI for 21 days identifying cell type and genotype. Population bar graph of cell type grouped by genotype. C) Control analysis: UMAP of control cells separately clustered by cell type. Violin plots depicting Basal, Secretory, Intermediate, MCC 1, MCC 2, and MCC 3 module scores in the control cells. D) Variant Analysis: UMAP of variant cells separately clustered by cell type. Violin plots depicting Basal, Secretory, Intermediate, MCC 1, MCC 2, and MCC 3 module scores in the variant cells. E) Refined schematic of MCC differentiation including MCC 1, 2 and 3 stages.
Figure 6:
Figure 6:. MCIDAS expression rescues multiciliogenesis
A) Schematic depicting MCIDAS rescue via lentiviral transduction. Proband-iBCs were transduced with the EF1a-hMCIDAS-UBC-eGFP vector, differentiated, and then analyzed via immunolabeling for markers of cilia. B) Proposed schematic of rescue in the abbreviated multiciliogenesis process. C) Simplified plasmid map used for MCIDAS overexpression. D) Immunolabeling of variant cells differentiated in ALI over 14 days identifying vector transduced cells (GFP+) co-expressing acetylated Tubulin of cilia. Scale bars as listed = 10 and 2μm

References

    1. Halbisen A. L. & Lu C. Y. Trends in Availability of Genetic Tests in the United States, 2012–2022. J. Pers. Med. 13, 638 (2023). - PMC - PubMed
    1. Mills M. C. & Rahal C. A scientometric review of genome-wide association studies. Commun. Biol. 2, 9 (2019). - PMC - PubMed
    1. Svensson V., Da Veiga Beltrame E. & Pachter L. A curated database reveals trends in single-cell transcriptomics. Database 2020, baaa073 (2020). - PMC - PubMed
    1. Berger S. M. et al. Challenges of variant reinterpretation: Opinions of stakeholders and need for guidelines. Genet. Med. 24, 1878–1887 (2022). - PMC - PubMed
    1. Sim N.-L. et al. SIFT web server: predicting effects of amino acid substitutions on proteins. Nucleic Acids Res. 40, W452–W457 (2012). - PMC - PubMed

Publication types

LinkOut - more resources