[Preprint]. 2025 Aug 3:2025.08.03.668224.
doi: 10.1101/2025.08.03.668224.

Microglia-to-neuron signaling increases lipid droplet metabolism, enhancing neuronal network activity

Affiliations

Microglia-to-neuron signaling increases lipid droplet metabolism, enhancing neuronal network activity

Ana P Verduzco Espinoza et al. bioRxiv. .

Update in

Abstract

Microglia regulate neuronal circuit plasticity. Disrupting their homeostatic function has detrimental effects on neuronal circuit health. Neuroinflammation contributes to the onset and progression of neurodegenerative diseases, including Alzheimer's disease (AD), with several microglial activation genes linked to increased risk for these conditions. Inflammatory microglia alter neuronal excitability, inducing metabolic strain. Interestingly, expression of APOE4, the strongest genetic risk factor for AD, affects both microglial activation and neuronal excitability, highlighting the interplay between lipid metabolism, inflammation, and neuronal function. It remains unclear how microglial inflammatory state is conveyed to neurons to affect circuit function and whether APOE4 expression alters this intercellular communication. Here, we use a reductionist model of human iPSC-derived microglial and neuronal monocultures to dissect how the APOE genotype in each cell-type independently contributes to microglial regulation of neuronal activity during inflammation. Conditioned media (CM) from LPS-stimulated microglia increased neuronal network activity, assessed by calcium imaging, with APOE4 microglial CM driving higher neuronal firing rates than APOE3 CM. Both APOE3 and APOE4 neurons increase network activity in response to CM treatments, while APOE4 neurons uniquely increase presynaptic puncta with APOE4 microglial CM. CM-derived exosomes from LPS-stimulated microglia can mediate increases to network activity. Lastly, increased network activity is accompanied by increased lipid droplet (LD) metabolism and blocking LD metabolism abolishes network activity. These findings illuminate how microglia-to-neuron communication drives inflammation-induced changes in neuronal circuit function, demonstrate a role for neuronal LDs in network activity, and support a potential mechanism through which APOE4 increases neuronal excitability.

Keywords: APOE4; DDHD2; Inflammatory microglia; exosomes; hyperexcitability; network activity; neuronal lipid droplets.


Conflict of interest statement

Competing Interest Statement: The authors declare no competing interests.

Figures
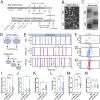
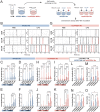
Figure 1.
Figure 1.. Exosomes from inflammatory iMGLs increase iN network activity.
A) Differentiation timelines for iMGLs and iNs. B) Representative brightfield images of D43 iMGLs after a 7-day treatment with PBS or 50ng/mL LPS. C) Transmission electron micrographs of iMGL exosomes. D) Schematic of treatment conditions. Exosomes were isolated from APOE3 iMGL conditioned media (CM) via sequential ultracentrifugation, and APOE3 D46 iNs received either PBS or exosomes from PBS- or LPS-treated iMGLs (PBS-Exos and LPS-Exos, respectively). E) Representative raster plots of Ca-imaging recordings in APOE3 iNs at D48. Imaging with calcium indicator Fluo4-AM was conducted after 48hr treatment with PBS or iMGL Exos. Blue tick marks represent coordinated events, defined as instances where >50% of cells spiked within a 250ms window (5 frames). Red tick marks represent synchronized events, defined as instances where >50% of cells spiked within a 50ms window (1 frame). F-H) Enlarged examples of activity bursts over 0.5 sec. F) Correlated activity where only 23% of cells spiked within a 250ms window, not meeting criteria for a coordinated event. G) Coordinated event in which 65% of cells spiked within a 250ms window. H) Synchronous event in which 59% of cells fired within a 50ms window. I-J) Violin plots of spike frequency (I) and amplitude (J) per cell normalized as the fold change relative to the mean of PBS-treated iNs. (N = 665–1132 cells from 2 independent experiments). K-L) Violin plots showing number of coordinated events (K) and synchronized events (L) per 100 sec recording. (N = 6–12 recordings, 1–3 recordings per well from 2 independent experiments). M-N) Violin plots showing the fraction of cells engaged in each coordinated event (M; N = 43–89 coordinated events from 2 independent experiments) or synchronized event (N; N = 18–53 synchronized events from 2 independent experiments). Violin plot lines represent median (solid) and quartiles (dashed). Median and quartile values can be found in Table S4. One-way ANOVA with Tukey test for multiple comparisons. * p < 0.05, ** p < 0.01, *** p < 0.001, and **** p < 0.0001.
Figure 2.
Figure 2.. Inflammatory APOE4 microglial signaling drives greater neuronal network activity than APOE3.
A) Schematic of experimental design. APOE3 (B-F, blue) and isogenic APOE4 (G-K, red) iNs received a half-media exchange with either unconditioned media (UCM) or iMGL CM and underwent Ca-imaging with Fluo4-AM 48hrs later. B,G) Representative raster plots of Ca-imaging recordings from APOE3 (B) and isogenic APOE4 (G) neurons treated with UCM or CM from PBS- or LPS-treated iMGLs. Red tick marks represent synchronized events. C-D,H-I) Violin plots of spike amplitude (C,H) and spike frequency (D,I) plotted as fold change relative to the average of PBS UCM-treated iNs (N = 1223–3211 cells from 4 independent experiments; Statistical comparisons were performed separately within the PBS-treated and LPS-treated groups using one-way ANOVAs followed by Tukey tests). E-F,J-K) Violin plots showing number of coordinated events (E,J) and synchronized events (F,K) per 100 sec recording (N = 26–33 recordings, 1–2 recordings per well from 4 independent experiments; Statistical comparisons were performed separately within the PBS-treated and LPS-treated groups using Kruskal-Wallis tests with Dunn’s multiple comparison tests). L-O) Violin plots showing statistical comparisons in spike frequency (L), spike amplitude (M), coordinated event count (N), and synchronized event count (O) across neuronal APOE genotype for iNs treated with LPS-stimulated iMGL CM. For L-O, statistical comparisons were performed with one-way ANOVA with Sidak multiple comparisons test. Violin plot lines represent median (solid) and quartiles (dashed), and values can be found in Table S4. * p < 0.05, ** p < 0.01, *** p < 0.001, and **** p < 0.0001.
Figure 3.
Figure 3.. Inflammatory iMGL conditioned media decreases neuronal lipid droplet load.
D48 or D24 iNs were treated with unconditioned media (UCM) or conditioned media (CM) from PBS- or LPS-treated iMGLs for 48hrs and immunolabeled for βIII-tubulin (red). Lipid droplets (LDs) were labeled with BODIPY-493/503 (green) and nuclei were labeled with DAPI (white). A) Representative images of UCM or CM-treated APOE3 (top, blue) and isoAPOE4 (bottom, red) D48 iNs. Images are max intensity projections of 10μm confocal z-stacks taken at 1μm steps and cropped for visualization. B) Quantification of LDs in APOE3 (left, blue) and isoAPOE4 (right, red) iNs. LDs were normalized to DAPI-labeled nuclei per field of view, averaged by well, and graphed as the fold change relative to UCM PBS conditions (N=9–16 wells from 3–4 independent experiments). C) Representative images of CM-treated D24 iNs and D) quantification of LDs/nuclei (N = 9–17 wells from 2–3 independent experiments). Statistical comparisons were performed separately within the PBS-treated and LPS-treated groups using one-way ANOVAs followed by Tukey’s post hoc tests. Bar graphs represent the mean with SEM. * p < 0.05, ** p < 0.01, *** p < 0.001, and **** p < 0.0001.
Figure 4.
Figure 4.. LD metabolism is required for neuronal network activity.
A) Schematic of KLH45 mechanism of action and our experimental hypothesis. DDHD2 sits on the surface of lipid droplets (LDs) and breaks down triglycerides (TGs) into free fatty acids (FFAs). KLH45 inhibits DDHD2, which in turn results in cells accumulating LDs. We hypothesized that if LD metabolism supports neuronal network activity, KLH45 would result in a decrease of network activity. B-E) D48 iNs were treated with vehicle or 5μM KLH45 for 24hrs and analyzed for relative changes in LDs and synapses. B) Representative images of D48 iNs immunolabeled for βIII-tubulin (red) with LDs labeled with BODIPY-493/503 (green) and nuclei labeled with DAPI (white). Images are max intensity projections of 10μm confocal z-stacks taken at 1μm steps and cropped for visualization. C) Quantification of LDs per field of view, normalized to neurite area, and averaged by well. Data are shown as fold change relative to the APOE3 Vehicle condition (N = 9–10 wells from 2 independent experiments; Two-way ANOVA with Sidak correction for multiple comparisons). D) Representative images of iNs immunolabeled for βIII-tubulin (white) and synapsin 1/2 (red) with nuclei labeled with DAPI (blue). Confocal images were cropped for visualization. E) Quantification of synapsin puncta per field of view, normalized to neurite area, and averaged by well. Data are shown as fold change relative to the APOE3 Vehicle condition (N = 9–10 wells from 2 independent experiments; Two-way ANOVA with Sidak correction for multiple comparisons). F) Schematic of KLH45 treatment timeline used for Ca-imaging with Fluo4-AM in D48 iNs. iNs received a 24hr pre-treatment with either vehicle (EtOH) or 5μM KLH45. KLH45 was either removed (KLH45 Pre) or kept (KLH45 Pre+Post) during Ca-imaging. G) Representative raster plots. Red tick marks represent synchronized events. H-M) Quantification of Ca-imaging features for APOE3 (H-J, blue) and isoAPOE4 (K-M, red) iNs. H,K) Quantification of average spike frequency per cell normalized as the fold change to the average of Veh-treated iNs (N = 326–3236 cells from 2 independent experiments). I,L) Quantification of average spike amplitude per cell, normalized as the fold change to the average of Veh-treated iNs (N = 326–3236 cells from 2 independent experiments). J,M) Violin plots showing quantification of coordinated events per 100sec recording session (N = 17–20 recordings, 1–2 recordings per well from 2 independent experiments). One-way ANOVA with Tukey correction for multiple comparisons. Bar graphs represent the mean and error bars represent SEM. Violin plot lines represent median (solid) and quartiles (dashed), and values can be found in Table S4. * p < 0.05, ** p < 0.01, *** p < 0.001, and **** p < 0.0001.

References

    1. Marinelli S., Basilico B., Marrone M. C., Ragozzino D., Microglia-neuron crosstalk: Signaling mechanism and control of synaptic transmission. Semin Cell Dev Biol 94, 138–151 (2019). - PubMed
    1. Akiyoshi R. et al. , Microglia Enhance Synapse Activity to Promote Local Network Synchronization. eneuro 5, ENEURO.0088–0018.2018 (2018). - PMC - PubMed
    1. Clark A. A.-O. X. et al. , Selective activation of microglia facilitates synaptic strength. (2015). - PMC - PubMed
    1. Lambert J.-C. et al. , Meta-analysis of 74,046 individuals identifies 11 new susceptibility loci for Alzheimer’s disease. Nature Genetics 45, 1452–1458 (2013). - PMC - PubMed
    1. Karch Celeste M., C. Cruchaga, Alison M. Goate, Alzheimer’s Disease Genetics: From the Bench to the Clinic. Neuron 83, 11–26 (2014). - PMC - PubMed

Publication types