[Preprint]. 2025 Jul 29:2025.07.29.667523.
doi: 10.1101/2025.07.29.667523.

Regulatory Plasticity and Metabolic Trade-offs Drive Adaptive Evolution of Alternative Flagellar Configurations in Pseudomonas aeruginosa

Affiliations

Regulatory Plasticity and Metabolic Trade-offs Drive Adaptive Evolution of Alternative Flagellar Configurations in Pseudomonas aeruginosa

Anali Migueles Lozano et al. bioRxiv. .

Abstract

Evolutionary constraints governing flagellar number in bacterial pathogens remain poorly understood. While related Pseudomonas species are hyperflagellated, P. aeruginosa maintains strict monoflagellation through the FleQ-FleN regulatory circuit. Here, we demonstrate that FleN dosage is essential for maintaining monoflagellation and bacterial fitness. Wild-type P. aeruginosa consistently displayed unipolar monoflagellation, while ΔfleN mutants developed over two-to-five flagella per cell in uni- or bipolar arrangements. Hyperflagellated ΔfleN cells exhibited severe fitness defects including reduced growth rates, attenuated virulence in nematode infection models, and competitive disadvantages in co-culture experiments. Remarkably, ΔfleN cells rapidly evolved suppressor mutations in fleQ that partially restored growth and motility without always restoring monoflagellation. Five independent suppressor alleles mapped to critical FleQ functional domains (four in the AAA+ ATPase domain, one in the DNA-binding domain), suggesting reduced protein activity that rebalances the disrupted regulatory circuit. Single-cell motility analysis revealed that suppressor strains exhibit heterogeneous swimming dynamics, with subpopulations achieving wild-type speeds despite carrying multiple flagella. Proteomic analysis demonstrated that hyperflagellation triggers extensive cellular reprogramming beyond flagellar components, affecting metabolic pathways, stress responses, and signaling networks. While hyperflagellated cells suffered complete loss of pathogenicity in animal infection models, environmental selection under viscous conditions could drive wild-type cells to evolve enhanced motility through specific fleN mutations. These findings suggest that bacterial flagellar regulatory circuits function as evolutionary capacitors, normally constraining phenotypic variation but enabling rapid adaptation to alternative motility configurations when environmental pressures exceed the performance limits of standard monotrichous flagellation.


Conflict of interest statement

CONFLICT OF INTEREST The authors declare that they have no conflict of interest.

Figures

Fig. 1:
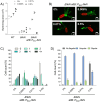
Fig. 1:. Flagellar number and patterning in WT and fleN mutant strains.
A) Schematic of the conserved flagellar architectural domains and FleQ-FleN regulatory axis. FleQ is the master transcriptional factor of flagellar genes, and its activity is directly inhibited by the antiactivator FleN. FleQ promotes the expression of FleN. B) Top row: Representative images of swimming phenotype in low agar concentration plates (0.3%) of (from left to right) WT, ΔfleQ, fleNV178G and ΔfleN strains. Bottom row: Representative images of flagellar patterning of (from left to right) WT, ΔfleQ, fleNV178G and ΔfleN. Flagellar filament and membrane stained using Alexa488 (green) and membrane dye (FM4-64), respectively. C) Swimming area measurement of WT, ΔfleQ, fleNV178G and ΔfleN strains. Error bars represent the SD of three biological replicates. Statistical significance was determined using t-test pairwise comparisons in GraphPad Prism software. **** P<0.0001, *** P<0.001 D) Percentage of cells exhibiting varying number of flagella during exponential growth phase (OD600 0.5) in WT, ΔfleQ, fleNV178G and ΔfleN strains; 50 cells per replicate, n=3. Grey: non-flagellated, Cyan: 1, Turquoise: 2, Dark turquoise: 3, Emerald green: 4, Dark green: More than 4 flagella per cell. E) Percentage of cells with different flagellar placement from the cells in panel D).
Fig. 2:
Fig. 2:. FleN dosage controls flagellar number and swimming motility.
A) Swimming area measurement of WT, ΔfleN and ΔfleN attB::PBADfleN strains, using 0%, 0.006%, 0.01% and 0.5% concentrations of arabinose. Error bars represent the SD of three biological replicates. B) Representative images of flagellar patterning of ΔfleN attB::PBADfleN strain at indicated arabinose concentrations. Flagellar filament and membrane stained using Alexa488 (green) and membrane dye (FM4-64), respectively. C) Percentage of cells exhibiting varying number of flagella during exponential growth phase (OD600 0.5) in ΔfleN attB::PBADfleN strain at the indicated arabinose concentrations, 50 cells per replicate, n=3. Grey: non-flagellated, Cyan: 1, Turquoise: 2, Dark turquoise: 3, Emerald green: 4, Dark green: More than 4 flagella per cell. D) Percentage of cells with different flagellar placement from the cells in panel C).
Fig. 3:
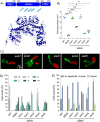
Fig. 3:. ΔfleN cells develop suppressor mutations in fleQ that restore motility but not number of flagella.
A) Box (up) and Alphafold3 (down) representation of FleQ protein. In the Box diagram and Alphafold3 models, ΔfleN suppressor mutations in fleQ are denoted in cyan. Alphafold3 model of FleQ dimer (navy blue). B) Swimming area measurement of the indicated strains. Error bars represent the SD of three biological replicates. Statistical significance was determined using t-test pairwise comparisons in GraphPad Prism software. ** P <0.005, * P<0.01. C) Representative images of flagellar patterning of the indicated strains: son1 (fleQL327M), son2 (fleQR340H), son3 (fleQN367S), son4 (fleQV383G), son5 (fleQE442Q). Flagellar filament and membrane stained using Alexa488 (green) and membrane dye (FM4-64), respectively. D) Percentage of cells exhibiting varying number of flagella during exponential growth phase (OD600 0.5) in the indicated strains, 50 cells per replicate, n=3. Grey: non-flagellated, Cyan: 1, Turquoise: 2, Dark turquoise: 3, Emerald green: 4, Dark green: More than 4 flagella per cell. E) Percentage of cells with different flagellar placement from the cells in panel D).
Fig. 4:
Fig. 4:. 3D Holographic tracking of single cell dynamics shows heterogenous swimming behaviors.
A) Mean speed (displacement over time) is calculated for individual cell trajectories captured swimming for up to 15 seconds. Each point represents an individual cell, with data collected across two biological replicates. B) Three-dimensional trajectories are displayed for four individual cells with mean speeds pointed out as i-iv in panel A. Color indicates instantaneous speed. i) A straight WT trajectory, showing typical high mean speed behavior. ii) A low mean speed ΔfleN trajectory, showing both a helical path (upper) and a meandering path (lower). iii) A high mean speed son2 trajectory, showing recovery of swimming in a straight line. iv) A low mean speed son2 trajectory showing strong helicity. C) A son2 cell (cell body in red, constitutively fluorescent) with unbundled flagella (green) on its left side, with both channels imaged simultaneously while the cell is swimming. A small point of green on the right side indicates flagella on the opposite pole, possibly wrapped around the cell. White dots show the progress of the cell body over 3.3 seconds of swimming, displaying a directed helical trajectory. Scale bar 10 μm. D) Another son2 cell with flagella active on both poles, undergoing a meandering trajectory, as shown by the white dots that mark the cell body position during 3.8 seconds of swimming. Scale bar 10 μm. E-F) Distribution of the single cells’ behaviors across the different strains in terms of E) Distance per trajectory and F) Number of turns per trajectory. Smoothed using kernel density estimation (KDE).
Fig. 5:
Fig. 5:. ΔfleN mutant exhibits a growth defect compared to WT.
A) Growth curve of WT and ΔfleN cells, n=3. B) Growth curve of WT, ΔfleN and fleNV178G strains, n=3. C) Growth curve of ΔfliF, ΔfleN and ΔfleNΔfliF strains, n=3. D) Growth curve of ΔfleN suppressors, son1-5. For panels A-C, statistical test: nonparametric Mann Whitney test, significant p-values are less than 0.01. E) Proteomics analysis of WT and ΔfleN strains. t-test Non-parametric, Kolmogorov-Smirnov (KS) test. Significant p-values are less than 0.01.
Fig. 6:
Fig. 6:. Hyperflagellated strains exhibit competitive disadvantage and decreased twitching and virulence.
A) Competition between WT and ΔfleN cells in shaken cultures. Competition index (CI) is the ration between number of cells of each strain at the end of the assay relative to number of cells of each strain at the beginning of the assay, n=3. CI~1= No difference, CI<1=Mutant cells decrease, CI>1=Mutant cells increase. Statistical tests: WT/ΔfleN and WTmix/ΔfleNmix unpair t-test. WT/WTmix and ΔfleN/ΔfleNmix parametric Ratio paired t-test. B) Twitching motility of WT, ΔfleN and ΔfleN suppressor strains. Error bars represent the SD of three biological replicates. Statistical significance was determined using t-test pairwise comparisons in GraphPad Prism software. **** P<0.0001 C-D) Worm slow-killing assay where C. elegans were applied to lawns of E. coli OP50 and the indicated WT and mutant P. aeruginosa strains. Error bars represent SEM of three independent experiments.

Similar articles

References

    1. Allan D. B., Caswell T., Keim N. C., van der Wel C. M., & Verweij R. W. (2024). soft-matter/trackpy: 0.6.2rc1. Zenodo. 10.5281/zenodo.10674547 - DOI
    1. Amako K., & Umeda A. (1982). Flagellation of Pseudomonas aeruginosa during the cell division cycle. Microbiology and Immunology, 26(2), 113–117. 10.1111/j.1348-0421.1982.tb00160.x - DOI - PubMed
    1. Ambreetha S., & Balachandar D. (2022). Pathogenesis of plant-associated Pseudomonas aeruginosa in Caenorhabditis elegans model. BMC Microbiology, 22(1), 269. 10.1186/s12866-022-02682-z - DOI - PMC - PubMed
    1. Amiel E., Lovewell R. R., O’Toole G. A., Hogan D. A., & Berwin B. (2010). Pseudomonas aeruginosa evasion of phagocytosis is mediated by loss of swimming motility and is independent of flagellum expression. Infection and Immunity, 78(7), 2937–2945. 10.1128/IAI.00144-10 - DOI - PMC - PubMed
    1. Arora S. K., Neely A. N., Blair B., Lory S., & Ramphal R. (2005). Role of motility and flagellin glycosylation in the pathogenesis of Pseudomonas aeruginosa burn wound infections. Infection and Immunity, 73(7), 4395–4398. 10.1128/IAI.73.7.4395-4398.2005 - DOI - PMC - PubMed

Publication types

LinkOut - more resources