[Preprint]. 2025 Aug 2:2025.07.31.667872.
doi: 10.1101/2025.07.31.667872.

Structures of dynamic interactors at native proteasomes by PhIX-MS and cryoelectron microscopy

Affiliations

Structures of dynamic interactors at native proteasomes by PhIX-MS and cryoelectron microscopy

Kitaik Lee et al. bioRxiv. .

Abstract

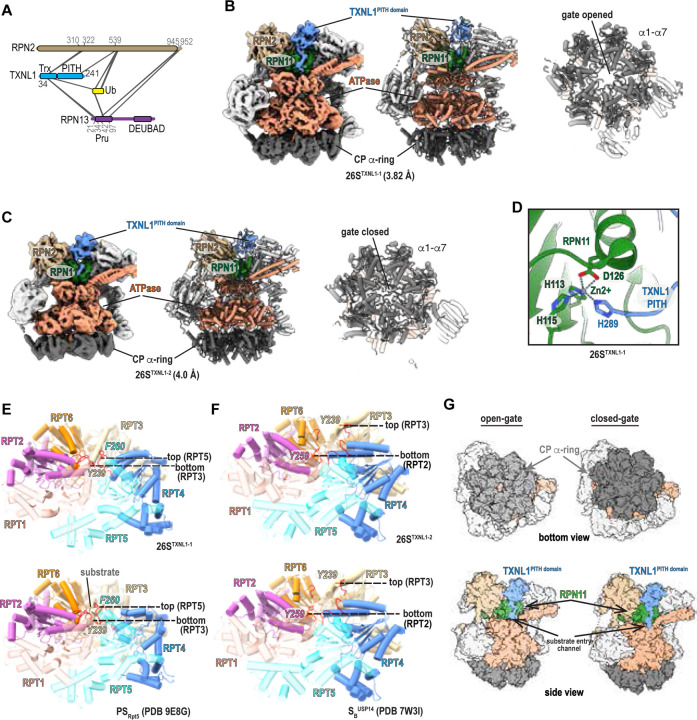
Proteasome function depends on a network of transient interactions that remain structurally and functionally unresolved. We developed PhIX-MS (Photo-induced In situ Crosslinking-Mass Spectrometry), a structural proteomics workflow that stabilizes transient interactions in cells by UV-activated crosslinking to capture topological information. Applying PhIX-MS with cryo-electron microscopy (cryo-EM), we mapped redox sensor TXNL1 at the proteasome regulatory particle (RP), placing its PITH domain above deubiquitinase RPN11 and resolving its dynamic thioredoxin domain near RPN2/PSMD1 and RPN13/ADRM1, ideally located to reduce substrates prior to proteolysis. We also resolved chaperone PSMD5 bound to RP without the proteolytic core particle (CP) where its C-terminus inserts into the ATPase pore blocking CP binding. PhIX-MS and AlphaFold modeling tether ubiquitin ligase UBE3C/Hul5 along the RP placing its catalytic site above the RPN11 active site, enabling their coupled activities. Our integrative approach enables the localization of native, low-affinity protein interactions and is broadly applicable to dynamic macromolecular assemblies.

Keywords: PSMD5; TXNL1; UBE3C; in situ mass spectrometry; proteasome.


Conflict of interest statement

Declarations of Interest The authors declare no competing interests.

Figures

Figure 1.
Figure 1.. PhIX-MS approach
(A) Surface rendering of the 26S proteasome to highlight subunits engineered to include a biotinylated tag. (B) PhIX-MS workflow to capture structural information on the proteasome interactome in situ. i) Protein complexes are trapped inside cells by addition of crosslinking agent SDA. Following 20 minutes of incubation, high intensity UV-irradiation is applied for 10 seconds. ii) Immunoprobing lysates for RPN1 indicates higher molecular weight protein complexes following crosslinking of cells. iii) Crosslinked proteasomes are pulled down on streptavidin beads. On-bead digestion is used to identify enriched proteins by AP-MS. Proteasomes are eluted with TEV for analysis by crosslinking MS. The detailed workflow and the crosslinking validation is shown in Figure S1D. (C) AP-MS plots of pulldown of biotin-tagged RPN1 from crosslinked cells. Crosslinked wild-type cells are used as the control. Proteins are color-coded by category—core particle (CP, pink), regulatory particle (RP, dark blue), immunoproteasome subunit (red), alternative cap component (orange), proteasome chaperone (green), or other established proteasome binders (cyan). The horizontal dashed line denotes statistical significance (BH-adjusted P < 0.05), and the vertical dashed lines mark log2-fold changes in abundance between tagged and wild-type pulldowns. Dot size represents label-free quantification (LFQ) intensity for each protein. (D) Same as for ‘C’ but with of biotin-tagged RPN11. (E) Rank intensity plots showing protein abundance (Intensity from MSFragger search) of protein abundances from biotin-tagged RPN1 pulldowns, both from crosslinked and non-crosslinked cells. (F) Same as for ‘C’ but with of biotin-tagged PSMB4.
Figure 2.
Figure 2.. PhIX-MS derived crosslinks and structural modelling localize UBE3C on the RP.
(A) Crosslink-based protein-protein interaction network of proteins bound to the proteasome filtered for those enriched by AP-MS. (B) Protein sequence location of crosslinked residue pairs between UBE3C and proteasome subunits with domains annotated. The UBE3C catalytic cysteine (C1051) is also labeled. (C) Immunoblots for UBE3C and GFP as indicated of RPN1-tagged cell lysates (bottom) or following pulldown with streptavidin resin (top) without (− or with (+) overexpression of UBE3CN-term-GFP. PSMB5 and β-actin were used as controls. (D) Immunoblot for UBE3C of samples from a pulldown experiment in which glutathione sepharose resin bound to GST-RPN10UIM1–2, GST-RPN10UIM1, or GST (control) was incubated with HCT116 whole cell lysates, washed to remove unbound proteins, and the proteins then eluted by 2X SDS loading dye prior to SDS-PAGE and immunoprobing with anti-UBE3C antibodies (left). As a loading control for the bound proteins, the PVDF membrane was stained with Ponceau reagent and imaged before immunoprobing (right). (E) AlphaFold3 model of UBE3C bound to proteasomal subunits RPN2, RPN3, RPN8, RPN9, RPN10, RPN11, and RPN12 (top, ribbon) docked onto a human 26S proteasome cryo-EM structure in the substrate engaged state (PDB 6MSE, top, surface) showing in the middle panels RPN2 (indigo), RPN3 (pale pink), RPN10 (purple), RPN11 (green) highlighting its active site (orange), and UBE3C (cyan, catalytic cysteine C1051, indigo sphere) as ribbon (AlphaFold3) or surface (PDB 6MSE) displays. Enlarged ribbon diagrams are included below of boxed regions to highlight residue pairs identified by PhIX-MS, including UBE3C K565 to RPN2 D531 (left), UBE3C K442 to RPN10 E226 (middle), and UBE3C K13 to RPN3 E304 and A305 (right). (F) Cartoon of coordinated UBE3C and RPN11 activities for processive translocation of a substrate into the CP. UBE3C (cyan) is shown at the RPN2-RPN10-RPN11 interface adding ubiquitin (yellow) to a proteasome-bound substrate (red, left) priming it for deubiquitination by RPN11 (green with catalytic region in orange) thereby promoting substrate translocation through the ATPase substrate entry channel (right). The model structure is generated from that in panel (E) and follows the same coloring scheme.
Figure 3.
Figure 3.. Structures of 26S proteasomes with TXNL1 determined by cryo-EM.
(A) Protein sequence location of crosslinked residue pairs between TXNL1 and proteasome subunits or ubiquitin. (B) Cryo-EM density map (3.82 Å, left) and corresponding ribbon diagram (middle) of 26STXNL1-1. The CP α-ring (dark grey), ATPase (light orange), RPN2 (beige), RPN11(green) and TXNL1 PITH domain (blue) are highlighted and labeled, with the other proteasome subunits colored light grey. The right panel shows a bottom view of the CP α-ring and illustrates the opened gate CP conformation. (C) Cryo-EM density map (4.0 Å, left) and corresponding ribbon diagram (middle) of 26STXNL1–2 colored as in (B). The right panel shows the bottom view of the CP α-ring and illustrates the closed gate CP conformation. (D) Expanded view of 26STXNL1-1 to display TXNL1 PITH domain and C-terminal residue H289 coordination with the RPN11 Zn2+ (purple sphere) and its additional coordination with H113, H115 and D126 of RPN11. (E and F) Expanded views of the ATPase large AAA+ subdomains in aligned 26STXNL1-1 (E, top) and PSRpt5 (PDB 9E8G, E, bottom), or 26STXNL1–2 (F, top) and SBUSP14 (PDB 9E8G, F, bottom). RPT subunits are displayed as ribbon diagrams and colored in maroon (RPT1), magenta (RPT2), orange (RPT6), beige (RPT3), light blue (RPT4), and cyan (RPT5), with the pore-1 loops colored in red and the sidechain of the central Tyr/Phe residues in pore-1 loops displayed. The Cα positions of the top and bottom Tyr/Phe residues in pore-1 loops are highlighted and labeled by black dash lines. (G) Cartoon depicting the TXNL1 PITH domain (blue) at the proteasome RP with an open (left) or closed (right) CP α-ring (grey). A cutaway view looking through the α-ring to the RP (top) and side view (bottom) highlighting RPN11 (green), the ATPase ring (pink), and the substrate entry channel is displayed. Figure 3B–3G were prepared using UCSF ChimeraX.
Figure 4.
Figure 4.. PhIX-MS guides placement of the TXNL1 Trx domain.
(A) Top panel: Ribbon diagram for an enlarged region of 26STXNL1-1 centered on RPN2 (beige) and TXNL1 (light blue), with the density map displayed in grey. The extreme C-terminus of RPN2 (D953) is not visible and residues E922 – H931 of RPN2 are displayed as spheres. Bottom panel: Expanded structural region to display the contact surface for RPN2 and TXNL1 Trx domain. Sidechains of TXNL1 I88, Y91, Q92, D95, and E101 (light blue) are displayed and labeled, as are RPN2 E391, A394, R395, K401, T431, P434 (beige). Hydrogen bonds are displayed as red lines. Oxygen and nitrogen atoms are colored red and blue, respectively. (B) Expanded view of overlaid 1H-15N HSQC spectra of 20 μM 15N-labeled RPN13Pru preincubated with equimolar unlabeled RPN2940–953 (black), and with 5-fold (cyan), 10-fold (green), or 15-fold (purple) molar excess unlabeled TXNL1 Trx. RPN13Pru signals that shift or attenuate following addition of unlabeled TXNL1 Trx are labeled and underlined. (C, D) Expanded view of overlaid 1H-15N HSQC spectra of 22 μM 15N-labeled RPN13Pru or 25 μM 15N-labeled RPN13DEUBAD in reduced (redu, shades of pink) or oxidized (oxi) states without (black) or with 4-fold molar excess TXNL1 Trx domain (shades of blue). The enlarged regions focus on (C) residues F98 (top) and M31 (bottom) or (D) residues G360 (top) and G353 (bottom). All the spectra were collected in 600 MHz at 10 °C with NMR buffer containing 20 mM sodium phosphate and 50 mM NaCl (pH 6.0); 1 mM DTT was also included in reduced samples. (E) Binding affinity, Kd (nM), determined by isothermal titration calorimetry for RPN2 peptide (940–953) binding to reduced (redu) or oxidized (oxi) RPN13Pru and oxi-RPN13Pru following incubation with 3-fold molar excess TXNL1Trx. TXNL1Trx was removed prior the measurements by size exclusion chromatography. (F) Cartoon of the proteasome RP plus CP α-ring (grey) illustrating an incoming substrate (brown) that is oxidized and ubiquitinated (yellow) being reduced by TXNL1 (blue, left) prior to its translocation into the CP (right). The RPN13 Pru domain (purple) is shown bound to the ubiquitin chain (yellow) of the reduced substrate (yellow-brown). Figure 4A and 4F were prepared using UCSF ChimeraX.
Figure 5.
Figure 5.. PSMD5 binds to the intact RP.
(A) PSMD5 sequence plot showing crosslinks to all 6 RP ATPase subunits, including at its disordered C-terminal tail. (B) Co-fractionation MS data from an RPN1 pulldown separated by size exclusion chromatography suggests that PSMD5 elutes with the free RP. 20S and alternative cap elution profiles localize 26S and larger proteasome complexes. (C) Overexpression of HA-tagged PSMD5 causes reduction of 20S subunits in an RPN1 pulldown. The horizontal dashed line denotes statistical significance (BH-adjusted P < 0.05), and the vertical dashed lines mark log2-fold changes in abundance between HA-PSMD5 and control. (D) Chymotrypsin-like proteasome activity assays (left) show that HA-PSMD5 overexpression diminishes proteasome activity. Orange and green dots represent individual replicates of the control and HA-PSMD5 overexpression, respectively. Immunoblots (right) confirm HA-PSMD5 expression, with RPN1, PSMB5, ECM29, and β-actin serving as controls.
Figure 6.
Figure 6.. Structures of the 19S RP with TXNL1 and PSMD5 determined by cryo-EM.
(A) Cryo-EM density map of 19STXNL1-1, ΔRPT1, ΔRPT2 (3.02 Å, left), 19STXNL1–2 (4.22 Å, middle), and 19SΔTXNL1-1 (3.92 Å, right). The ATPase (RPT3, RPT4, RPT5, and RPT6, light orange), RPN1 (beige), and TXNL1(blue) are highlighted and labeled, with the other RP subunits colored light grey. (B) Cryo-EM density map of 19STXNL1-1 (4.58 Å, left) and following 70° rotation about the x-axis, using a counterclockwise convention (right). RPT1 (red), RPT2 (magenta), RPN1 (beige), and TXNL1(blue) are highlighted and labeled, with the other RP subunits colored light grey. Extra density adjacent to RPT1/RPT2 is colored in green. (C) PSMD5 (green) structure fitted into the extra density adjacent to RPT1 and RPT2 of a low-pass-filtered (10 Å) 19STXNL1-1 map. (D) Expanded view of 19STXNL1-1 showing the crosslinks between PSMD5 (green) and RPT subunits as dashed lines and colored blue for distances <21.5 Å and yellow for one between 21.5 and 28.5 Å. (E) Left: Ribbon diagram showing the ATPase central channel with the PSMD5 C-terminus inserted. Right: Expanded structural region displaying the contact surface between the PSMD5 C-terminal residues and RPT subunits. Sidechains of PSMD5 S496, T498, V500, E501, A503 and E504 (green) are displayed and labeled, as are RPT2 S299 (magenta), RPT6 G264, G265, S267 (orange), RPT3 K238, L240 (beige), RPT4 K206, I208 (light blue), and RPT5 R304 (cyan). Hydrogen bonds and crosslinked residues are represented by red dashed and blue lines, respectively. (F) Expansion of the PSMD5 Cterminal tail with crosslinked residues RPT6 K222, RPT3 Y239 and K238, and RPT4 K206, colored as in (E). (G and I) Expanded views of the ATPase large AAA+ subdomains in aligned 19STXNL1-1 (F, top), PSRpt6 (PDB 9E8K, G, middle), and PSRpt2+Eos (PDB 9E8O, G, bottom), or 19STXNL1–2 (I, left) and RS.2TXNL1 (PDB 9E8H, I, right). RPT subunits are displayed as ribbon diagrams and colored in maroon (RPT1), magenta (RPT2), orange (RPT6), beige (RPT3), light blue (RPT4), and cyan (RPT5), with the pore-1 loops colored in red and the sidechain of the central Tyr/Phe residues in pore-1 loops displayed. The Cα positions of the top and bottom Tyr/Phe residues in pore-1 loops are highlighted and labeled by black dashed lines. In (G and I), Cα- Cα distances between the top and bottom Tyr/Phe residues in pore-1 loops are displayed. (H) Top views of the ATPase large AAA+ subdomains in aligned 19STXNL1-1 (left) and PSRpt2+Eos (right), with the same color scheme as used in (G). The reduced interleaving between RPT1/RPT2 and the neighboring RPT subunits in 19STXNL1-1 is highlighted by a black dashed line (left), as is the reduced interleaving between RPT5/RPT1 and the neighboring RPT subunits in PSRpt2+Eos (right). Figure 6 was prepared using UCSF ChimeraX. (J) Model of therapeutic potential to use the ATPase (orange)-interacting PSMD5 (green) C-terminus to develop inhibitors (exemplified in pink) of 26S/30S proteasomes by preventing their assembly.

References

    1. Chen X., Htet Z.M., Lopez-Alfonzo E., Martin A., and Walters K.J. (2021). Proteasome interaction with ubiquitinated substrates: from mechanisms to therapies. FEBS J 288, 5231–5251. 10.1111/febs.15638. - DOI - PMC - PubMed
    1. Dikic I., and Schulman B.A. (2023). An expanded lexicon for the ubiquitin code. Nat Rev Mol Cell Biol 24, 273–287. 10.1038/s41580-022-00543-1. - DOI - PMC - PubMed
    1. Komander D., and Rape M. (2012). The Ubiquitin Code. Annual Review of Biochemistry 81, 203–229. 10.1146/annurev-biochem-060310-170328. - DOI - PubMed
    1. Buel G.R., Lu X., and Walters K.J. (2022). Exploiting the Proteasome for Disease Treatment. In Protein Homeostasis in Drug Discovery, pp. 135–177. 10.1002/9781119774198.ch4. - DOI
    1. Sakata E., Eisele M.R., and Baumeister W. (2021). Molecular and cellular dynamics of the 26S proteasome. Biochim Biophys Acta Proteins Proteom 1869, 140583. 10.1016/j.bbapap.2020.140583. - DOI - PubMed

Publication types

LinkOut - more resources