[Preprint]. 2025 Aug 1:2025.07.29.667400.
doi: 10.1101/2025.07.29.667400.

CD45 sequestration lowers the signaling threshold in lymphocytes and enhances anti-tumor immunity

Affiliations

CD45 sequestration lowers the signaling threshold in lymphocytes and enhances anti-tumor immunity

Lauren Duhamel et al. bioRxiv. .

Abstract

CD45 plays a central role in immune signal regulation by controlling the spatial dynamics of phosphatase activity through steric segregation of its bulky rigid extracellular domain. To modulate CD45 activity, here we develop and characterize protein engineering approaches to induce multivalent clustering of CD45, effectively mimicking the endogenous local receptor sequestration during immune synapse formation. In doing so, we engineer a biologic that enables precise, tunable control over CD45 surface localization and activity. CD45 sequestration exhibited striking synergy when administered in combination with intratumorally anchored IL-12 therapy, markedly delaying tumor progression and extending survival in syngeneic murine melanoma and carcinoma models. Immune profiling revealed that CD8+ T cells are essential mediators of this synergistic antitumor response. Mechanistically, IL-12 initiates a wave of antigen generation and T cell priming, while CD45 sequestration subsequently enhances tumor-specific CD8+ T cell activation, expansion, and functional states within the tumor-draining lymph node. These findings suggest that CD45 sequestration lowers the activation threshold of T cells, broadens the tumor-reactive T cell repertoire, and therefore promotes more robust tumor-specific T cell responses. Altogether, we establish CD45 as a promising novel target for cancer immunotherapy, capable of potentiating strong anticancer immune responses.


Conflict of interest statement

Competing Interests The authors declare no competing interests.

Figures

Figure 1.
Figure 1.. Engineered multivalent binding constructs can cluster CD45 into discrete punctae.
a. Graphical representation of CD45 exclusion driving signal transduction at local membrane sites of ligand-receptor engagement. b. Graphical representation of multivalent construct induced CD45 clustering. c. Schematic of αCD45 and XL constructs with respective nanobody or peptide tag fusions. d. Equilibrium binding curves normalized to Bmax of aCD45 on murine splenocytes (n=3 ± s.d.). Binding was measured by AF647 MFI and normalized to the Bmax values. e. Equilibrium binding curves normalized to Bmax for individual peptide tags or XL construct on murine splenocytes pulsed with aCD45 for 30 min. (n=3 ± s.d.). Equilibrium dissociation constants (KD) in d-e were calculated using a nonlinear regression fit for one-site total binding with no nonspecificity. f. Confocal Z-stack projections of RAW264.7 CD45-mGreenLantern pulsed with 100 nM αCD45 for 30 min and treated with titrations of XL. CD45 is shown in green and nuclei in blue. g. FRET efficiency calculated using the FRET acceptor photobleaching method on a Leica SP8 confocal with a 63x oil objective (mean ± SD; n = 5). p values were determined by one-way ANOVA followed by Tukey’s multiple-comparison test. h. FRET MFI on murine splenocytes, measured in the PE-Cy5 channel (561 nM excitation laser, 670/30 nM emission filter) via flow cytometry (mean ± SD; n = 3). i. Select representative histograms of FRET signal.
Figure 2.
Figure 2.. CD45 sequestration lowers the TCR signaling threshold and activates T cells.
a-d. Primary CD8+ T cells were pulsed with αCD45 and treated with titrations of XL. Cells stained for flow cytometry analysis of phosphorylation motifs on Lck Y394 (a), Lck Y505 (b), CD3z Y142 (c), and total phosphotyrosine (d) (mean ± SD; n = 3). e. Experimental setup for OT-I T cell activation assay in f-h and representative CD69 and CD25 gating. f. Percent CD69 and CD25+ OT-I T cells. OT-I splenocytes were pulsed with 100 nM αCD45, washed twice and treated with titrations of XL (mean ± SD; n = 3). g. Percent CD69+ OT-I T cells. OT-I splenocytes were pulsed with 100 nM αCD45, diluted by indicated percentages of single domain αCD45 VHH, washed twice and treated with 100 nM of XL (mean ± SD; n = 3). e. Percent CD69+ OT-I T cells. OT-I splenocytes were treated with titrations of G4 peptide, in the presence or absence of αCD45 + XL. Cells were pulsed with 100 nM αCD45, washed twice and treated with 100 nM of XL (mean ± SD; n = 3).
Figure 3.
Figure 3.. CD45 sequestration synergizes with intratumorally anchored IL-12 therapy.
a. Mice (n =10/group) bearing B16F10 tumors treated with 5 ug ABP tagged IL-12 and 100 μg of alum, 40 μg of aCD45 and 60 μg of XL as shown. b. (left) B16F10 tumor growth curves and (right) Kaplan Meier survival. c. Percent weight change measured from the start of treatment on day 6 (n = 5/group). d. Mice (n =5/group) bearing MC38 tumors treated with 5 ug ABP tagged IL-12 and 100 μg of alum, 40 μg of aCD45 and 60 μg of XL as shown. e. (left) MC38 tumor growth curves and (right) Kaplan Meier survival. f. Treatment regimen shown in a, administered with either αCD45, XL, or both agents. g-h. Treatment regimen shown in a, in combination with depleting antibodies or performed in Batf3 knockout mice.
Figure 4.
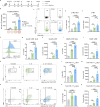
Figure 4.. CD45 sequestration combination therapy promotes a tumor-reactive T cell response in the tdLN.
a. C57BL/6 mice (n=5) were inoculated with 1×10⁶ B16F10 cells and treated as shown. Tissues were harvested for flow cytometry or ELISPOT analysis 48 hours after the completion of treatment. b. Number of spot-forming units (SFU) per 106 splenocytes (mean ± s.d., n=5/group) in an IFN-γ ELISPOT assay, and representative images of ELISPOT wells. c. Representative contour plots and gating for p15E tetramer-reactive cells in the tdLNs, previously gated on live CD8+CD44+ cells. Treatment effects on the d. proportion and e. count of p15E+ tumor-reactive cells in tdLNs. f. Representative histogram of granzyme B (GzmB) expression in p15E+CD8+ T cells. Treatment effects on the g. proportion and h. count of GzmB+ p15E+ tumor-reactive cells in tdLNs. Treatment effects on the i. proportion and j. count of CD25+ p15E+ tumor-reactive cells in tdLNs. k. Representative stem-like T cell (Tcf1+PD-1+) gating. tdLN proportion (l) and count (m) of stem-like PD-1+TCF1+ p15E+CD8+ T cells. n. Representative exhausted T cell (PD-1+TIM3+) gating. tdLN o. frequency and p. count of exhausted PD-1+TIM3+ p15E+ T cells. p values were determined by one-way ANOVA followed by Tukey’s multiple-comparison test.
Figure 5.
Figure 5.. CD45 sequestration combination therapy sustains a tumor-specific T cell response and broadens the tumor-reactive clonal repertoire in the tdLN.
Mice bearing B16F10 tumors (n = 4–5/group) were harvested 48 h. after the completion of treatment and sorted for CD8+ T cells specific for the immunodominant p15E retroviral antigen in the tdLN for downstream scRNA-seq. a. UMAP of p15E+ CD8+ T cells in the tdLN, by treatment group. b. UMAP of sequenced T cells, by phenotype. c. Frequency of p15E+ T cell phenotypes recovered from each treatment group. d. Bubble plot of scaled gene expression of marker genes in p15E+ T cell phenotypes. e. Frequency of cellular transcriptional states in the p15E+ tdLN by treatment group. p values were calculated using Fisher’s exact test for significant proportions. f. Stacked bar plots of clonal sizes among tdLNs, of untreated, IL-12 or IL-12 + CD45 XL mice. g. UMAP of p15E+ T cells, colored by clone size. h. Shannon diversity of TCR repertoire in p15E+ tdLN. i. Clonal richness of TCR repertoire in p15E+ tdLN. p values (h-i) were calculated using a two-sided Wilcoxon rank sum test and adjusted Bonferroni correction.

References

    1. Hermiston M. L., Xu Z. & Weiss A. CD45: A critical regulator of signaling thresholds in immune cells. Annu. Rev. Immunol. 21, 107–137 (2003). - PubMed
    1. Davis S. J. & Merwe P. A. van der. The kinetic-segregation model: TCR triggering and beyond. Nat. Immunol. 7, 803–809 (2006). - PubMed
    1. Merwe P. A. van der, Davis S. J., Shaw A. S. & Dustin M. L. Cytoskeletal polarization and redistribution of cell-surface molecules during T cell antigen recognition. Semin. Immunol. 12, 5–21 (2000). - PubMed
    1. Cordoba S. P. et al. The large ectodomains of CD45 and CD148 regulate their segregation from and inhibition of ligated T-cell receptor. Immunobiology 121, 4295–4302 (2013). - PMC - PubMed
    1. Li F. et al. Ligand-induced segregation from large cell-surface phosphatases is a critical step in γδ TCR triggering. Cell Rep. 43, 114761 (2024). - PMC - PubMed

Publication types