[Preprint]. 2025 Jul 29:2025.07.28.667222.
doi: 10.1101/2025.07.28.667222.

HNRNPH1-mediated splicing events regulate EIF4G1 transcript variant composition and the organization of the AURKA 5'UTR

Affiliations

HNRNPH1-mediated splicing events regulate EIF4G1 transcript variant composition and the organization of the AURKA 5'UTR

Tayvia Brownmiller et al. bioRxiv. .

Abstract

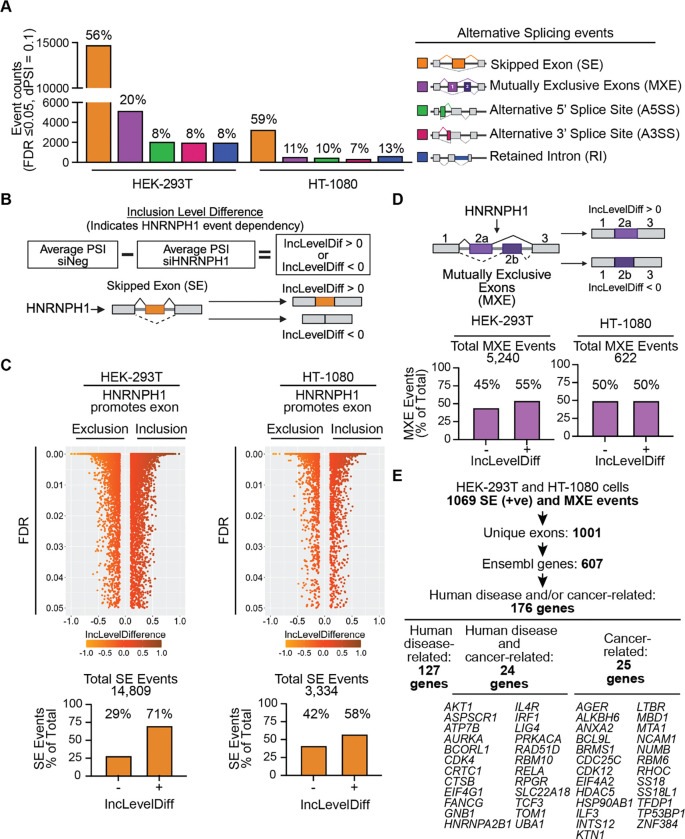
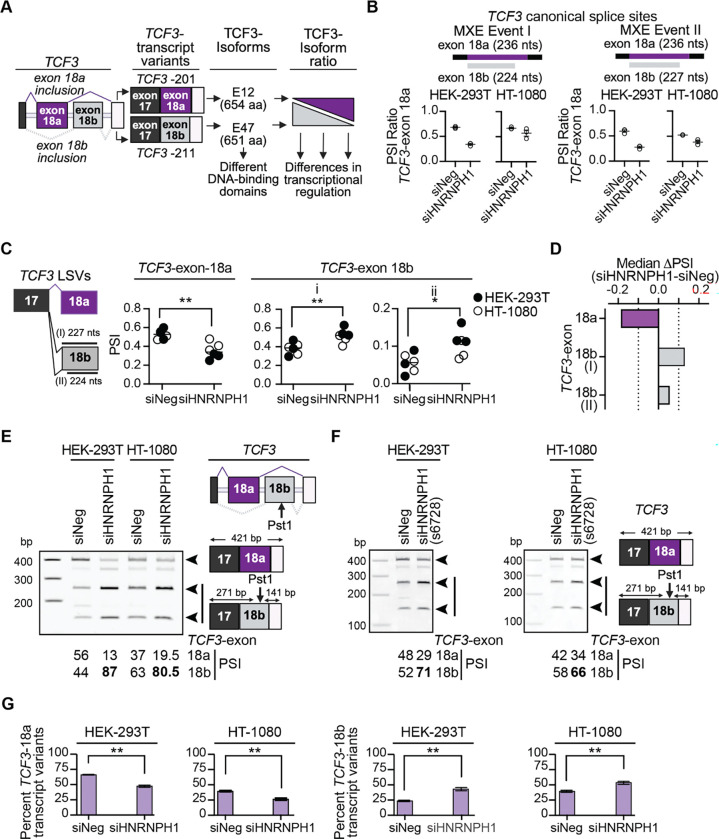
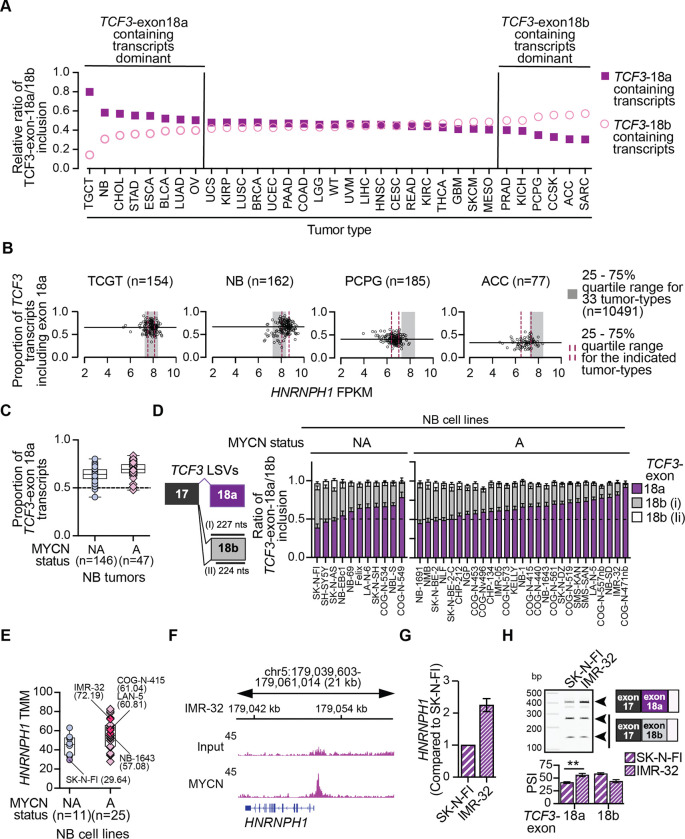
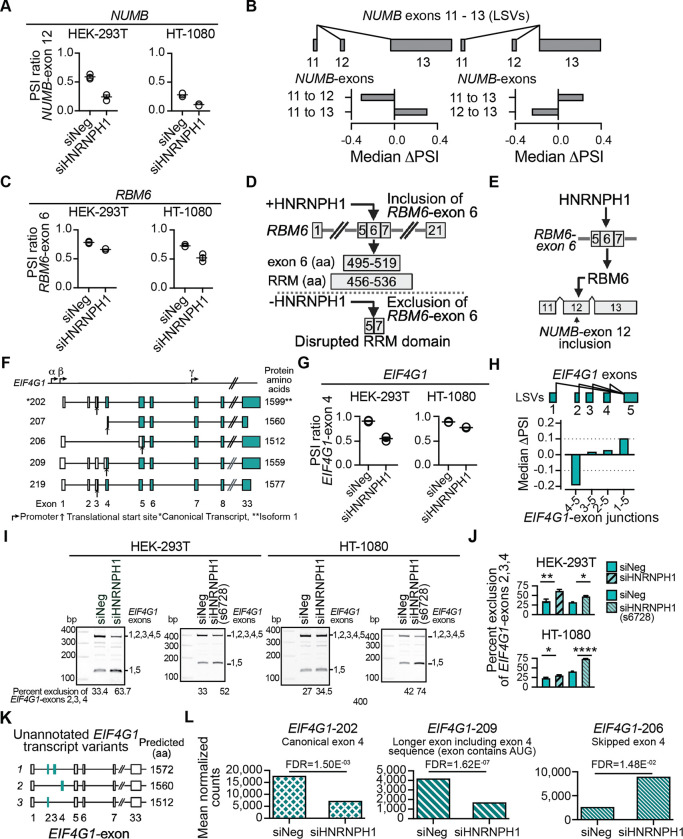
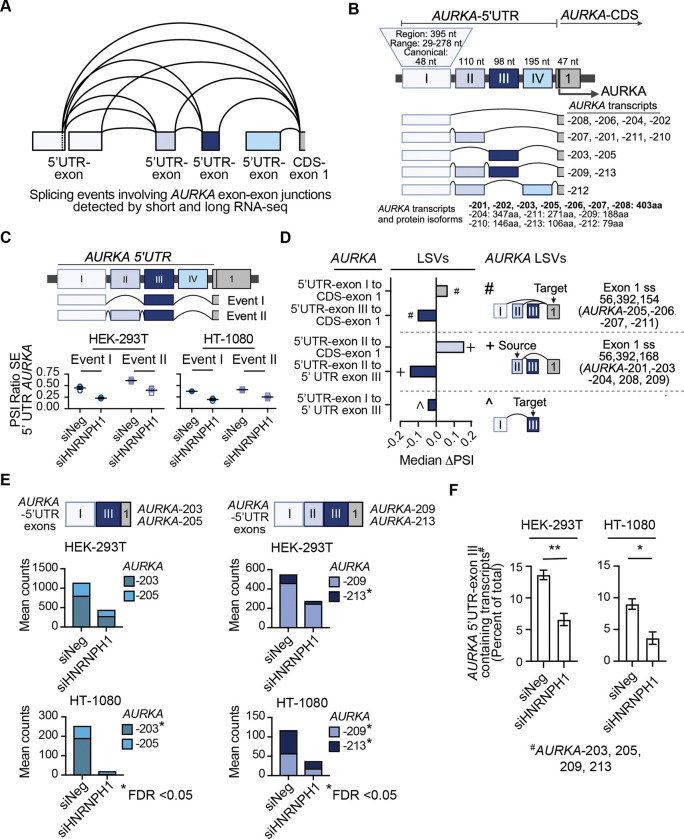
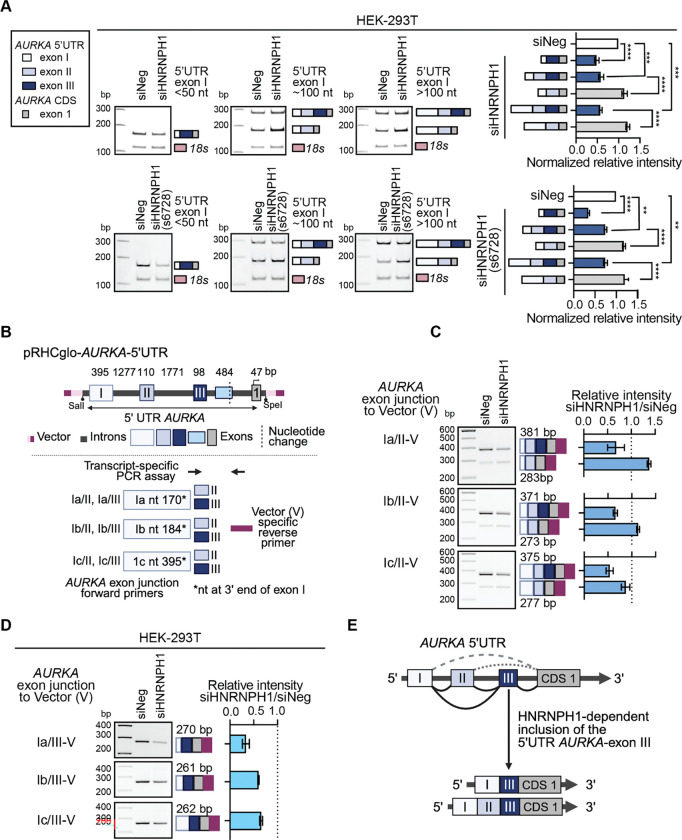
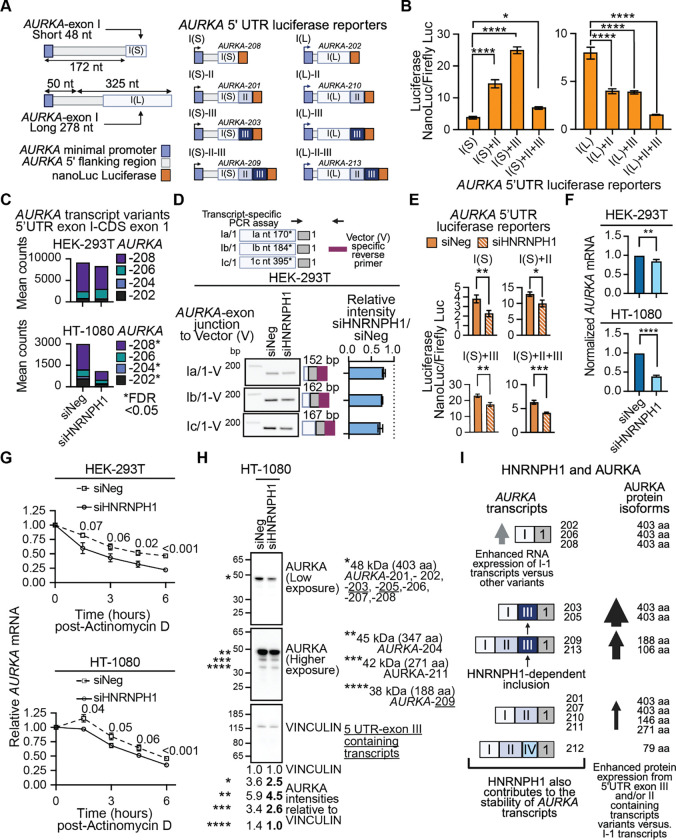
HNRNPH1 is a regulator of alternative splicing, but few studies have defined the splicing events it mediates. Here, we used short- and long-read RNA sequencing to interrogate the transcriptome-wide effects of HNRNPH1 depletion and its regulation of specific splicing events. Differential alternative splicing analysis revealed effects on the transcriptome that involved all splice event categories. We confirmed HNRNPH1's regulation of a splicing event involving TCF3-exons 18a and 18b that encode distinct TCF3 transcription factor isoforms. Extending this finding, we present evidence that in neuroblastoma, HNRNPH1 is a MYCN target, potentially explaining the higher levels of HNRNPH1 and TCF3-exon 18a transcript variants in this tumor type. Analysis of two skipped exon events determined that HNRNPH1 regulates the splicing of exons encoding part of the EIF4G1 translation initiation factor's N-terminus and an exon included in the 5'UTR of specific transcript variants encoding the mitotic kinase AURKA. Using reporter constructs, we show this AURKA 5'UTR exon enhances expression, suggesting HNRNPH1 could contribute to regulating AURKA protein levels. Our findings highlight HNRNPH1's roles in regulating the expression of proteins with diverse cellular functions.


Conflict of interest statement

Conflict of interest statement The authors report no conflicts of interest.

Figures

Figure 1.
Figure 1.. HNRNPH1’s transcriptome-wide regulation of alternative splicing
(A) The significantly affected alternative splice events following the silencing of HNRNPH1 in HEK-293T or HT-1080 cells. (B) A schematic summarizing the analysis of inclusion level difference (IncLevelDiff) used to define HNRNPH1-dependent SE events. (C) Reverse volcano plots of the quantified SE events in each of the indicated cell lines, the total number of significant SE events detected (upper panel) and the percent distribution of IncLevelDiff values per cell line (lower panel). (D) A schematic summarizing the IncLevelDiff used to define HNRNPH1-dependent MXE splicing events (upper panel), the total number of significant MXE events (middle panel), and the percent distribution of IncLevelDiff values per cell line (lower panel). (E) Summary of the workflow used to prioritize genes (Ensembl gene symbol) for further analysis.
Figure 2:
Figure 2:. HNRNPH1’s regulation of a TCF3 mutually exclusive splicing event.
(A) Schematic of the TCF3-exon 18a and TCF3-exon 18b MXE, the canonical transcript variants defined by this MXE event, and their respective protein isoforms. (B) rMATS outputs for the TCF3-exon 18a and -exon 18b MXE splicing events that use canonical splice sites in the indicated cell lines transfected with the indicated siRNAs (three experimental replicas (open circles), mean and SEM (lines). The inclusion of the 224 nt or 227 nt versions of TCF3-exon 18b, respectively, define the MXE Events I and II. (C) Schematic of the relevant TCF3-exon 17, 18a, and 18b local splice variants (LSV; left hand panel) and the values generated using the heterogen (HET) quantifier within MAJIQ (33) (right hand panel). Statistical analysis: unpaired t test with Welch’s correction, P values * <0.05, ** <0.01). (D) Change in the inclusion of TCF3-exon 18a and TCF3-exon 18b (I) 18b-exon length 224 nts, (II) 18b-exon length 227 nts) following silencing of HNRNPH1 quantified using the HET quantifier within MAJIQ. (E) PCR-based splicing assay (24) of the TCF3-exon 18a/18b MXE splicing event in control (siNeg) and HNRNPH1-depleted (siHNRNPH1) HEK-293T and HT-1080 cells. Data shown is representative of three independent experiments. (F) PCR-based splicing assay of the TCF3-exon 18a/18b MXE splicing event in control (siNeg) and HNRNPH1-depleted (siHNRNPH1(s6728)) HEK-293T and HT-1080 cells. Data shown is representative of three independent experiments. (G) Normalized percent subset abundance of TCF3-exon 18a (left) and -exon 18b (right) containing transcript variants expressed in control (siNeg) or HNRNPH1-depleted (siHNRNPH1) HEK-293T and HT-1080 cells based on RSEM counts (unpaired t test with Welch’s correction, P value ** <0.01).
Figure 3:
Figure 3:. The differential expression of TCF3 transcript variants in neuroblastoma
(A) Ranked relative ratios of TCF3-exon 18a and TCF3-exon 18b usage in the indicated tumor types. Data extracted from MAJIQlopedia. See Supplementary Table S1 for the abbreviations used for each tumor type, the number of samples used for the analysis of each tumor type and the data source. (B) HNRNPH1 gene level expression (all transcripts, FPKM) and the proportion of TCF3 transcripts including TCF3-exon-18a for the indicated tumor types. The grey rectangle indicates the 25 – 75% quartile range of HNRNPH1 expression in 10,491 samples representing 33 solid tumor types and the dotted red lines the 25 – 75% quartile range of HNRNPH1 expression in the indicated tumor types. The black horizontal line indicates the median proportion of TCF3 transcripts containing TCF3-exon-18a for the indicated tumor types. (C) The proportion of TCF3 transcripts including exon 18a in NB tumors classified based on the indicated MYCN status. The black lines indicate the median and 25 – 75% quartile range. Data described in (38) and analyzed based on the expression of TCF3 NM_003200 (TCF3-exon 18a) and TCF3 NM_001136139 (TCF3-exon 18a). (D) The inclusion of exon 18a or exon 18b (I) exon length 224 nts; (II) exon length 227 nts) in TCF3 transcripts expressed by the indicated NB cell lines. Data extracted from GSE89413 and analyzed using the PSI quantifier within MAJIQ. (E) The expression of HNRNPH1 mRNA in NB cell lines categorized based on the non-amplification or amplification of MYCN (see (38) for additional details). Indicated are the names and HNRNPH1 TMM values for NB cell lines mentioned in this study. (F) MYCN binding at the HNRNPH1 locus of IMR-32 NB cells (Data extracted from GSE184057 (49). (G) qRT-PCR analysis of HNRNPH1 mRNA expression in the IMR32 NB cell line normalized to that of SK-N-FI cells. (H) PCR-based splicing assay (24) of the TCF3-exon 18a/18b MXE splicing event using RNA prepared from SK-N-FI and IMR-32 NB cells. The image shown is representative of three RNA samples per cell lines and the graph shows the quantification (mean and SEM) of three samples per cell line.
Figure 4:
Figure 4:. HNRNPH1-regulated splicing events affecting NUMB, RBM6, and EIF4G1 transcripts
(A) rMATS outputs for the NUMB-exon 12 SE event in HEK-293T and HT-1080 cells transfected with the indicated siRNAs (three experimental replicas (open circles), mean and SEM (lines). (B) LSVs for NUMB exons 11–13 generated by the VOILA visualization tool and quantified using the HET quantifier within MAJIQ. (C) rMATS outputs for the RBM6-exon 6 SE event in HEK-293T cells transfected with the indicated siRNAs (three experimental replicas (open circles), mean and SEM (lines). (D) Model of HNRNPH1’s regulation of the RBM6-exon 6 SE splicing event. (E) A model of HNRNPH1’s proposed indirect regulation of the inclusion of NUMB-exon 12 via RBM6. (F) Schematic of selected EIF4G1 transcripts focused on exons 1–8. The α, β, and γ indicate alternative transcriptional start sites., and the arrows below each transcript variant the translational start site. The white filled rectangles indicate untranslated regions, and the green filled rectangles, the protein-coding regions. (G) rMATS outputs for the EIF4G1-exon 4 SE event in the indicated cell lines transfected with the indicated siRNAs (three experimental replicas (open circles), mean and SEM (lines). (H) LSVs for the indicated EIF4G1 exon-exon junctions generated by the VOILA visualization tool and quantified using the HET quantifier within MAJIQ. (I) Representative images of a PCR-based splice assay designed to detect the usage of EIF4G1 exons 1 – 5 in HEK-293T or HT-1080 transfected cell lines (siNeg, siHNRNPH1 or siHNRNPH1(s6728)). The black lines specify the amplified products corresponding to the use of the indicated EIF4G1 exons. (J) Quantification of the EIF4G1-amplified product that excludes EIF4G1 exons 2,3, and 4) in HEK-293T or HT-1080 transfected cell lines siNeg, siHNRNPH1, or siHNRNPH1(s6728)) determined using the EIF4G1-PCR-based splice assay (three independent transfections per condition per cell line, unpaired t test with Welch’s correction, P value * <0.05 ** <0.01, **** <0.0001. (K) Schematics of previously unreported full length EIF4G1 transcripts focused on exons 1–10 based on long-read RNA-seq results from HEK-293T and HT-1080 cells and the predicted size of proteins encoded by these transcripts. (L) The mean normalized counts (EBSeq) of the indicated EIF4G1 transcript variants in control (siNeg) and HNRNPH1-depleted (siHNRNPH1) HEK-293T.
Figure 5:
Figure 5:. HNRNPH1’s regulation of an AURKA 5’UTR alternative splicing event
(A) The summary of the exon-exon junctions within the AURKA 5’UTR detected using an integrated analysis of short and long-read RNA-seq. Data assessed using the VOILA visualization tool and quantified using the HET quantifier within MAJIQ. (B) Schematic model of the AURKA 5’ UTR. To distinguish exons corresponding to the regulatory and protein encoding regions of AURKA transcripts, we have annotated the AURKA 5’ UTR exons using Roman numerals (I-IV). (C) The rMATS quantification (PSI ratios) of the events presented in the accompanying schema of AURKA transcript variants containing exon III in control (siNeg) and HNRNPH1-depleted (siHNRNPH1) in HEK-293T (left) and HT-1080 (right) cells. (D) Analysis of AURKA-5’UTR-exon-exon junction usage following the depletion of HNRNPH1 (HET quantifier within MAJIQ). (E) Quantification of the indicated AURKA transcript variants that exclude AURKA-5’UTR-exon III in control (siNeg) and HNRNPH1-depleted (siHNRNPH1) in HEK-293T and HT-1080 cells (EBSeq). (F) The percentage of AURKA 5’UTR-exon III containing transcript variants in control (siNeg) and HNRNPH1-depleted (siHNRNPH1) cells in the indicated cell lines (students t test, P values * <0.05, ** <0.01).
Figure 6:
Figure 6:. HNRNPH1’s regulation of an AURKA 5’UTR skipped exon (SE) event.
(A) qPCR-based analysis of AURKA transcript variants that include AURKA-5’UTR-exon III in transfected HEK-293T cells (siNeg and siHNRNPH1: upper panels; siNeg and siHNRNPH1(s6278): lower panels), and quantification of the amplified products normalized to the intensity of the 18S amplified product (mean±SEM of three biological replicates). Statistical analysis: ordinary one-way ANOVA, P values *** <0.001, **** <0.0001. (B) Schematic of an AURKA minigene encompassing the 5’UTR-exons and CDS exon 1 and adjacent intronic sequences, and the amplification of minigene-derived transcripts. (C) Representative images of minigene-derived transcripts amplified using a vector reverse primer and the indicated forward primers specific for the junctions between different lengths of AURKA 5’UTR-exon I (a, b, and c) and exon II. The adjacent quantification shows the results of applying this assay to analyze three independent co-transfections. D) Representative images of minigene-derived transcripts amplified using a vector reverse primer and the indicated forward primers specific for the junctions between different lengths of AURKA 5’UTR-exon I (a, b, and c) and exon III. The adjacent quantification shows the results of applying this assay to analyze three independent co-transfections. (E) A model of HNRNPH1’s proposed regulation of the inclusion of AURKA 5’UTR-exon III.
Figure 7:
Figure 7:. HNRNPH1 regulates the stability of AURKA transcripts.
(A) Schematics of luciferase reporter constructs consisting of a minimal promoter, the indicated AURKA 5’UTR sequences, and the NanoLuc luciferase. (B) Relative luciferase expression (NanoLuc/Firefly) 48 hours post-transfection of HEK-293T cells with the indicated reporter construct (mean±SEM n=12 per condition). Statistical analysis: ordinary one-way ANOVA, P values *<0.05, ****<0.0001. (C) Quantification of the indicated AURKA transcript variants expressed in control (siNeg) and HNRNPH1-depleted (siHNRNPH1) in HEK-293T and HT-1080 cells (EBSeq). (D) Representative images of a PCR-based amplification of minigene-derived transcripts expressed in control and HEK-293T-HNRNPH1-depleted cells amplified using a vector reverse primer and the indicated forward primers specific for the junctions between different lengths of AURKA 5’UTR-exon I (a, b, and c) and CDS exon 1. The adjacent quantification shows the results of applying this assay to analyze three independent co-transfections. (E) Relative luciferase expression (NanoLuc/Firefly) 48 hours post-transfection of HEK-293T cells with the indicated reporter construct and the indicated siRNA (mean±SEM n=12 per condition). Statistical analysis: unpaired t test with Welch’s correction, P values * <0.05, ** <0.01, *** <0.001. (F) qRT-PCR analysis of AURKA expression following the silencing of HNRNPH1; unpaired t test with Welch’s correction, P **** <0.001 (see Supplementary Figure S6C for quantification of HNRNPH1 expression). (G) qRT-PCR assessment of AURKA mRNA at the times indicated post-treatment of siNeg- or siHNRNPH1-transfected HEK-293T and HT-1080 cells with Actinomycin D. P values indicate the statistical difference between the relative levels of AURKA at each time point post-addition of Actinomycin D calculated using multiple unpaired t tests. (H) The immunoblot analysis of whole cell lysates prepared from siNeg or siHNRNPH1-transfected HT-1080 cells probed using antibodies against the indicated protein. The image shown is representative of three independent transfections per siRNA (see Supplementary Figure S6D). The asterisks indicate the detected AURKA protein isoforms, and the values indicate the VINCULIN normalized quantification of each isoform. See Supplementary Figure S6D for the analysis of HNRNPH expression. (I) A proposed model for the HNRNPH1-dependent alternative splicing of an AURKA 5’UTR exon and the stability of AURKA transcripts.

Similar articles

References

    1. Wilkinson M.E., Charenton C. and Nagai K. (2020) RNA Splicing by the Spliceosome. Annual Review of Biochemistry, Vol 89, 89, 359–388. - PubMed
    1. Kastner B., Will C.L., Stark H. and Luhrmann R. (2019) Structural Insights into Nuclear pre-mRNA Splicing in Higher Eukaryotes. Cold Spring Harb Perspect Biol, 11. - PMC - PubMed
    1. Wang E.T., Sandberg R., Luo S., Khrebtukova I., Zhang L., Mayr C., Kingsmore S.F., Schroth G.P. and Burge C.B. (2008) Alternative isoform regulation in human tissue transcriptomes. Nature, 456, 470–476. - PMC - PubMed
    1. Lee Y. and Rio D.C. (2015) Mechanisms and Regulation of Alternative Pre-mRNA Splicing. Annu Rev Biochem, 84, 291–323. - PMC - PubMed
    1. Pan Q., Shai O., Lee L.J., Frey B.J. and Blencowe B.J. (2008) Deep surveying of alternative splicing complexity in the human transcriptome by high-throughput sequencing. Nat Genet, 40, 1413–1415. - PubMed

Publication types

LinkOut - more resources