[Preprint]. 2025 Jul 28:2025.07.23.666394.
doi: 10.1101/2025.07.23.666394.

Maternal CENP-C restores centromere symmetry in mammalian zygotes to ensure proper chromosome segregation

Affiliations

Maternal CENP-C restores centromere symmetry in mammalian zygotes to ensure proper chromosome segregation

Catherine A Tower et al. bioRxiv. .

Abstract

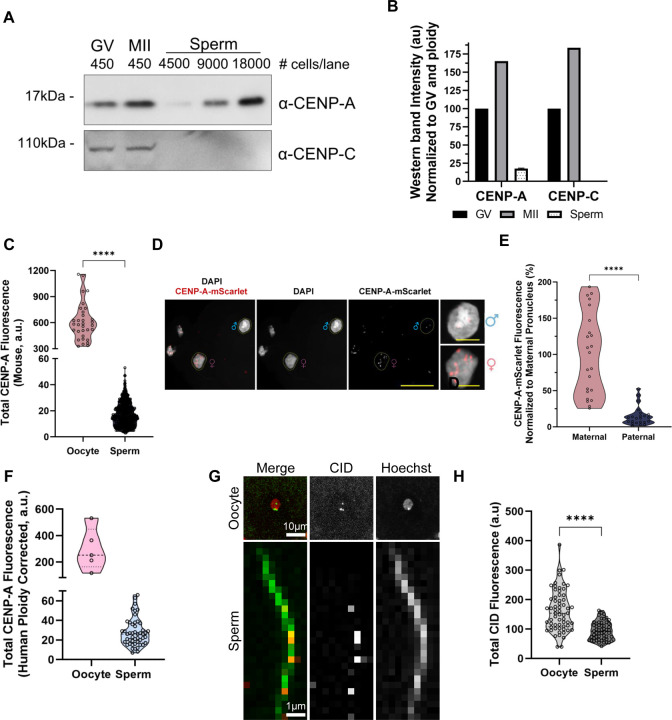
Across metazoan species, the centromere-specific histone variant CENP-A is essential for accurate chromosome segregation, yet its regulation at the parental-to-zygote transition in mammals is poorly understood. To address this, we developed a CENP-A-mScarlet knock-in mouse model, which revealed sex-specific dynamics: mature sperm retains 10% of the CENP-A levels present in MII-oocytes. However, in zygotes prior to the first mitosis, this difference is resolved, using maternally inherited cytoplasmic-CENP-A. Notably, the increase in CENP-A at paternal centromeres is independent of sensing CENP-A asymmetry or the presence of maternal chromosomes. Instead, CENP-A equalization relies on asymmetric recruitment of maternal CENP-C to paternal centromeres. Depletion of maternal CENP-A decreases total CENP-A in pronuclei without disrupting equalization. In contrast, reducing maternal CENP-C or disruption of its dimerization domains impairs CENP-A equalization and chromosome segregation. Therefore, maternal CENP-C acts a key epigenetic regulator that resets centromeric symmetry at fertilization to preserve genome integrity.

Keywords: CENP-A; CENP-C; Centromere; epigenetics; intergenerational; mouse; oocyte; sperm; zygote.


Conflict of interest statement

Competing interests: The authors declare no competing interests.

Figures

Figure 1:
Figure 1:. Loss of CENP-A in male germ cells precedes the histone to protamine exchange.
A) Schematic of the Cenpa-GS-mScarlet-i-V5 transgene. B) Immunoblot of H3, V5, CENP-A, CENP-C, and HJURP in flow sorted spermatogonia (‘gonia), pachytene/diplotene spermatocytes (‘cytes), round spermatids (‘tids), and mature sperm from CenpamScarlet/+ males. Alpha tubulin (TubA) is shown as a loading control. Shown is a representative immunoblot from n = 2 mice. Membrane was stripped and re-blotted for the indicated proteins. C) Schematic overview of germ cell markers across spermatogenesis. GFRα1 marks undifferentiated spermatogonia, SOHLH1 marks differentiating Type A and Intermediate spermatogonia, STRA8 marks differentiating Type B spermatogonia and early preleptotene spermatocytes, and condensed γH2A.X marks mid to late pachytene spermatocytes. D) Immunostaining of CenpamScarlet/+ whole mount tubules in specified germ cell types. Representative images from n = 3 staining experiments on n = 3 mice. Scale bars are 20um. E) Quantification of CENP-A-mScarlet direct fluorescence across germ cell stages, somatic cells of the testes, and intestinal cells. n = 200 germ and intestinal cells were quantified for each cell type, split evenly between n = 2 staining experiments and n = 2 mice. n = 100 Sertoli and Myoid cells were quantified for each cell type. Each dot is the sum of all CENP-A-mScarlet puncta in one cell. Average fluorescence of CENP-A-mScarlet normalized to GFRα cells across the cell types are as follows: intestine = 68%, Sertoli = 56%, Myoid = 43%, GFRα = 100%, Sohlh1 = 19% Stra8 = 24%, γH2A.X = 18%. F) Immunoblots of CENP-B protein levels in flow sorted germ cells and mature sperm from C57Bl/6J testes and epididymides. Representative image from n = 2 replicates from n = 2 mice.
Figure 2:
Figure 2:. CENP-A asymmetry between oocytes and sperm is a conserved feature of gametogenesis across flies, mice, and humans.
A) Immunoblot analysis of CENP-A and CENP-C in GV, MII and increasing sperm concentrations per lane. The membrane was stripped and re-probed with the indicated antibodies. Representative image from n = 2 blots using oocytes from n = 12 females and n = 2 males. B) Quantification of western band intensities from (A). Data is shown normalized to ploidy, cellular input, and GV protein levels. Mean values are as follows: GV CENP-A = 100, MII CENP-A = 165.26, Sperm CENP-A = 17.5, GV CENP-C = 100, MII CENP-C = 183.7, Sperm CENP-C = 0. C) Quantification of total CENP-A immunofluorescence in MII oocytes and mature sperm from C57BL/6J mice. Data shown is from n = 6 females and n = 2 males and are normalized for ploidy. Mean values are as follows: Oocyte = 611 a.u. for n = 32 cells and sperm = 17 a.u. for n = 600 cells. C) Representative image of CENP-A-mScarlet fluorescence inherited from CenpamScarlet/+ males and females. Data shown is from n = 23 zygotes from n = 2 technical replicates. D) Quantification of endogenous CENP-A-mScarlet fluorescence in the maternal and paternal pronuclei of zygotes shown in panel (D). Average CENP-A-mScarlet fluorescence, normalized to the maternal average, is as follows: Maternal = 100%, Paternal = 15%. F) Quantification of total CENP-A immunofluorescence in human oocytes and sperm. Mean a.u. values are as follows: Oocyte = 295 a.u. for n = 5 cells and sperm = 28 a.u. for n = 49 cells. Data are from n = 3 female donors and n = 3 male donors and are normalized for ploidy. G) Representative images of Drosophila oocyte and sperm with endogenous CID-Dendra2 fluorescence (red), co-stained with Hoechst (green). Scale bars: oocyte = 10um, sperm = 1um. H) Quantification of CID-Dendra2 fluorescence from Drosophila gametes shown in (G). Mean a.u. values, normalized for ploidy, are as follows: Oocytes = 163 a.u. for n = 62 and sperm = 94.2 a.u. for n = 94. ****: p < 0.0001.
Figure 3:
Figure 3:. Maternal- and paternal-derived CENP-A nucleosomes are inherited intergenerationally.
A) Overview of pronuclear staging during the first cell cycle post-fertilization. PN = pronuclear stage. B) Visualization of CENP-A-mScarlet fluorescence in in vitro fertilized embryos, generated using C57Bl/6J females and Cenpa mScarlet/+ males, collected at the indicated pronuclear stages. Representative images from four IVF and immunostaining experiments using four males. Maternal and paternal pronuclei were identified based on relative size and position in relation to the polar body. Scale bars: 20 μm (main) and 10 μm (insets).C) Imaging of endogenous maternal CENP-A-mScarlet fluorescence at the indicated pronuclear stages. Representative images from four IVF and immunostaining experiments using 12 females. Maternal and paternal pronuclei were identified by their relative size and position in relation to the polar body. EdU, visualized using click chemistry, marked zygotes that had entered S phase. Scale bars: 20 μm (main) and 10 μm (insets). D) Quantification of the percentage of zygotes with maternal CENP-A-mScarlet in both pronuclei or only in the maternal pronuclei at each pronuclear stage. E) Quantification of the percentage of zygotes positive or negative for EdU incorporation (indicating DNA replication). F) Quantification of total CENP-A immunofluorescence in the maternal and paternal pronuclei at stage PN5, each dot is the sum of total CENP-A puncta in a single pronucleus. Fluorescence values were normalized to the mean for the maternal pronucleus. Mean total CENP-A fluorescence in the maternal pronucleus = 100% (n = 25 embryos). Mean total CENP-A fluorescence in the paternal pronucleus = 83% (n = 25 embryos). p < 0.05. G) Comparison of direct fluorescence intensity of maternally vs. paternally derived CENP-A-mScarlet in male and female pronuclei at 8 hours post-fertilization. Only zygotes with maternal CENP-A-mScarlet present in both pronuclei were included. Each dot represents the total CENP-A-mScarlet puncta in a single pronucleus. Values were averaged to the mean fluorescence quantified for maternally inherited mScarlet in the maternal pronucleus. Mean for maternal CENP-A-mScarlet in the maternal pronucleus = 100% from n = 119 embryos. Mean for maternal CENP-A-mScarlet in the paternal pronucleus = 37% from n = 103 embryos. Mean for paternal CENP-A-mScarlet in the paternal pronucleus = 8% from n = 35 embryos. *: p < 0.05, ****: p < 0.0001.
Figure 4:
Figure 4:. CENP-A incorporation in the paternal pronucleus is autonomously regulated.
A) Schematic of androgenetic (diploid zygotes with only paternal DNA) embryo generation. B) Quantification of total CENP-A immunofluorescence in either control or androgenetic zygotes collected 16 hours after ICSI. Embryos were collected and stained from n = 2 independent ICSI experiments. Each dot is the sum of the total puncta in one pronucleus. For androgenetic embryos in which the genomes fused into one pronucleus, the total fluorescence was halved to estimate the total per genome. Values were normalized to the mean for the control maternal pronucleus. Mean fluorescence intensities are as follows: WT ICSI Maternal = 100% from n = 24 pronuclei, WT ICSI Paternal = 83% from n = 24 pronuclei, and WT Androgenetic = 76% from n = 38. ns is not significant.
Figure 5:
Figure 5:. CENP-C and MIS18BP1 are asymmetrically recruited to paternal centromere in zygotes.
A) Representative immunofluorescence images of PN0–2 stage zygotes co-stained for CENP-C and maternal CENP-A-mScarlet (top) or total CENP-A and CENP-B-eGFP (bottom). CENP-B-eGFP was expressed by RNA injection due to the lack of a suitable antibody. Images are representative of two IVF experiments using six CenpamScarlet/+ or three CF-1 females and one (C57Bl/6J × DBA2)F1 male. Scale bars: 20 µm. B) Quantification of CENP-C immunofluorescence or CENP-B-eGFP fluorescence shown in panel (A), grouped by pronuclei. Each dot is the sum of the total puncta in one pronucleus. Values were normalized to the mean for the maternal pronucleus. Mean fluorescence intensities are as follows: Maternal CENP-C = 100% from n = 34 pronuclei, Paternal CENP-C = 138% from n = 34 pronuclei, Maternal CENP-B = 100% from n = 8 pronuclei, Paternal CENP-B = 73% from n = 8 pronuclei. C) Paternal/maternal ratios of total CENP-C fluorescence in early (PN0–2, n = 44) and late (PN3–5, n = 90) zygotes. Each dot represents one zygote. The red dashed line represents a paternal/maternal ratio of 1. D) Representative images of MIS18BP1 localization across pronuclear stages, from three IVF experiments using seven females. Scale bars: 20 µm. E) Quantification of MIS18BP1 fluorescence in early (PN 1–3) and late (PN 4–5) zygotes from panel (D). Fluorescence was measured from a central z-slices and normalized to pronuclear area. Shown are paternal/maternal ratios; each dot = one zygote (nearly = 10, nlate = 10). Red dashed line = ratio of 1. p < 0.05; ns = not significant.
Figure 6:
Figure 6:. CENP-A equalization in zygotes relies on maternal CENP-C and disruption to its dimerization domain impairs and compromises chromosome segregation fidelity.
A) RT-qPCR analysis confirms efficient CENP-C knockdown in meiotic oocytes. Cenpc transcript levels were quantified from uninjected controls, negative control siRNA (20–40 nM), and Cenpc siRNA (20–40 nM) groups. Each sample comprised ~20 oocytes per n = 2 biological replicates with n = 3 technical replicates. B) Quantification of total CENP-C immunofluorescence in early (PN0–2) zygotes, shown as paternal/maternal fluorescence ratios. The red dashed line denotes a ratio of 1. Data are from n = 3 biological replicates (3 CF-1 females and 1 (C57Bl/6J × DBA2)F1 male per replicate). C) Representative images of CENP-A immunofluorescence in PN4/5 zygotes generate from GV oocytes injected with Cenpc, control siRNA pools, or uninjected controls. Data are from n = 6 IVF experiments using n = 3–4 CF-1 females and n = 1 (C57Bl/6J X DBA2)F1 male for each experiment. Zygotes with paternal/maternal total CENP-A ratios above 5 were excluded from further analysis. D) Quantification of CENP-A fluorescence in zygotes from (C), plotted as paternal/maternal ratios. Each dot represents one zygote. Data: uninjected (n = 54), negative control (n = 23), and siRNA-treated (n = 35) zygotes from n = 4 biological replicates. E-F) Scatterplots of CENP-A fluorescence in maternal (x-axis) vs. paternal (y-axis) pronuclei from (D) for uninjected (E) and Cenpc siRNA-treated (F) zygotes. Linear regressions were performed with y-intercepts fixed at 0. Each dot = 1 zygote. G) Representative DAPI images of 2-cell embryos from conditions in (C), cultured for 24 hours post-fertilization (hpf). H) The proportion of embryos from (G) collected at each stage shown in the legend 24hpf. “Stalled” indicates zygotes that failed to form a proper paternal pronucleus. Percentages were calculated by combining all embryos generated across all replicates. Data is representative of n = 227 not injected embryos, n = 43 neg ctrl embryos, and n = 76 siRNA embryos, from at least n = 3 replicates using n = 5 CF-1 females and n = 1 (C57Bl/6J X DBA2)F1 male each. I) The percentage of 2-cell embryos with at least one chromosome segregation defects from (G). Percentages were calculated by combining all embryos generated across all replicates. The number of 2-cell embryos are as follows: Not Injected = 191, neg ctrl = 33, siRNA = 62. J) CENP-A levels are restored in Cenpc siRNA-injected zygotes when co-injected with an siRNA resistant CenpcWT RNA but not a CENPC dimerization-deficient RNA (CenpcDimer ). Paternal/maternal CENP-A ratios are shown for each group: uninjected (n = 29), siRNA (n = 37), CenpcWT (n = 14), and CenpcDimer (n = 23). Data from n = 3 replicates using 5 CF-1 females and 1 (C57Bl/6J × DBA2)F1 male per replicate. The red dashed line indicates a ratio of 1. *p < 0.05, **p < 0.01, ***p < 0.001; ns = not significant.
Figure 7:
Figure 7:. CENP-C compensates for acute CENP-A loss to preserve faithful chromosome segregation.
A) RT-qPCR quantification of Cenpa transcripts in uninjected oocytes, negative control siRNA-injected (100–150 nM), and Cenpa siRNA-injected oocytes (100–150 nM). Data represent n = 6 biological replicates, each with RNA from 10–20 oocytes, analyzed across three technical replicates. B) Representative images of CENP-A immunofluorescence in PN3–PN5 zygotes from control and Cenpa siRNA-injected oocytes. Scale bars: 20 µm. Images are from n = 5 IVF experiments using 4–5 CF-1 females and one (C57Bl/6J × DBA2)F1 male per experiment. C) Quantification of total CENP-A immunofluorescence in either maternal or paternal pronuclei from (B). Fluorescence measurements are normalized to the mean total maternal fluorescence in uninjected control oocytes. Shown are the average paternal-to-maternal ratios for each sample. Mean normalized fluorescence intensities are as follows: uninjected maternal = 100% for n = 41 zygotes, uninjected paternal = 91% for n = 41 zygotes, negative control maternal = 66% for n = 21 zygotes, negative control paternal = 60% for n = 21 zygotes, siRNA maternal = 42% for n = 26 zygotes, and siRNA paternal = 35% for n = 26 zygotes. D) Quantification of total CENP-C in PN2/3 zygotes from Cenpa siRNA-treated zygotes generated as described for (C) from n = 3 IVFs. Mean normalized fluorescence intensities are as follows: Not injected maternal = 100% for n = 54 zygotes, Not injected paternal = 98% for n = 54 zygotes, negative control maternal = 101% for n = 23 zygotes, negative control paternal = 104% for n = 23 zygotes, siRNA maternal = 138% for n = 20 zygotes, and siRNA paternal = 145% for n = 20 zygotes. E) The proportion of Cenpa siRNA-treated embryos or embryos derived from Cenpa+/− females (“Cenpa+/−”) collected at each stage shown in the legend. Embryos were allowed to develop for 24hrs. Not injected, neg ctrl, and siRNA groups were generated as described for (B-D). “Stalled” indicates zygotes that failed to form a proper paternal pronucleus. Percentages were calculated by combining all embryos generated across all replicates. Data is representative of n = 227 not injected embryos, n = 81 neg ctrl embryos, and n = 85 siRNA embryos, from at least n = 3 replicates using n = 5 CF-1 females and n = 1 (C57Bl/6J X DBA2)F1 male each. Data also includes n = 56 WT and n = 56 Cenpa+/− from n = 2 replicates cumulatively using n = 2–4 females of each genotype and n = 2 (C57Bl/6J X DBA2)F1 males. Not injected embryos are the same as in Fig. 6H. F) The percentage of 2-cell embryos with at least one chromosome segregation defects from (E). Percentages were calculated by combining all embryos generated across all replicates. The number of 2-cell embryos are as follows: Not Injected = 191, neg ctrl = 61, siRNA = 75, WT = 55, and Cenpa+/− = 56. G) The model for centromere remodeling and its impact on 2-cell embryo outcomes. Briefly, maternal and paternal centromeres in zygotes have very different CENP-A levels, but equalization is achieved prior to the first mitosis using maternal cytoplasmic pools of CENP-A, CENP-C, and MIS18BP1. In control zygotes (a), paternal genomes preferentially accumulate both CENP-C and MIS18BP1, which allows zygotes to resolve this inherited CENP-A asymmetry, allowing for a normal first mitosis. Zygotes with impaired CENP-A deposition but intact equalization (b) can compensate for weakened centromeres by recruiting additional CENP-C to stabilize them, allowing for normal mitosis. However, zygotes with reduced CENP-C levels have lower centromeric CENP-C and impaired CENP-A equalization, both of which contribute to increased chromosome mis-segregation during the first embryonic division. *: p < 0.05, **: p < 0.01, ***: p < 0.001, ****: p < 0.0001. ns indicates not significant.

Similar articles

References

    1. Abe K., Funaya S., Tsukioka D., Kawamura M., Suzuki Y., Suzuki M.G., Schultz R.M., and Aoki F. (2018). Minor zygotic gene activation is essential for mouse preimplantation development. Proc. Natl. Acad. Sci. 115, 201804309. - PMC - PubMed
    1. Adenot P.G., Mercier Y., Renard J.P., and Thompson E.M. (1997). Differential H4 acetylation of paternal and maternal chromatin precedes DNA replication and differential transcriptional activity in pronuclei of 1-cell mouse embryos. Development 124, 4615–4625. - PubMed
    1. Amor D.J., Bentley K., Ryan J., Perry J., Wong L., Slater H., and Choo K.H.A. (2004). Human centromere repositioning “in progress.” Proc. Natl. Acad. Sci. U. S. A. 101, 6542–6547. - PMC - PubMed
    1. Ballow D., Meistrich M.L., Matzuk M., and Rajkovic A. (2006). Sohlh1 is essential for spermatogonial differentiation. Dev. Biol. 294, 161–167. - PubMed
    1. Bao J., and Bedford M.T. (2016). Epigenetic regulation of the histone-to-protamine transition during spermiogenesis. Reproduction 151, R55–R70. - PMC - PubMed

Publication types

LinkOut - more resources