[Preprint]. 2025 Aug 1:2025.07.31.667772.
doi: 10.1101/2025.07.31.667772.

Cat brains age like humans: Translating Time shows pet cats live to be natural models for human aging

Affiliations

Cat brains age like humans: Translating Time shows pet cats live to be natural models for human aging

Capucine Januel et al. bioRxiv. .

Abstract

Translating biological time across species is a powerful tool to identify new models of human aging and disease. Currently, it is not clear whether any animal reaches an age comparable to a human in their 80s. Most species seem to age differently compared with humans. Some preliminary observations suggest that cats may share common patterns of aging with humans. Cats could serve as a promising model for human aging. Here, we find corresponding ages between cats, humans and other species to test whether cats can live to the equivalent of a human in their 80s. We analyzed 3,754 observations across species from sudden and gradual changes in anatomy, physiology, and behavior. Some of these data are from clinical records, whereas others are from brain scans using high-resolution MRI (7T and 3T). We studied pet cats, research colony cats, and wildcats living in zoos to encapsulate species variation in the speed of development and aging. We found that cat and human brains atrophy with age, and that their age-related patterns in brain aging are sufficiently similar that we could use them to generate cross-species age alignments. We also found that human postnatal development is stretched compared with cats and mice. Interestingly, some pet cats that visit clinics are much older than those in colonies. Therefore, cats, and especially pet cats, are natural model systems of human aging. Our findings call for increased integration across veterinary and human medicine to understand aging.


Figures
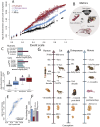
Figure 1.
Figure 1.
We used a linear model with a spline to translate ages across species. (A) Time points expressed in years post-conception are plotted against the event scale. The smooth spline allows for variation in the pace of development and aging. (B) We used a range of metrics to align ages. Those include age-related changes in brain structure, blood work, the timetable of bone ossification, and behavioral milestones such as eye opening. (C) Cats, like humans, have a prolonged duration of maximum lifespan compared with closely related species. (D) Age ranges of observations span much of the known lifespan of humans and other species. (E) We imputed observations when not available in some species with an example shown for cats and humans. (F) Percentage of missing data are shown for each species. (G) We provide some examples of age alignments generated from the model. Abbreviations: PM: postnatal month; P: postnatal day.
Figure 2.
Figure 2.
(A) Example age matches between humans and cats. A newborn cat equates to a human at 40 weeks post-conception, and a 6-month-old cat equates to a human within their first decade, and a cat in their teens maps onto a human in their 80s. (B-F) Scatterplots of two species comparisons demonstrate that there is a complex relationship in the pace of development and aging across species. Dashed lines show examples of corresponding ages between two species.
Figure 3.
Figure 3.
The brain atrophies with age in (A) cats and (B) humans. We fit a smooth spline to multiple metrics (e.g., normalized brain volume) versus age to extract corresponding observations across cats and humans. We, for example, extracted the age of peak brain volume (100%) before the brain begins to decline and the age at which the volume reaches a particular percentage of adult brain volume (e.g., 90, 80% of maximum brain volume). We use these time points to generate cross-species age translations. (C). A 50-year-old human (C) and a 9-year-old cat (C) begins to show modest enlargement of ventricles (red asterisks). At later ages, the ventricles are much enlarged (arrows) as exemplified in an 88-year-old human (D) and a 16-year-old cat (E). (F) Horizontal, coronal and sagittal slices show the extent of the brain atrophy in the same 16-year-old cat. In this cat, we found atrophy of the olfactory bulb and telencephalon in addition to an expansion in lateral and third ventricles (arrows).
Figure 4.
Figure 4.
Sagittal and coronal slices from brain scans from the 7T MRI illustrate some of the brain measurements collected from colony cats. (A) We used sagittal slices to measure the interthalamic area (color-contoured). The interthalamic adhesion area peaks and declines with age in (B) cats and (C) humans. We fit smooth splines to capture ages of peak interthalamic adhesion area before it declines to specific percentages (e.g., 90%, 80%, 70%) of its maximum value (B-C). We used coronal slices to measure the interthalamic adhesion relative to the brain height (D F) measured along the brain’s midline. The interthalamic adhesion ratio declines with age in (E) cats and (F) humans. (G) We also measured the cranial space by quantifying the volume of the brain and cranial box. To do this, we measured the brain and cranial box (color-contoured; G) from coronal slices. The intracranial space represented as subarachnoid volume increases drastically in (H) cats and (I) humans. (J) We quantified gyrification as the ratio between the perimeter contouring gyri and sulci relative to the perimeter contouring the brain. Gyrification increases with age in (K) cats and (L) humans. The cats shown above are 4.45 years old (A), and 8.85 years post-birth (D, G, J).
Figure 5.
Figure 5.
(A) Normalized brain volume declines with age in both colony and pet cats. We fit smooth splines and their confidence intervals to Auburn colony and clinical cats separately and we found extensive overlap between these two feline populations even though we used different MR scanners (B) to collect these brain scans. (B) Coronal slices show example images collected with the 7T MRI scanners (left panels) and the 3T MRI scanners (right panels). The ages of study varied (top left; 0.62 y; bottom left: 8.85 y; top right: 4.66 y; bottom right: 17 y). Colony cats were scanned in a 7T MRI which can generate scans of higher resolution than pets visiting the clinic. Bran metrics, including the normalized interthalamic adhesion thickness (C) and the interthalamic adhesion area (D) are also very similar across the two groups of cats. (E) Pet cats visiting the clinic are significantly older than those being studied in the laboratory. We used the highest resolution MR imaging modality. This meant we used T1 in some cases or T2-weighted images in other cases. Abbreviation: y-years after birth.
Figure 6.
Figure 6.
We fit smooth splines and confidence intervals separately for males and females to assess whether there are sex differences in age-related patterns of brain change. Normalized brain volume in humans (A) and cats (B) decrease with age. There is little variation between males and females. The normalized interthalamic adhesion thickness (C, D) and area (E, F) decline with age. Here, there is extensive overlap in normalized brain volume in males and females. Males appear to show accelerated reductions in interthalamic adhesion area and thickness after 10 years old in cats, and after 50 years old in humans.
Figure 7.
Figure 7.
Comparing time points from blood chemistry profiles show that pet cats take longer to mature than those in the colony. (A) Most of the cats used in this study are domestic shorthairs. (B) Cats from Project CatAge are primarily from southern states, but the dataset includes representations across the USA. (C) ALP varies with age and shows common patterns in cats from the colony, the AU clinic, and Project CatAge. We first fit a smooth spline through these data followed by a non-linear model (see inset) to extract the age of plateau as well as epochs (e.g., 90 percent of plateau) within multiple cat groups, including colony cats from Japan and Auburn (Nakai et al., 1992). (D) Cats from the AU clinic (n=169) and Project CatAge (n=45) are significantly older than the colony cats (n=99). Here, we applied a non-parametric Welch one way test followed by a Games-Howell Test to the age of cats for which ALP was measured. An asterisk denotes the pair-wise tests were significant (p<0.01). (E-G) Comparative analysis in time points extracted from blood work values show that pet cats take longer to mature than colony cats. (E) This is evident when comparing all pets to all colony cats though there is no effect for (G) sex. Pairwise comparisons between pets versus the (E) Japan colony and the (F) AU colony consistently show that pet cats take longer to mature than colony cats.
Figure 8.
Figure 8.
(A) Domestic cats and wildcats mature at similar rates. The fit to the model has a slope close to 1 (y=x). Observations (e.g., age of eye opening) were matched for sex, environment, and statistics (e.g., minimum age of eye opening, maximum of eye opening). (B) These observations capture the pace of behavioral, reproductive, and tooth development. (C) Breeding does not necessarily lead to modifications in the pace of development. A linear model fit to breed, and non-breed cats shows that the linear model is very close to 1. (D) These observations primarily capture behavioral, reproductive and tooth maturation.

Similar articles

References

    1. Berg L, McKeel DW, Miller JP, Storandt M, Rubin EH, Morris JC, Baty J, Coats M, Norton J, Goate AM, Price JL (1998) Clinicopathologic studies in cognitively healthy aging and Alzheimer disease: relation of histologic markers to dementia severity, age, sex, and apolipoprotein E genotype. Archives of neurology. 55:326–35. - PubMed
    1. Chambers JK, Tokuda T, Uchida K, Ishii R, Tatebe H, Takahashi E, Tomiyama T, Une Y, Nakayama H (2015) The domestic cat as a natural animal model of Alzheimer’s disease. Acta Neuropathol Commun 3:78. - PMC - PubMed
    1. Charvet CJ (2021) Cutting across structural and transcriptomic scales translates time across the lifespan in humans and chimpanzees. Proc Biol Sci 288:20202987. - PMC - PubMed
    1. Charvet CJ, Ofori K, Baucum C, Sun J, Modrell MS, Hekmatyar K, Edlow BL, van der Kouwe AJ (2022) Tracing Modification to Cortical Circuits in Human and Nonhuman Primates from High-Resolution Tractography, Transcription, and Temporal Dimensions. J Neurosci. 42:3749–3767. - PMC - PubMed
    1. Charvet CJ, de Sousa AA, Vassilopoulos T (2025) Translating time: challenges, progress, and future directions. Brain Res Bull 221:111212. - PMC - PubMed

Publication types

LinkOut - more resources