[Preprint]. 2025 Jul 29:2025.07.25.666882.
doi: 10.1101/2025.07.25.666882.

Lower-order methylation states underlie the maintenance and re-establishment of Polycomb modifications in Drosophila embryogenesis

Affiliations

Lower-order methylation states underlie the maintenance and re-establishment of Polycomb modifications in Drosophila embryogenesis

Eleanor A Degen et al. bioRxiv. .

Abstract

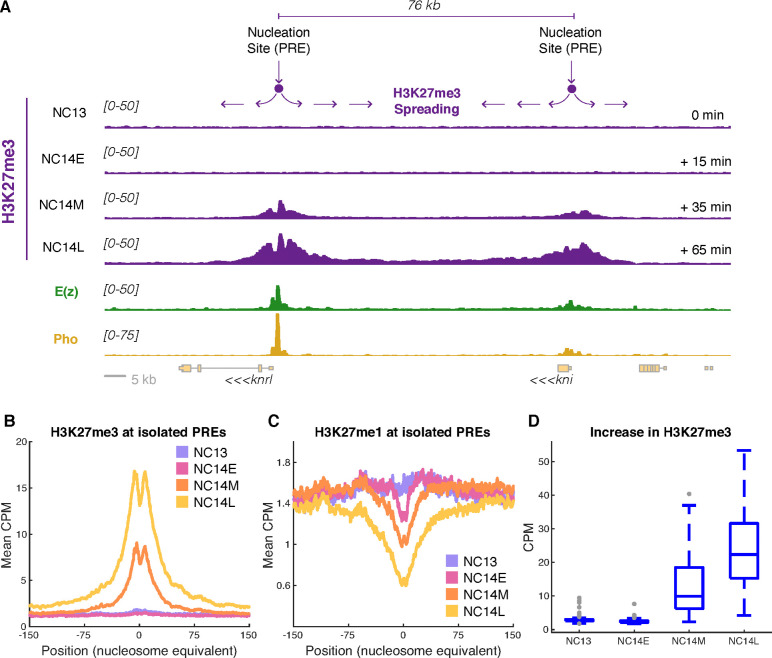
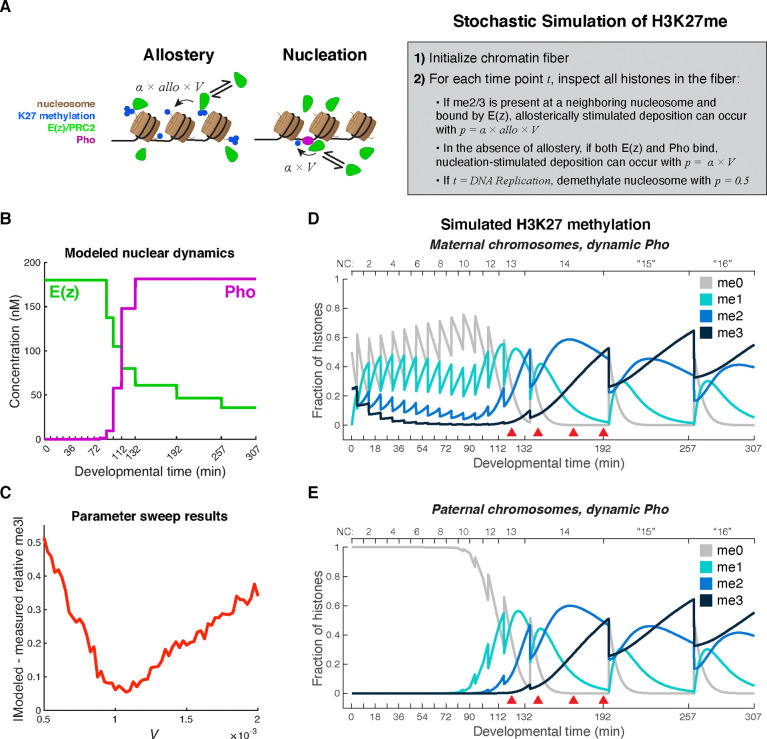
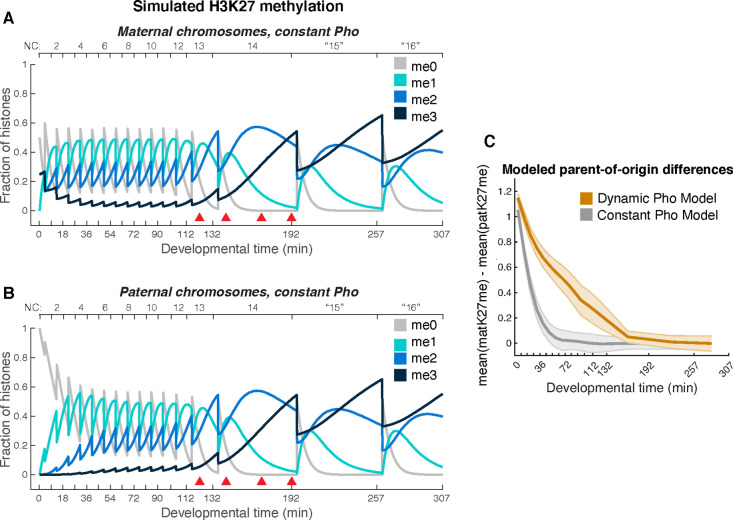
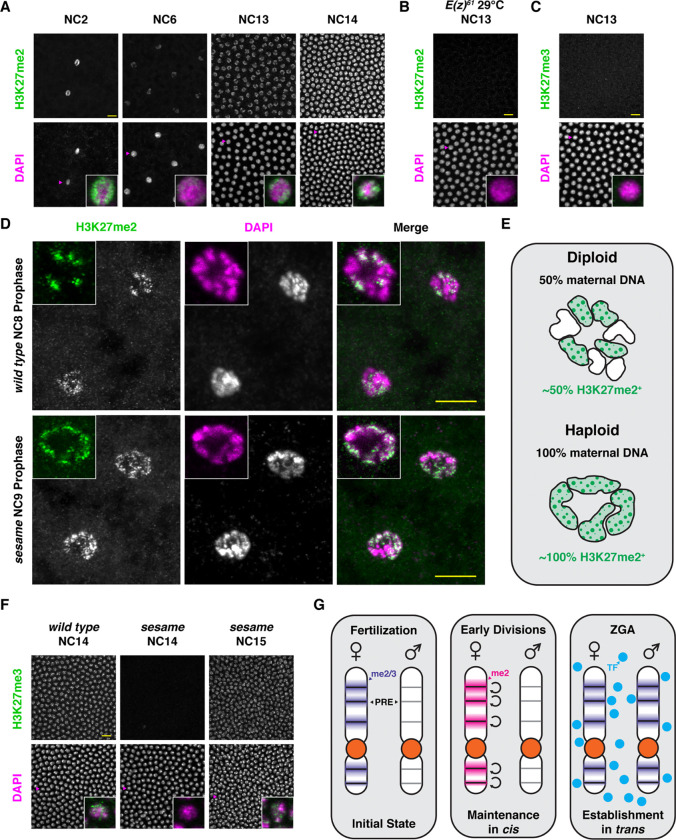
Polycomb Group (PcG) proteins regulate the chromatin composition of an embryo by facilitating the mono, di, and tri-methylation of Histone H3 Lysine 27 (H3K27me1/2/3). For the zygote to inherit an H3K27 methylation blueprint from its mother, PcG-modified states established during oogenesis must persist through early embryogenesis until the onset of large-scale zygotic transcription (Zygotic Genome Activation, ZGA). However, questions have persisted regarding the relative contributions of two molecular mechanisms to the propagation of H3K27 methylation through early development: 1) allosteric regulation of the H3K27 methyltransferase Enhancer of Zeste ( E ( z ) ) by existing H3K27me2/3, and 2) nucleation of E ( z ) activity at chromatin by DNA binding factors. Here, we investigate how allostery and nucleation contribute to H3K27 methylation dynamics in early Drosophila embryogenesis by developing and experimentally validating a mathematical model. This model incorporates measurements of the nuclear concentration dynamics of E ( z ) and the Polycomb Response Element binding factor Pleiohomeotic (Pho), as well as the dilution of epigenetic modifications at DNA replication with the incorporation of histones to nascent chromatin. With stochastic simulations and in vivo experiments, we assert that allosteric regulation of E ( z ) maintains a PcG-imprint on maternal chromosomes in the form of lower-order H3K27 methylation states (H3K27me1/2), that de novo establishment of H3K27 methylation at paternal chromosomes relies on nucleation of E ( z ) activity by Pho, and that broad H3K27me3 domains at both maternal and paternal chromosomes are re-established at ZGA. This work provides a mechanistic explanation for the inheritance of Polycomb states in contexts of intense cellular proliferation.


Figures

Figure 1:
Figure 1:. H3K27 methylation accumulates at PREs over NC14.
A) Shown are the counts-per-million (CPM) normalized ChIP-seq measurements of H3K27me3, E(z), and Pho along a genome track containing the knrl and kni loci (data from Gonzaga-Saavedra et al., 2025) (18). H3K27me3 was measured in embryos staged at NC13, NC14-early (NC14E), NC14-mid (NC14M), and NC14-late (NC14L) (18). Y-axis CPM ranges are indicated in brackets at left. E(z) and Pho occupy nucleation sites (PREs, annotated at top), around which H3K27me3 spreads throughout NC14. At this region, PREs are spaced sufficiently far apart such that there is not substantial merging of H3K27me3 domains by NC14L. Scale bar = 5 kb. B) Analysis of mean H3K27me3 signal flanking isolated E(z) peaks as measured via ChIP-seq at NC13, NC14E, NC14M, and NC14L time points. X-axis values are reported in nucleosome equivalents, with one nucleosome equal to 180 bp. H3K27me3 increases throughout NC14. C) Analysis of mean H3K27me1 signal flanking isolated E(z) peaks as measured via ChIP-seq at NC13, NC14E, NC14M, and NC14L time points. As in B, X-axis values are reported in nucleosome equivalents. H3K27me1 is progressively depleted with the formation of H3K27me3 domains. D) Analysis of H3K27me3 ChIP-seq signal flanking 128 isolated E(z) peaks. Plotted are distributions of the 99th percentiles of the H3K27me3 CPM measurements associated with the isolated PREs at each measured time point (NC13, NC14E, NC14M, NC14L). H3K27me3 increases in a linear fashion between NC14E and NC14L.
Figure 2:
Figure 2:. Stochastic simulation of H3K27 methylation dynamics.
A) Schematic of the simulation strategy. In the model, E(z) (PRC2, green) can methylate a nucleosome within an array if allosterically stimulated by existing H3K27me2/3, or if Pho has concurrently bound the locus (diagram at left). Methylation reactions are modeled as a series of stochastic decisions (outlined at right). At t=0, a chromatin fiber is initialized with an initial H3K27 methylation composition. At each subsequent timepoint, the algorithm inspects the nucleosome array to determine whether methylation groups are added (when successful allostery- or nucleation-driven reactions occur), or removed (at the timepoints of DNA replication). The simulation strategy is outlined in detail in the Methods and is a modified form of a recently published algorithm (25). In the schematic, α is a constant that scales the baseline methylation probability, V, according to the methylation substrate (α = 14 for H3K27me0, 4 for H3K27me1, and 0 for H3K27me3). The parameter allo and acts to scale the methylation probability when allosteric stimulation of E(z) occurs. B) Modeled nuclear concentration dynamics of E(z) and Pho based on prior live imaging measurements of EGFP-E(z) and Pho-sfGFP (Methods) (18). C) Shown are the results of a parameter sweep for the baseline methylation probability, V, from 5×10⁻⁴ to 2×10⁻³ in steps of 2.5×10⁻⁵, holding all other parameters constant (allo = 3.5, Ke=Kp=10nM, Methods). The absolute value of the sum of the differences between the predicted and measured relative H3K27me3 levels at NC14-early, NC14-mid, and NC14-late are shown for the tested values of V.V=1.075×10⁻³ best predicts the NC14 H3K27me3 relative ChIP-seq values. D-E) Modeled dynamics of H3K27 methylation over the first 307 minutes of development (16 cell divisions, Methods). In each plot, shown are the mean fractions of H3K27 positions in a 300-nucleosome chromatin fiber with me0, me2, and me3 marks calculated from n = 100 simulations. For maternal chromosomes, simulations were performed with the initial condition where 50% of H3K27 positions were me0, 0% were me1, 25% were me2, and 25% were me3. For paternal chromosomes, simulations were performed with the initial condition where 100% of H3K27 positions were me0. Red arrowheads mark the time points when H3K27me3 was measured via ChIP-seq (NC13 = mitosis 12 + 10’, NC14E = mitosis 13 +15’, NC14M = mitosis 13 + 35’, NC14L = mitosis 13 + 60’).
Figure 3:
Figure 3:. Modeled parent-of-origin differences.
A-B) Modeled dynamics of H3K27 methylation over the first 307 minutes of development (16 cell divisions, Methods) when nuclear Pho is held at a constant maximal value (181 nM). In each plot, shown are the mean fractions of H3K27 positions in a 300-nucleosome chromatin fiber with me0, me2, and me3 marks calculated from n = 100 simulations. For maternal chromosomes, simulations were performed with the initial condition where 50% of H3K27 positions were me0, 0% were me1, 25% were me2, and 25% were me3. For paternal chromosomes, simulations were performed with the initial condition where 100% of H3K27 positions were me0. C) Shown are the differences between the mean methylation states of maternal and paternal chromosomes as calculated on a per-nuclear cycle basis for the Dynamic Pho (Fig. 2 D–E) and Constant Pho simulations (Fig. 3 A–B). If nuclear Pho concentrations are limited in the early nuclear cycles, paternal chromosomes take longer to catch up to the PcG state of the maternal chromosomes than when nuclear Pho concentrations are high from the beginning of development.
Figure 4:
Figure 4:. H3K27me2 is propagated on maternal chromosomes in cis throughout the cleavage divisions.
A) H3K27me2 is detected on chromatin throughout early development. Representative images are shown for early embryos at the indicated stages immunostained for H3K27me2 (top) and co-stained for DAPI (bottom). Merged images for representative nuclei (magenta arrowheads) for each stage are shown in the insets (green = H3K27me2, magenta = DAPI). Image intensities are scaled to allow direct quantitative comparison of staining intensity between images. Scale bar (yellow) is 10 μm. B) Early embryonic H3K27me2 deposition depends on E(z) function. Shown is a representative image of an NC13 embryo from an E(z)61 mother collected at 29°C stained for H3K27me2 and DAPI and displayed as in panel A. Scale bar (yellow) is 10 μm. C) H3K27me3 is not strongly detected on NC13 chromatin. Shown is a representative image of an NC13 embryo from a wild type mother stained for H3K27me3 and DAPI and displayed as in panel A. Scale bar (yellow) is 10 μm. D) H3K27me2 marks maternally derived chromatin. Wild type (top) or sesame mutant (bottom) embryos were stained for H3K27me2 and DAPI. The images show maximum projections of two nuclei from representative mid-cleavage stage embryos at prophase of the cell cycle. Insets show a single z-plane bisecting a single nucleus to highlight condensing chromosome figures. While a subset of DAPI-positive material in wild type embryos is stained for H3K27me2, all DAPI-positive material in sesame mutant embryos show punctate H3K27me2 staining. Scale bar (yellow) is 10 μm. E) Cartoon representation of insets in panel D. DAPI staining for wild type and sesame mutant was traced and color coded to indicate scored H3K27me2 positive material. Haploid embryos from sesame mutants only contain maternally-derived chromatin. F) Delayed cell cycle lengthening delays deposition of H3K27me3. Wild type (left) or sesame mutant (middle and right) embryos were stained for H3K27me3 and DAPI and displayed as in panel C. H3K27me3 accumulates on chromatin at NC14 in wild type embryos (left). sesame mutants undergo an additional division before undergoing cell cycle lengthening. H3K27me3 is absent on sesame chromatin at NC14 (middle), but accumulates to comparable levels one cell cycle later at NC15 (right). Scale bar (yellow) is 10 μm. G) Cartoon summary of H3K27 methylation dynamics in early Drosophila development. The maternal genome is marked by H3K27me2/3 and this mark is absent from the paternal genome (left). During the cleavage divisions, the maternal imprint is maintained in cis at the level of H3K27me2 (middle). Once trans-acting factors gain nuclear localization during ZGA, they operate to re-establish methylation patterns on paternal chromatin (right).

Similar articles

References

    1. . Grossniklaus U, Paro R. Transcriptional Silencing by Polycomb-Group Proteins. Cold Spring Harb Perspect Biol. 2014. Nov 1;6(11):a019331. - PMC - PubMed
    1. . Jürgens G. A group of genes controlling the spatial expression of the bithorax complex in Drosophila. Nature. 1985. July;316(6024):153–5.
    1. . Lewis EB. A gene complex controlling segmentation in Drosophila. Nature. 1978. Dec;276(5688):565–70. - PubMed
    1. . Schuettengruber B, Bourbon HM, Di Croce L, Cavalli G. Genome Regulation by Polycomb and Trithorax: 70 Years and Counting. Cell. 2017. Sept 21;171(1):34–57. - PubMed
    1. . Schwartz YB, Pirrotta V. Polycomb silencing mechanisms and the management of genomic programmes. Nat Rev Genet. 2007. Jan;8(1):9–22. - PubMed

Publication types

LinkOut - more resources