

This is a preprint.
Label-Free Longitudinal Imaging of Single Cell Drug Response with a 3D-Printed Cell Culture Platform
- PMID: 40766547
- PMCID: PMC12324531
- DOI: 10.1101/2025.08.02.668298
Label-Free Longitudinal Imaging of Single Cell Drug Response with a 3D-Printed Cell Culture Platform
Abstract
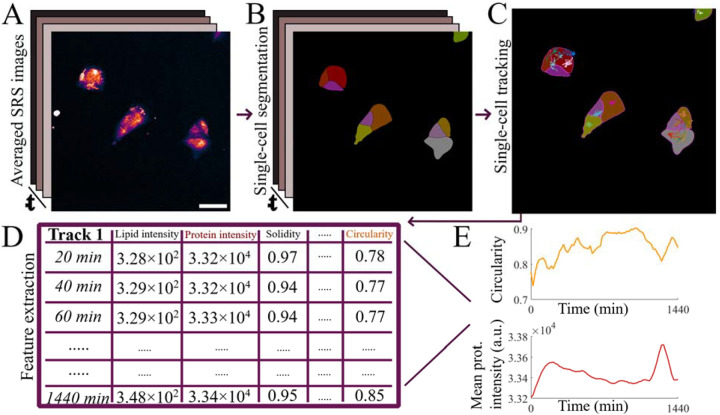
Image-based phenotypic screening has emerged as a powerful tool for revealing single-cell heterogeneity and dynamic phenotypic responses in preclinical drug discovery. Compared to traditional static end-point assays, live-cell longitudinal imaging captures the temporal trajectories of individual cells, including transient morphological adaptations, motility shifts, and divergent subpopulation behaviors, enabling high content features and more robust early prediction of treatment outcomes. Fluorescence-based screening, while highly specific, is constrained in live-cell contexts by broad spectral overlaps (limiting multiplexing to fewer than six channels), bulky fluorophores that may perturb small-molecule interactions, and photobleaching or phototoxicity under repeated excitation. Stimulated Raman scattering (SRS) microscopy overcomes these barriers by delivering label-free, quantitative chemical contrasts alongside morphological information. Here, we present a low-cost, 3D printed cell culture platform compatible with the stringent optical requirements of SRS microscopy. This set up enables real-time drug delivery and continuous monitoring of biochemical and morphological changes in living cells during 24-hour time-lapse imaging with minimal photodamage. We outline a processing pipeline for longitudinal SRS images to extract chemical and morphological features of single live cells. Using this system, we showcase time-lapse SRS microscopy as a tool to map heterogenous drug-induced single-cell response over time, enabling the identification of varying trajectories within complex cell populations. By parallelizing multi-well perfusion with label-free chemical imaging, our approach offers a pathway toward high-throughput pharmacodynamic assays for the acceleration of phenotypic screening and personalized medicine.
Figures


Similar articles
-
Management of urinary stones by experts in stone disease (ESD 2025).Arch Ital Urol Androl. 2025 Jun 30;97(2):14085. doi: 10.4081/aiua.2025.14085. Epub 2025 Jun 30. Arch Ital Urol Androl. 2025. PMID: 40583613 Review.
-
Novel application of metabolic imaging of early embryos using a light-sheet on-a-chip device: a proof-of-concept study.Hum Reprod. 2025 Jan 1;40(1):41-55. doi: 10.1093/humrep/deae249. Hum Reprod. 2025. PMID: 39521726 Free PMC article.
-
Leveraging a foundation model zoo for cell similarity search in oncological microscopy across devices.Front Oncol. 2025 Jun 18;15:1480384. doi: 10.3389/fonc.2025.1480384. eCollection 2025. Front Oncol. 2025. PMID: 40606969 Free PMC article.
-
Short-Term Memory Impairment.2024 Jun 8. In: StatPearls [Internet]. Treasure Island (FL): StatPearls Publishing; 2025 Jan–. 2024 Jun 8. In: StatPearls [Internet]. Treasure Island (FL): StatPearls Publishing; 2025 Jan–. PMID: 31424720 Free Books & Documents.
-
How lived experiences of illness trajectories, burdens of treatment, and social inequalities shape service user and caregiver participation in health and social care: a theory-informed qualitative evidence synthesis.Health Soc Care Deliv Res. 2025 Jun;13(24):1-120. doi: 10.3310/HGTQ8159. Health Soc Care Deliv Res. 2025. PMID: 40548558
References
-
- Schwartz H. R.; Richards R.; Fontana R. E.; Joyce A. J.; Honeywell M. E.; Lee M. J. Drug GRADE: An Integrated Analysis of Population Growth and Cell Death Reveals Drug-Specific and Cancer Subtype-Specific Response Profiles. Cell Rep. 2020, 31 (12), 107800. 10.1016/j.celrep.2020.107800. - DOI - PMC - PubMed
-
- Way G. P.; Kost-Alimova M.; Shibue T.; Harrington W. F.; Gill S.; Piccioni F.; Becker T.; Shafqat-Abbasi H.; Hahn W. C.; Carpenter A. E.; Vazquez F.; Singh S. Predicting Cell Health Phenotypes Using Image-Based Morphology Profiling. Mol. Biol. Cell 2021, 32 (9), 995–1005. 10.1091/mbc.E20-12-0784. - DOI - PMC - PubMed
Publication types
Grants and funding
LinkOut - more resources
Full Text Sources