[Preprint]. 2025 Jul 31:2025.07.24.666654.
doi: 10.1101/2025.07.24.666654.

A multimodal approach for visualization and identification of electrophysiological cell types in vivo

Affiliations

A multimodal approach for visualization and identification of electrophysiological cell types in vivo

Eric Kenji Lee et al. bioRxiv. .

Abstract

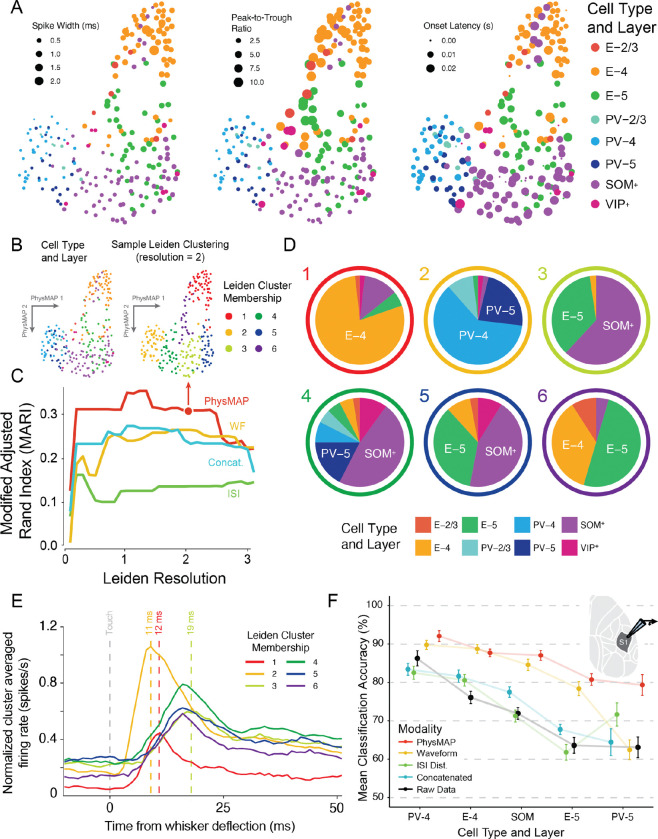
Neurons of different types perform diverse computations and coordinate their activity during sensation, perception, and action. While electrophysiological recordings can measure the activity of many neurons simultaneously, identifying cell types during these experiments remains difficult. To identify cell types, we developed PhysMAP, a framework that weighs multiple electrophysiological modalities simultaneously to obtain interpretable multimodal representations. We apply PhysMAP to seven datasets and demonstrate that these multimodal representations are better aligned with known transcriptomically-defined cell types than any single modality alone. We then show that such alignment allows PhysMAP to better identify putative cell types in the absence of ground truth. We also demonstrate how annotated datasets can be used to infer multiple cell types simultaneously in unannotated datasets and show that the properties of inferred types are consistent with the known properties of these cell types. Finally, we provide a first-of-its-kind demonstration of how PhysMAP can help understand how multiple cell types interact to drive circuit dynamics. Collectively, these results demonstrate that multimodal representations from PhysMAP enable the study of multiple cell types simultaneously, thus providing insight into neural circuit dynamics.

Keywords: Cell types; Dimensionality Reduction; Electrophysiology; Multi-Modal Analysis; optotagging.


Conflict of interest statement

Declaration of Interests The authors declare no competing interests.

Figures

Figure 1:
Figure 1:. Multi-modal combination of physiological properties leads to structured representations that align with cell types.
(A) UMAP on normalized average waveform shapes of neurons (n = 246) recorded in vivo juxtacellularly from mouse primary somatosensory cortex. Each unit is colored according to one of eight ground truth cell types. Each modality was combined in different proportion according to the sum of each modality’s per-unit contribution to the total; this total contribution is listed as a percentage below each scatter plot. (B) UMAP on ISI distributions of the same neurons in (A). (C) Each neuron in PhysMAP’s WNN representation weighs each modality differently. These modal contributions are the sum of nearest neighbor edge modality weights (βModality in Fig. A.13J) and are shown in their proportion of the per-unit WNN weight (pie charts) or across all units (inset histogram). (D) PhysMAP’s combined multimodal representation obtained using the WNN approach. Again, each neuron is colored according to their ground truth cell type and layer. (E) Both modalities were concatenated into a single data vector per unit and passed into UMAP. This represents each modality in unweighted combination (as opposed to the WNN approach).
Figure 2:
Figure 2:. PhysMAP identifies cell types from juxtacellular recordings better than any modality alone.
(A) Juxtacellular single unit recordings (n = 246) from mouse primary somatosensory cortex were collected under two modalities: juxtacellular waveform shape and inter-spike interval distribution in response to whisker deflection. Shown are two-dimensional PhysMAP visualizations of these units. Each unit is colored according to its ground truth cell type as deduced by optogenetic tagging in addition to layer information. The spike width (time from trough to peak), peak-to-trough ratio (ratio of trough and peak absolute amplitude), and spiking onset latency (trial-averaged time to half-peak in firing rate) for each neuron. Marker sizes shown are proportional in area to the log of the scaler value. (B) The PhysMAP projection of neurons with their ground truth cell type and layer (left) next to an example Leiden clustering with resolution parameter set to 2 (right). (C) Leiden clustering is applied to the UMAP graphs of each modality alone (waveform [WF] or ISI dist. [ISI]), unweighted combination (concat.), or in weighted (PhysMAP) and shown with the associated modified adjusted Rand index (MARI;) across a range of resolution parameter values. Arrow marker indicates the clustering on PhysMAP used above in (B). Waveform metrics and “raw data” (that is, without constructing a UMAP graph and projecting it) were omitted in this analysis because these do not yield a high-dimensional UMAP graph. (D) Each of the Leiden clusters located in (B) are shown broken down into their constituent cell types. Outer ring color indicates the Leiden cluster and inner pie chart denotes the relative proportions of underlying cell types within said Leiden cluster. (E) Each of the Leiden clusters in (B, right) and (D) are shown with their respective normalized and smoothed peri-stimulus time histograms aligned to a whisker deflection (“touch” stimulus). Also labeled are the firing rate peak times of several Leiden clusters relative to the stimulus (dashed lines). (F) A gradient boosted tree model (GBM) classifier was trained on this multimodal data with 5-fold cross-validation on each modality’s UMAP graph individually or on the multimodal WNN graph. The same classifier was also trained directly on the “raw data” (that is, without constructing a UMAP graph and projecting it; black line). The balanced accuracy performance of this classifier (mean α S.E.M.) on held-out data for each modality or the combined modalities for the five cell type classes with over 10 samples (units) each.
Figure 3:
Figure 3:. PhysMAP identifies cell types in extracellular recordings.
(A) PhysMAP applied to putative single unit (n = 373) extracellular recordings from mouse auditory cortex using silicon multi-channel probes. We used waveform shape and ISI distribution as our modalities and neurons are colored according to cell type whose identities were obtained via optogenetic tagging. Marker size is set according to the increase in spike rate from optogenetic stimulation relative to baseline. Highlighted are a population of wide-spiking SOM+ cells (top) and narrow-spiking SOM+ cells (right). Excitatory cells are shown as orange x’s because optogenetic modulation was negative and too small to see by size. (B) A GBM classifier with five-fold cross-validation was trained on the 10-dimensional graph of each modality or PhysMAP. The classifier was also trained directly on the raw (un-dimensionality reduced) multimodal data or simply waveform spike width to identify each optotagged cell type or untagged label. The balanced classification accuracy is shown (mean α S.E.M.) with many error bars smaller than marker size. (C) Normalized average waveforms in this dataset are passed into UMAP and their projection shown with optotagged cells colored and degree of optogenetic modulation (average change in spikes/s during stimulation epochs) shown by marker size. (D) Similarly, ISI distributions for these same neurons are also passed into UMAP and their projection shown. (E) Gaussian kernel probability density estimates for the distribution of each optotagged type across a range of spike widths is shown both as a histogram and with a kernel density estimator (solid line and shaded region). (F) Additionally, spike width is shown for all cells, including untagged ones.
Figure 4:
Figure 4:. PhysMAP outperforms single-modality approaches and deep learning methods for inhibitory cell type identification.
(A) UMAP visualizations of mouse V1 neurons recorded with Neuropixels Ultra probes, shown using different dimensionality reduction methods: PhysMAP multimodal integration (top left), UMAP on 3D-autocorrelograms alone (top right), and UMAP on waveforms alone (WaveMAP, bottom). Cells are color-coded by optogenetic tagging: PV+ (teal), SOM+ (purple), VIP+ (pink), and untagged cells (gray). (B) Confusion matrices comparing classification performance of a GBM (raw accuracy) trained on the high-dimensional representations (all matched at 60 dims.) across three approaches: PhysMAP (top left), 3D-ACG UMAP (top right), and waveform UMAP/WaveMAP (bottom left). A multi-layer perceptron was used to classify cell types from the latent embedding of a pair of β-variational autoencoders (bottom right). Values represent the percentage of cells from each true cell type (rows) assigned to each predicted type (columns). Color intensity corresponds to classification accuracy. Highest true positive percentages per cell type across all approaches are highlighted by embossing.
Figure 5:
Figure 5:. PhysMAP enables cross-dataset cell type identification through modality assessment and label transfer
(A) Two mouse visual cortex datasets visualized using PhysMAP: the Visual Behavior dataset (VB, green, recorded with Neuropixels 1.0) and the Ultras dataset (Ultras, yellow, recorded with Neuropixels Ultra). Diagrams show probe placements for each experiment. Waveform shape and 3D-autocorrelogam (ACG) are combined in PhysMAP and experiments are shown in the same visualization. (B) Constituent modality-specific UMAP projections with waveform shape (top) and 3D-ACG modality (bottom). Units are again colored according to originating experiment (green for Ultras; yellow for VB). Horizontal dashed line is just to make clear that top and bottom are part of different modalities. (C) Waveform shapes and 3D-autocorrelograms from two subsets (different animals) of VB experiments, one containing an image set H (in red) and another an image set G (in blue). (D) The VB multimodal representation is split into its constituent modalities. This consists of waveform shape (left) and 3D-ACG (right).
Figure 6:
Figure 6:. PhysMAP enables cross-dataset cell type identification through modality assessment and label transfer
(A) Cell type ground truth labels in the combined dataset embedding. Optotagged inhibitory interneurons are color-coded: PV+ (teal), SOM+ (purple), and VIP+ (red) cells, with untagged cells in gray. (B) Inferred SOM+ cells in the VB dataset (pink circles) based on nearest-neighbor relationships with ground truth SOM+ cells from the Ultras dataset with waveform shapes shown (pink in inset) on a background of all waveforms in the VB dataset (gray in inset). (C) Inferred PV+ cells in the VB dataset (green circles) using the same approach also with waveform shapes shown (green in inset) on a background of all waveforms in the VB dataset (gray in inset).
Figure 7:
Figure 7:. Label transfer allows inference of PV+ and SOM+ cell types.
(A) Simultaneous raster plots in response to a dark full-field flash (top), smoothed trial-averaged firing rates (spikes/s with SEM and 100 ms time bin Gaussian smoothing; middle), and autocorrelograms (ACG; bottom) for simultaneously recorded inferred PV+ cell in visual areas VISal (green). Black overbar or vertical dashed lines indicate stimulus onset and offset times. Each raster’s row is a simultaneous trial shared by all cells. (B) Simultaneously inferred SOM+ cell in VISpm (pink, contemporaneously recorded with the PV+ neuron in Fig. 7A) also with rasters, smoothed trial-averaged firing rates, and ACGs (top, middle, and bottom respectively). (C) PSTH’s (normalized spikes/s with SEM) for all inferred PV+ units (across experiments). (D) PSTH’s for inferred SOM+ neurons. Each trace consists of binned spike times (1 ms, non-overlapping bins) and is normalized by the maximum trial-averaged firing rate for said unit.
Figure 8:
Figure 8:. Simultaneous monitoring of three interneuron cell types with PhysMAP reveals microcircuits during behavior.
(A) A simultaneously recorded optotagged VIP+ cell (red) during visual stimulus (black full-field flash) presentation with spike raster (top) and trial-averaged PSTH (mean with SEM; bottom). (B, left) Cross-correlogram with the VIP+ cell spike times (target) onto a SOM+ (second SOM+ cell in A) cell’s spike times (reference). Bins are 0.1 ms. Dashed line to indicate time bin zero. (C, top) Cross-correlograms for a putative PV+ cell onto the SOM+ cell in F (2 ms bin width). Dashed line indicates 0 ms bin. (C, bottom) Cross-correlograms for a putative PV+ cell onto the VIP+ cell in F (2 ms bin width). Dashed line indicates 0 ms lag. (D, top) Average spike waveform of the putative PV+ neuron inhibiting both the SOM+ and VIP+ cells. (D, bottom) 2D-autocorrelogram of the putative PV+ cell with peak in firing rate at 67 Hz (2 ms time bins).

References

    1. Scala F, et al. (2021) Phenotypic variation of transcriptomic cell types in mouse motor cortex. Nature 598(7879):144–150. - PMC - PubMed
    1. Gouwens NW, et al. (2020) Integrated morphoelectric and transcriptomic classification of cortical gabaergic cells. Cell 183(4):935–953. - PMC - PubMed
    1. (BICCN) BICCN (2021) A multimodal cell census and atlas of the mammalian primary motor cortex. Nature 598(7879):86–102. - PMC - PubMed
    1. Bomkamp C, et al. (2019) Transcriptomic correlates of electrophysiological and morphological diversity within and across excitatory and inhibitory neuron classes. PLoS Computational Biology 15(6):e1007113. - PMC - PubMed
    1. Keller AJ, et al. (2020) A Disinhibitory Circuit for Contextual Modulation in Primary Visual Cortex. Neuron. - PMC - PubMed

Publication types

LinkOut - more resources