[Preprint]. 2025 Jul 30:2025.07.29.667267.
doi: 10.1101/2025.07.29.667267.

A Structure-Based Computational Pipeline for Broad-Spectrum Antiviral Discovery

Affiliations

A Structure-Based Computational Pipeline for Broad-Spectrum Antiviral Discovery

Maria A Castellanos et al. bioRxiv. .

Abstract

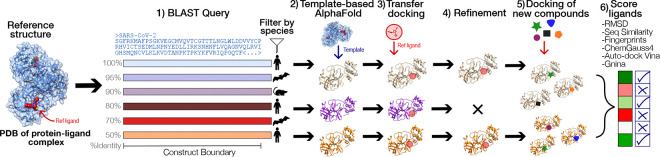
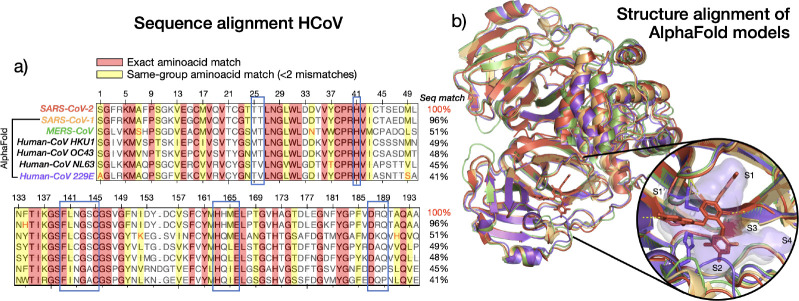
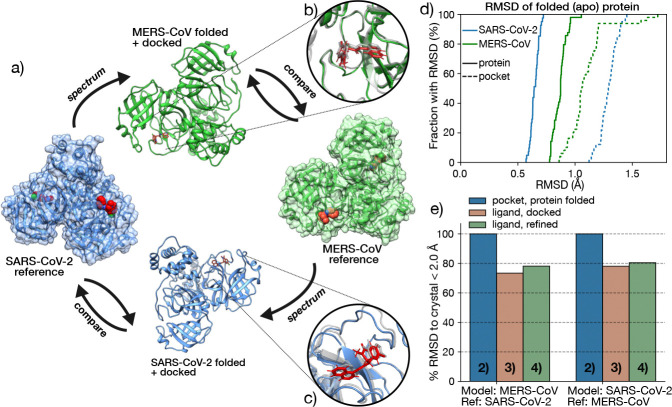
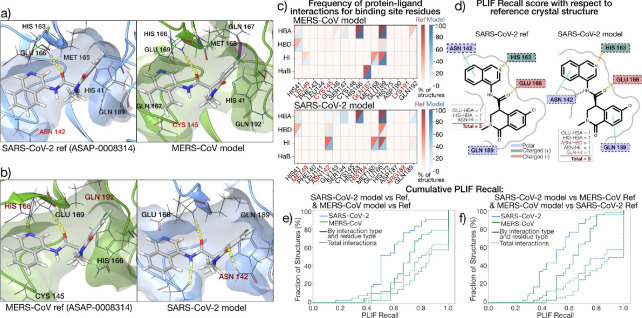
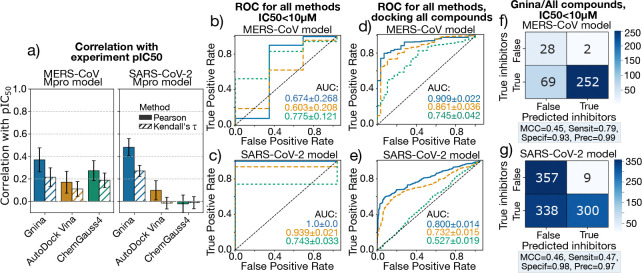
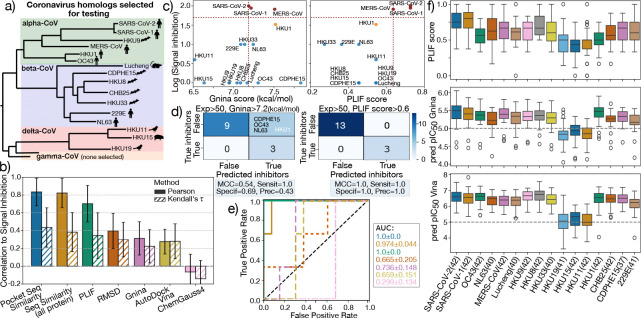
The rapid emergence of viruses with pandemic potential continues to pose a threat to public health worldwide. With the typical drug discovery pipeline taking an average of 5-10 years to reach clinical readiness, there is an urgent need for strategies to develop broad-spectrum antivirals that can target multiple viral family members and variants of concern. We present a structure-based computational pipeline designed to identify and evaluate broad-spectrum inhibitors across viral family members for a given target in order to support spectrum breadth assessment and prioritization in lead optimization programs. This pipeline comprises three key steps: (1) an automated search to identify viral sequences related to a specified target construct, (2) pose prediction leveraging any available structural data, and (3) scoring of protein-ligand complexes to estimate antiviral activity breadth. The pipeline is implemented using the drugforge package: an open-source toolkit for structure-based antiviral discovery. To validate this framework, we retrospectively evaluated two overlapping datasets of ligands bound to the SARS-CoV-2 and MERS-CoV main protease (Mpro), observing useful predictive power with respect to experimental binding affinities. Additionally, we screened known SARS-CoV-2 Mpro inhibitors against a panel of human and non-human coronaviruses, demonstrating the potential of this approach to assess broad-spectrum antiviral activity. Our computational strategy aims to accelerate the identification of antiviral therapies for current and emerging viruses with pandemic potential, contributing to global preparedness for future outbreaks.


Figures

Figure 1.
Figure 1.. The affinity across a viral family can be predicted with a combination of sequence similarity search, docking, and affinity calculations.
Starting from the PDB crystal structure of the reference protein and ligand complex (e.g., a SARS-CoV-2 Mpro dimer), a BLAST search is performed to find other proteins belonging to the same family. A few sequences of interest are selected given a filter criteria (e.g., all the viral proteins that infect humans) and then folded using the AlphaFold2-multimer model. Then, the coordinates of the reference ligand are transferred to the apo-protein, under the assumption that the binding pockets are similar. The new complex is docked, and P-L interactions are optimized with molecular mechanics force field minimization. The refined complex structures can then be used to dock new compounds and the inhibitors are scored by a combination of different methods.
Figure 2.
Figure 2.. The Mpro binding pocket is highly conserved across the coronavirus family.
(a) Multiple sequence alignment on proteins of the coronavirus family that infect humans, with exact aminoacid matches highlighted in red and same-group matches highlighted in yellow. The alignment shows significant conservation of the sequence, especially in the residues belonging to SARS-CoV-2 Mpro binding pocket (< 5A from ligand, outlined in blue). (b) Coronavirus proteins on the left are folded with the AlphaFold2 multimer model and aligned to SARS-CoV-2 Mpro, shown here in complex with Ensitrelvir (8dz0 Noske et al. (2023)), with each protein colored as indicated in a). The insert contains a zoomed view of the binding pocket with polar contacts as yellow dashed lines, as well as the pocket surface of the reference (white) and Human-CoV 229E (purple), with all pockets subunits indicated.
Figure 3.
Figure 3.. Our pipeline was retrospectively validated against a set of overlapping SARS-CoV-2 and MERS-CoV P-L co-crystalized structures
(a) Schematic illustration of the validation process. A reference SARS-CoV-2 Mpro P-L complex serves as a template for folding and docking a MERS-CoV apo-protein; the docked complexes are then compared with the X-ray crystal structures available for SARS-CoV-2, in complex with the same set of ligands. The same process can be followed to predict the SARS-CoV-2 structure from a MERS-CoV template. (b) A zoomed view of the binding pocket of the predicted MERS-CoV Mpro structure (green) compared with the SARS-CoV-2 template (shown here in complex with ASAP-0008314, gray). (c) Predicted SARS-CoV-2 (blue) starting from a MERS-CoV Mpro template (shown here in complex with ASAP-0008314, gray). (d) The ECDF cumulative distribution of the heavy-atom RMSD between the SARS-CoV-2 (blue) and MERS-CoV Mpro (green) apo-proteins predicted via AlphaFold2 and the corresponding crystal structure templates, shows good agreement between the two. The protein RMSD is shown in solid lines while the binding pocket (residues within <5.0Å from the ligand) RMSD is shown in dashed lines. (e) Fraction (in %) of RMSD within 2A with respect to the crystal structure with matching ligand for: the binding pocket of the AlphaFold folded proteins (blue), the ligand after the transfer docking (green) and the ligand after docking and refinement (red), corresponding to the 4, 5 and 6th steps of the pipeline in Figure 1, respectively. Here, we define the binding pocket as all residues within 5Åfrom the ligand.
Figure 4.
Figure 4.. Protein-ligand interaction fingerprints are relatively conserved in the folded SARS-CoV-2 and MERS-CoV structures compared to the crystal.
3D visualization generated with Maestro of P-L hydrogen-bond interactions (yellow) of crystal structure vs docked pose for (a) MERS-CoV Mpro as predicted from a SARS-CoV-2 reference crystal, and (b) SARS-CoV-2 Mpro as predicted from a MERS-CoV reference, both in complex with ASAP-0008314. The 3D visualization in the top panels shows that key interactions are conserved as we go from SARS-CoV-2 to MERS-CoV, with some differences (red) as we go from MERS-CoV to SARS-CoV-2. (c) PLIFs for matching residues in the binding pocket of SARS-CoV-2 (top) and MERS-CoV (bottom), with unmatched residues indicated in red font. The frequency (in %) per residue and interaction type is shown as a red gradient for the set of X-ray crystal structures, and blue for the predicted models. Interaction types are Hydrogen Bond Acceptor (HBA), Hydrogen Bond Donor (HBD), Hydrophobic Interaction (HI) and Halogen Bond (HaB). Results show agreement between model and reference, and conservation of key interactions between SARS and MERS. (d) 2D visualization of PLIFs for the SARS-CoV-2 reference and predicted model, showing HBA, HBD and HIs in orange, brown and cyan, respectively, with residues also by side chain properties. The insert illustrates how interactions are accounted for in terms of interaction type and residue type and total number of interactions. (e) Cumulative distribution function (CDF) plot for the PLIF Recall score for ref vs model calculated as described in the text, for SARS-CoV-2 (blue) and MERS-CoV (green), and the two types of interaction match criteria illustrated in d). MERS-CoV models shows a better agreement with experiment than SARS-CoV-2, in terms of PLIFs.
Figure 5.
Figure 5.. Calculated Scores for the folded MERS-CoV and SARS-CoV-2 Mpro targets show a direct correlation with antiviral efficacy as determined from biochemical assays.
(a) Pearson (solid bars) and Kendall’s τ (hatched bars) correlations between experimental pIC50 values for MERS-CoV and SARS-CoV-2 Mpro inhibitors, and scores predicted for the folded and docked models (78 and 149, respectively). Error bars show 95% confidence intervals from bootstrap resampling. (b-c) Receiver operating characteristic (ROC) curves for classification in the same ligand set using Gnina (blue), AutoDock Vina (orange) and ChemGauss4 (green), for the MERS-CoV (b) and SARS-CoV-2 (c) predicted models. AUC scores are reported, with errors calculated via bootstrap resampling. Here, a ligand is classified as an “inhibitor” when the IC50 is below 10μM. (d–e) ROC curves for the extended set predicted by docking all the ligands in the ASAP-0008314 folded model (351 and 1004). (f-g) Confusion matrix for the Gnina CNN predicted affinities for the MERS-Cov (f) and SARS-CoV-2 (g) models, and all available compounds docked. The Matthews Correlation Coefficient (MCC) score, sensitivity (Sensit), specificity (Specif) and precision (Prec) are shown in a shaded box below each matrix.
Figure 6.
Figure 6.. Broad-spectrum activity is tested against 16 human and non-human coronaviruses, showing accurate prediction of signal inhibition in Ensitrelvir fluorescence-based assay.
(a) Phylogenetic tree of alpha, beta and delta coronaviruses tested against our pipeline, adapted from Fig 4 in (Leonard et al., 2023). (b) Pearson (solid bars) and Kendall τ (hatched bars) correlations between recovered signal (defined as 100%-[Normalized reporter signal], as presented in cell-based experimental assay) and binding affinity predictions from the different scoring methods studied in this manuscript: Binding pocket and all-protein sequence similarity to SARS-CoV-2 reference, PLIFs (by interaction type and residue type), Ligand RMSD with respect to the reference crystal, Gnina CNN score, AutoDock Vina and ChemGauss4 score. c) Scatter plot of reporter signal inhibition (in the log10 scale) vs Gnina (left) and PLIF (right) predicted score for all 16 targets. Dashed red lines indicate the cutoff set for labeling compound activity, while inhibited, partially and non-inhibited compounds, according to experiment, are indicated with red, orange and blue, respectively. d) Confusion matrix for Gnina (left) and PLIF (right) score predictions, with predicted inhibition cuttoff of 7.2 kcal/mol, and 0.6, respectively, and three true active (red in panel b). e) ROC curves for each of the scoring functions and AUC scores, with colors matching those in panel a). f) Distribution of predicted PLIF scores (top), Gnina pIC50s (middle) and AutoDock Vina pIC50s (bottom), across 16 CoV targets for the set of 43 ASAP compounds with available SARS-CoV-2 and MERS-CoV X-ray crystal structures. Outliers are indicated as unfilled circles.
Figure 7.
Figure 7.. The ligand transfer and minimization strategy has comparable performance to state-of-the-art co-folding methods.
Area under the ROC curve (AUC) for selected scoring methods applied to protein–ligand models of Ensitrelvir across the coronavirus panel. Results are shown for models generated using our ligand transfer and refinement approach (blue), and compared with two co-folding–based methods: Chai-1 (yellow) and Boltz-2 (green). The baseline of AUC=0.5, which corresponds to random classification performance, is shown as a gray dashed line.

Similar articles

References

    1. PROCEEDINGS OF THE PHYSIOLOGICAL SOCIETY: January 22, 1910. The Journal of Physiology. 1910; 40(suppl):i–vii. https://physoc.onlinelibrary.wiley.com/doi/abs/10.1113/jphysiol.1910.sp0..., doi: 10.1113/jphysiol.1910.sp001386. - DOI - DOI - PMC - PubMed
    1. Abramson J, Adler J, Dunger J, Evans R, Green T, Pritzel A, Ronneberger O, Willmore L, Ballard AJ, Bambrick J, et al. Accurate structure prediction of biomolecular interactions with AlphaFold 3. Nature. 2024; 630(8016):493–500. - PMC - PubMed
    1. Adalja A, Inglesby T. Broad-spectrum antiviral agents: a crucial pandemic tool. Expert review of Anti-infective Therapy. 2019; 17(7):467–470. - PMC - PubMed
    1. Adasme MF, Linnemann KL, Bolz SN, Kaiser F, Salentin S, Haupt VJ, Schroeder M. PLIP 2021: expanding the scope of the protein–ligand interaction profiler to DNA and RNA. Nucleic acids research. 2021; 49(W1):W530–W534. - PMC - PubMed
    1. Ahdritz G, Bouatta N, Floristean C, Kadyan S, Xia Q, Gerecke W, O’Donnell TJ, Berenberg D, Fisk I, Zanichelli N, Zhang B, Nowaczynski A, Wang B, Stepniewska-Dziubinska MM, Zhang S, Ojewole A, Guney ME, Biderman S, Watkins AM, Ra S, et al. OpenFold: Retraining AlphaFold2 yields new insights into its learning mechanisms and capacity for generalization. bioRxiv. 2022; https://www.biorxiv.org/content/10.1101/2022.11.20.517210, doi: 10.1101/2022.11.20.517210. - DOI - DOI - PMC - PubMed

Publication types

LinkOut - more resources