[Preprint]. 2025 Jul 31:2025.07.28.667277.
doi: 10.1101/2025.07.28.667277.

SkeletAge: Transcriptomics-based Aging Clock Identifies 26 New Targets in Skeletal Muscle Aging

Affiliations

SkeletAge: Transcriptomics-based Aging Clock Identifies 26 New Targets in Skeletal Muscle Aging

Muhammad Ali et al. bioRxiv. .

Abstract

Identifying the set of genes that regulate baseline healthy aging - aging that is not confounded by illness - is critical to understating aging biology. Machine learning-based age-estimators (such as epigenetic clocks) offer a robust method for capturing biomarkers that strongly correlate with age. In principle, we can use these estimators to find novel targets for aging research, which can then be used for developing drugs that can extend the healthspan. However, methylation-based clocks do not provide direct mechanistic insight into aging, limiting their utility for drug discovery. Here, we describe a method for building tissue-specific bulk RNA-seq-based age-estimators that can be used to identify the ageprint. The ageprint is a set of genes that drive baseline healthy aging in a tissue-specific, developmentally-linked fashion. Using our age estimator, SkeletAge, we narrowed down the ageprint of human skeletal muscles to 128 genes, of which 26 genes have never been studied in the context of aging or aging-associated phenotypes. The ageprint of skeletal muscles can be linked to known phenotypes of skeletal muscle aging and development, which further supports our hypothesis that the ageprint genes drive (healthy) aging along the growth-development-aging axis, which is separate from (biological) aging that takes place due to illness or stochastic damage. Lastly, we show that using our method, we can find druggable targets for aging research and use the ageprint to accurately assess the effect of therapeutic interventions, which can further accelerate the discovery of longevity-enhancing drugs.

Keywords: Ageprint; Biological Aging; Epigenetic Clock; Longevity Drug Discovery; Skeletal Muscle.


Conflict of interest statement

Conflict of interest The authors declare no competing interests.

Figures

Figure 1:
Figure 1:. Creating SkeletAge and identifying the ageprint.
We created SkeletAge by taking RNA-seq data of vastus lateralis samples on NCBI GEO and training an elastic net model to predict ages using this gene expression data. This allowed us to build a tissue-specific clock that can identify the ageprint. Using the ageprint, we identified 26 novel genetic targets for skeletal muscle aging that have never been reported in the context of aging research. Creating and testing SkeletAge took about 534 samples, for which accurate age labels had to be acquired from the corresponding authors. Therefore, to accelerate future aging research, we have compiled our dataset, including the metadata with accurate age labels and the raw counts for each sample (along with its GEO sample accession), into a repository called SkeletAge, which is accessible through this link: https://github.com/mali8308/SkeletAge/.
Figure 2:
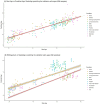
Figure 2:. Comparison between SkeletAge and RNAAgeCalc.
(A) shows the predicated ages measured by SkeletAge, whereas (B) shows the predicted ages (RNAAge) as measured by RNAAgeCalc. Each point on the scatterplot is a sample from the validation set (n = 298). The color of the points provides the health status or treatment groups. The red line is the line of best fit generated by SkeletAge, and the orange line is the line of best fit generated by RNAAgeCalc. Both models are predicting the ages for the validation set. The dotted line represents a 1:1 correlation between the chronological and the predicted ages. (C) shows the comparison of the mean absolute error (MAE) and Pearson correlation between RNAAgeCalc and SkeletAge when they are used on the validation set (n = 298). (D) is a comparison of the mean absolute error (MAE) and Pearson correlation between RNAAgeCalc and SkeletAge when they are used on the training set (n = 236).
Figure 3:
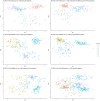
Figure 3:. Principal component analysis (PCA) plots generated using the ageprint genes.
The plot in (A) shows PCA ran on the training set (only healthy samples). (B) PCA ran on the training set using only the RedLong or the ProLong genes; both produce identical plots, but only one is shown here. (C) The PCA plot generated for the validation set (healthy samples and people suffering from different conditions) uses just the ageprint. (D) The plot generated for the validation set using the RedLong genes, and (E) is the PCA for the validation set using the ProLong genes. (F) shows a PCA plot for the entire Skeletome dataset using the ageprint genes. Each individual point is a sample. The samples are color-coded by the decade they were binned into.
Figure 4:
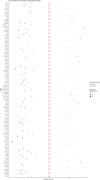
Figure 4:. Correlation of the individual genes that constitute ageprint with chronological age.
The genes in orange are RedLong genes, while the ones in purple are ProLong genes. A) shows the entire ageprint and the correlations of individual genes with chronological age. Surprisingly, all the genes negatively correlated with age are ProLong genes, while all the genes positively correlated with age are RedLong genes. B) shows the mean log fold changes in expression of the ProLong and RedLong genes across the different decades. Decade 3 (20 – 30 years) was chosen as the reference because muscle mass decreases once people are past their prime. C) is a heatmap of all the genes and their correlations. It shows that subsets of multiple genes’ expression correlate with each other, which further suggests that the genes are likely co-expressed and, potentially, even coregulated.
Figure 5:
Figure 5:. GO-terms enriched for the 26 novel targets identified using SkeletAge.
Overall, the terms can be categorized into two major processes: nucleotide and fatty acid metabolism. Both of these processes contribute to age-associated muscle loss, which further demonstrates that identifying the ageprint can shed light on the mechanisms of baseline, healthy aging across tissues.
Figure 6:
Figure 6:. A scatterplot of all the ageprint genes that are part of the druggable genome and their associated drugs.
The size of the points reflects the interaction score. PTGES has the most approved drugs associated with it, followed by NR2F2 and KLF5.
Figure 7:
Figure 7:. A violin plot showing the chronological age distribution across Skeletome.
Different datasets have different age distributions. Each dataset’s mean age is reflected in the intensity of the color. The curve’s width is proportional to the number of samples for that particular age range in a dataset.

Similar articles

References

    1. Ahn H., Kim D. W., Ko Y., Ha J., Shin Y. B., Lee J., Sung Y. S., & Kim K. W. (2021). Updated systematic review and meta-analysis on diagnostic issues and the prognostic impact of myosteatosis: A new paradigm beyond sarcopenia. Ageing Research Reviews, 70, 101398. 10.1016/j.arr.2021.101398 - DOI - PubMed
    1. Allen M. D., Dalton B. H., Gilmore K. J., McNeil C. J., Doherty T. J., Rice C. L., & Power G. A. (2021). Neuroprotective effects of exercise on the aging human neuromuscular system. Experimental Gerontology, 152, 111465. 10.1016/j.exger.2021.111465 - DOI - PubMed
    1. Avelar R. A., Ortega J. G., Tacutu R., Tyler E. J., Bennett D., Binetti P., Budovsky A., Chatsirisupachai K., Johnson E., Murray A., Shields S., Tejada-Martinez D., Thornton D., Fraifeld V. E., Bishop C. L., & de Magalhães J. P. (2020). A multidimensional systems biology analysis of cellular senescence in aging and disease. Genome Biology, 21(1), 91. 10.1186/s13059-020-01990-9 - DOI - PMC - PubMed
    1. Bell C. G., Lowe R., Adams P. D., Baccarelli A. A., Beck S., Bell J. T., Christensen B. C., Gladyshev V. N., Heijmans B. T., Horvath S., Ideker T., Issa J.-P. J., Kelsey K. T., Marioni R. E., Reik W., Relton C. L., Schalkwyk L. C., Teschendorff A. E., Wagner W., … Rakyan V. K. (2019). DNA methylation aging clocks: Challenges and recommendations. Genome Biology, 20(1), 249. 10.1186/s13059-019-1824-y - DOI - PMC - PubMed
    1. Belsky D. W., Caspi A., Houts R., Cohen H. J., Corcoran D. L., Danese A., Harrington H., Israel S., Levine M. E., Schaefer J. D., Sugden K., Williams B., Yashin A. I., Poulton R., & Moffitt T. E. (2015). Quantification of biological aging in young adults. Proceedings of the National Academy of Sciences of the United States of America, 112(30), E4104–4110. 10.1073/pnas.1506264112 - DOI - PMC - PubMed

Publication types

LinkOut - more resources