[Preprint]. 2025 Jul 30:2025.07.25.666841.
doi: 10.1101/2025.07.25.666841.

Metabolic and behavioral effects of neurofibromin result from differential recruitment of MAPK and mTOR signaling

Affiliations

Metabolic and behavioral effects of neurofibromin result from differential recruitment of MAPK and mTOR signaling

Valentina Botero et al. bioRxiv. .

Abstract

Neurofibromatosis type 1 results from mutations in the Neurofibromin 1 gene and its encoded neurofibromin protein. This condition produces multiple symptoms, including tumors, behavioral alterations, and metabolic changes. Molecularly, neurofibromin mutations affect Ras activity, influencing multiple downstream signaling pathways, including MAPK (Raf/MEK/ERK) and PI3K/Akt/mTOR signaling. This pleiotropy raises the question of which pathways could be targeted to treat the disease symptoms, and whether different phenotypes driven by neurofibromin mutations exhibit similar or diverging dependence on the signaling pathways downstream of Ras. To test this, we examined metabolic and behavioral alterations in the genetically tractable Drosophila neurofibromatosis type 1 model. In vivo genetic analysis revealed that behavioral effects of neurofibromin were mediated by MEK signaling, with no necessity for Akt. In contrast, metabolic effects of neurofibromin were mediated by coordinated actions of MEK/ERK and Akt/mTOR/S6K/4E-BP signaling. At the systemic level, neurofibromin dysregulated metabolism via molecular effects of Nf1 in interneurons and muscle. These changes were accompanied by altered muscle mitochondria morphology, with no concomitant changes in neuronal ultrastructure or neuronal mitochondria. Overall, this suggests that neurofibromin mutations affect multiple signaling cascades downstream of Ras, which differentially affect metabolic and behavioral neurofibromatosis type 1 phenotypes.


Conflict of interest statement

Competing interest statement The authors declare no competing interests.

Figures

Figure 1:
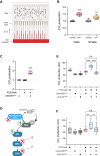
Figure 1:. Loss of Nf1 alters a behavioral phenotype, grooming, via effects on MEK, but not Akt.
(A) Diagram of the open field arena containing a fly, with a camera recording above. (B) Diagram showing Nf1-Ras signaling and the downstream Raf/MEK and PI3K/Akt signaling pathways. Green arrows represent the direction of signaling change following loss of Nf1. Red X marks show the molecules targeted for in vivo genetic analyses in panels C-D. (C) Quantification of grooming in flies harboring RNAi targeting Nf1,MEK, or both, along with controls. ***p < 0.001; n.s.: not significant (Šidák, n = 12–16). (D) Quantification of grooming in flies harboring RNAi targeting Nf1, Akt, or both. ***p < 0.001; n.s.: not significant (Šidák, n = 9–13). (E) Nf1 knockdown efficiency (log fold change normalized to Gal4/+ controls) in flies harboring RNAi targeting Nf1 or Nf1 + MEK, measured with quantitative PCR. n.s.: not significant (p = 0.42, Mann-Whitney, n = 5). (F) Representative western blot of total ERK and phosphorylated ERK in controls (nSyb-Gal4/+), and flies with pan-neuronal MEK knockdown, Nf1 knockdown, or Nf1 + MEK knockdown. Samples derived from the same experiment and processed in parallel, with β-tubulin as loading control. Representative blot shown from one of two experiments.
Figure 2:
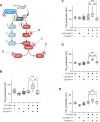
Figure 2:. Loss of Nf1 affects metabolism via a neuronal MEK/ERK-dependent mechanism.
(A) Diagram of the respirometry setup used to measure metabolic rate via CO2 production. (B) Normalized CO2 production in genomic nf1P1 mutant and wCS10 control males and females. **p < 0.05, ***p < 0.001 (Šidák, n = 6 males; n = 5 females). (C) Normalized CO2 production in flies with Nf1 knockdown in metabolism-regulating PCB-Gal4+ neurons compared to heterozygous Gal4/+ and UAS/+ controls. ***p < 0.001 re: both controls (Šidák, n = 5). (D) Diagram showing the MAPK arm of the Nf1/Ras signaling pathway. Green arrows represent the direction of signaling change following loss of Nf1. Red X marks show the molecules targeted for in vivo genetic analyses in panels E-F. (E) CO2 production (arbitrary units; AU) in flies harboring RNAi targeting Nf1, MEK, or both, along with controls. ***p < 0.001; n.s.: not significant (Šidák, n = 8). (F) CO2 production in flies harboring RNAi targeting Nf1, ERK, or both, along with controls. **p < 0.01, ***p < 0.001; n.s.: not significant (Šidák, n = 10–12).
Figure 3:
Figure 3:. Nf1 metabolic effects require mTOR in addition to MAPK signaling mechanisms.
(A) Diagram highlighting the mTOR arm of the Nf1/Ras signaling pathway. Green arrows represent the direction of signaling change following loss of Nf1. Red X marks show the molecules targeted for in vivo genetic analyses in panels B-E. (B) CO2 production (arbitrary units; AU) in flies bearing an RNAi targeting Nf1, Akt, or both, along with controls. *p < 0.05, **p < 0.01; n.s.: not significant (Dunn’s test, two-sided; n = 8–9). (C) CO2 production in flies bearing an RNAi targeting Nf1, Raptor, or both, along with controls. **p < 0.01, ***p < 0.001; n.s.: not significant (Šidák, n = 9–10). (D) CO2 production in flies bearing an RNAi targeting Nf1, S6K, or both, along with controls. ***p < 0.001; n.s.: not significant (Šidák, n 8–10). (E) CO2 production in flies bearing an RNAi targeting Nf1, 4E-BP, or both, along with controls. *p < 0.05, **p < 0.01; n.s.: not significant (Šidák, n = 10).
Figure 4:
Figure 4:. Manipulating cAMP and PKA enzyme expression did not mimic Nf1 effects on metabolic rate.
(A) Diagram showing Nf1 and its connection to cAMP generation and PKA activity. (B) CO2 production (arbitrary units; AU) in flies expressing RNAi targeting the Rut adenylyl cyclase or Nf1 in metabolism-regulating PCB-Gal4+ neurons. ***p < 0.001; n.s.: not significant (Dunn’s test, two-sided; n = 6). (C) CO2 production in flies expressing RNAi targeting the catalytic PKA-C1 subunit or Nf1 in PCB-Gal4+ neurons. ***p < 0.001; n.s.: not significant (Šidák, n = 5–6).
Figure 5:
Figure 5:. Behavioral effects of Nf1 rely on signaling downstream of mTOR.
(A) Diagram showing Nf1-Ras signaling and the downstream MAPK and mTOR signaling pathways. Green arrows represent the direction of signaling change following loss of Nf1. Red X marks show the molecules targeted for in vivo genetic analyses in panels B-C. (B) Quantification of grooming in flies harboring RNAi targeting Nf1, Raptor, or both. **p < 0.01, ***p < 0.001; n.s.: not significant (Dunn’s test, two-sided; n = 14–16). (C) Quantification of grooming in flies harboring RNAi targeting Nf1, S6K, or both. **p < 0.01, ***p < 0.001; n.s.: not significant (Šidák, n = 13–15).
Figure 6:
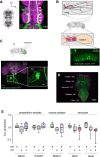
Figure 6:. Neurons and other tissues labeled by the PCB-Gal4 driver that potentially contribute to Nf1 metabolic effects
(A) Diagram and GFP image of the haltere tract passing through the ventral nerve cord (VNC). Left: diagram of the VNC. ProNm: prothoracic neuromeres, AMNp: accessory metathoracic neuromeres, MesoNm: mesothoracic neuro-meres, MetaNm: metathoracic neuropil, ANm: abdominal neuromere. Ant: anterior, lat: lateral. Right: immunostained VNC from a PCB-Gal4>UAS-mCD8::GFP fly counterstained with the neuronal marker bruchpilot (brp). (B) Diagram of campaniform sensillae (CS) in the wing and haltere, along with a GFP image showing that PCB-Gal4 labels CS in the haltere. (C) Diagram showing the location of the corpora cardiaca (CC) and oenocytes, along with an image of the PCB-Gal4 driver showing labeling in the brain and adjacent corpora cardiaca (CC). The tissue was counterstained with brp. Scale bars = 80 μm. (D) VNC with PCB-Gal4+ cells labeled with nuclear-localized GFP.nls. Cell bodies were counted and marked with dots. Each neuromere is outlined with dashed white lines the left hemisphere, and the number of labeled cells is noted on the left side. (E) Quantification of CO2 production when Nf1 was knocked down using drivers expressing in CS sensory neurons (DB331-Gal4 [p = 0.19, ANOVA, n = 7–9], R12C07-Gal4 [p = 0.26, ANOVA), CC (R64D11-Gal4 [p = 0.14, ANOVA, n = 5–6]), or oenocytes (OK72-Gal4 [p = 0.03, Kruskal-Wallis, n = 8–9], desat1-Gal4 [P < 0.001, Kruskal-Wallis, n = 7–8]).
Figure 7:
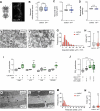
Figure 7:. Nf1 effects in muscle contribute to the metabolic alterations.
(A) Diagram of ventral nerve cord with neuronal mitochondria labeled with GFP. (B) Neuronal mitochondrial counts in control flies and nf1P1 mutants (unpaired t-test; n = 5–6). (C) Neuronal mitochondrial volume in control flies and nf1P1 mutants (unpaired t-test; n = 5–6). (D) Neuronal mitochondrial sphericity in control flies and nf1P1 mutants (unpaired t-test; n = 5–6). (E) Representative transmission electron micrograph of protocerebral neuropil from a control (wCS10) fly. (F) Representative transmission electron micrograph of protocerebral neuropil from an nf1P1 mutant fly. (G) Histogram of neuronal mitochondria size, quantified from electron micrographs from the Drosophila protocerebrum. Measurements are 2D cross-sectional area in μm2, graphed in 0.05 μm2 width bins (n = 227 [wCS10], 207 [nf1P1]). (H) Individual mitochondria area measurements, quantified from electron micrographs (same values plotted in panel G). **p < 0.01 (Mann-Whitney). (I) Knockdown of Nf1 with certain muscle-selective Gal4 drivers. *p < 0.05, ***p < 0.001 (Šidák, n = 4–10). (J) Knockdown of Nf1 with the muscle selective Gal4 driver Mef2-Gal4, with and without suppression of Gal4 expression in muscle via the MHC-Gal80 (Šidák, n = 9). (K) Representative transmission electron micrograph of flight muscle from a control (wCS10) fly. Junctions between adjacent mitochondria are highlighted with black arrowheads. (L) Representative transmission electron micrograph of flight muscle from an nf1P1 mutant fly. Spacing between adjacent mitochondria is highlighted with black arrowheads. (M) Histogram of muscle mitochondria size, quantified from electron micrographs from the Drosophila flight muscle. Measurements are 2D cross-sectional area in μm2, graphed in 0.5 μm2 width bins (n = 185 [wCS10] and 189 nf1P1]). (N) Individual mitochondria area measurements, quantified from electron micrographs (same values plotted in panel M). ***p < 0.001 (Mann-Whitney).
Figure 8:
Figure 8:
Summary diagram showing Nf1-Ras signaling and the downstream MAPK and mTOR signaling pathways. The signaling pathways implicated in behavioral and metabolic signaling are highlighted. Molecules that were tested with double RNAi in both assays are shown (Pi3K is included as an upstream signaling molecule in the mTOR pathway but was not tested).

References

    1. Hyman SL, Shores A, North KN. The nature and frequency of cognitive deficits in children with neurofibromatosis type 1. Neurology. 2005;65(7):1037–44. doi: 10.1212/01.wnl.0000179303.72345.ce. - DOI - PubMed
    1. Diggs-Andrews KA, Gutmann DH. Modeling cognitive dysfunction in neurofibromatosis-1. Trends in neurosciences. 2013;36(4):237–47. doi: 10.1016/j.tins.2012.12.002. - DOI - PMC - PubMed
    1. Constantino JN, Zhang Y, Holzhauer K, Sant S, Long K, Vallorani A, et al. Distribution and Within-Family Specificity of Quantitative Autistic Traits in Patients with Neurofibromatosis Type I. The Journal of pediatrics. 2015;167(3):621–6 e1. Epub 20150604. doi: 10.1016/j.jpeds.2015.04.075. - DOI - PMC - PubMed
    1. Eijk S, Mous SE, Dieleman GC, Dierckx B, Rietman AB, de Nijs PFA, et al. Autism Spectrum Disorder in an Unselected Cohort of Children with Neurofibromatosis Type 1 (NF1). Journal of autism and developmental disorders. 2018;48(7):2278–85. doi: 10.1007/s10803-018-3478-0. - DOI - PMC - PubMed
    1. Garg S, Plasschaert E, Descheemaeker MJ, Huson S, Borghgraef M, Vogels A, et al. Autism spectrum disorder profile in neurofibromatosis type I. Journal of autism and developmental disorders. 2015;45(6):1649–57. doi: 10.1007/s10803-014-2321-5. - DOI - PubMed

Publication types