[Preprint]. 2025 Jul 31:2025.07.30.667675.
doi: 10.1101/2025.07.30.667675.

Single Cell RNA Sequencing and Spatial Profiling Identify Mechanisms of Neonatal Brain Hemorrhage Development and Resolution

Affiliations

Single Cell RNA Sequencing and Spatial Profiling Identify Mechanisms of Neonatal Brain Hemorrhage Development and Resolution

Santiago A Forero et al. bioRxiv. .

Abstract

Precise control of cell-cell communication networks within brain neurovascular units (NVUs) promotes normal tissue physiology, and dysregulation of these networks can lead to pathologies including intracerebral hemorrhage (ICH). The cellular and molecular mechanisms underlying ICH development and subsequent tissue repair processes remain poorly understood. Here we employed quantitative single cell RNA sequencing coupled with spatial in situ gene expression profiling to characterize NVU signaling pathways associated with ICH in neonatal mouse brain tissue. The initial stages of ICH pathogenesis are characterized by downregulation of extracellular matrix (ECM)-associated signaling factors (Adamtsl2, Htra3, and Lama4) that functionally connect to canonical TGFβ activation and signaling in vascular endothelial cells. Conversely, the progressive resolution of ICH involves upregulation of neuroinflammatory signaling networks (Gas6 and Axl) alongside activation of iron metabolism pathway components (Hmox1, Cp, and Slc40a1) in astrocytes and microglial cells. Integrated computational modeling identifies additional ligand-receptor signaling networks between perivascular glial cells and endothelial cells during both ICH pathogenesis and resolution. Collectively, these findings illuminate the molecular signaling networks that promote NVU maturation and provide novel mechanistic insights into the pathways controlling ICH pathogenesis and repair.


Conflict of interest statement

COI Disclosure: We have no conflicts of interest to disclose.

Figures

Figure 1.
Figure 1.. Strategy to analyze mechanisms of ICH pathogenesis and repair by quantitative single cell RNA sequencing.
(A); H&E-stained images of sagittal sections through the cerebral cortices of WT (Nestin-Cre;Itgb8 +/+) and KO (Nestin-Cre;Itgb8flox/flox) mice at P0 (upper panels), P5 (middle panels), and P10 (lower panels). Note that KO mice display obvious cortical hemorrhage at P0 and P5 (arrows), which is largely resolved by P10. Scale bars, 50 μm. (B); Immunofluorescent analysis of WT (left panels) and KO (right panels) cerebral cortices at P5 using anti-CD31 antibodies to label vascular endothelial cells (red) in combination with anti-GFAP (green) to label astrocytes (top panels) or anti-Iba1 (green) to label microglia (bottom panels). Note the increase in GFAP+ and Iba1+ reactive astrocytes and microglial cells in the hemorrhagic cortices (arrows). Scale bars, 100 μm. (C); Experimental workflow for scRNAseq experiments to identify genes and pathways linked to hemorrhage development and repair in the neonatal cerebral cortex.
Figure 2.
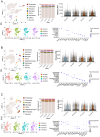
Figure 2.. Dimensionality reduction and cluster annotation of scRNAseq data from control and ICH samples.
(A); Uniform manifold approximation and projection (UMAP) visualization of integrated WT and KO cells in P0 sample clusters (top left) and UMAPs split by samples (bottom left). Shown are bar plots of cell-type proportions (top middle), violin plots of number of nFeatures (top right), and a dot plot of marker genes used for cluster annotation (bottom right). (B); UMAP visualization of integrated P5 control and ICH sample clusters (top left) and UMAPs split by samples (bottom left). Bar plots of cell-type proportions per P5 sample are shown (top middle). Violin plots of number of (top right) and dot plot of marker genes used for cluster annotation (bottom right). (C); UMAP visualization of integrated P10 sample clusters (top left) and UMAPs split by samples (bottom left). Bar plots of cell-type proportions (top middle), violin plots of number of nFeatures (top right), and a dot plot of marker genes used for cluster annotation are shown (bottom right).
Figure 3.
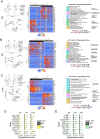
Figure 3.. Differential gene expression and GO enrichment analysis of vascular endothelial cells from hemorrhagic cerebral cortices.
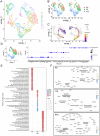
(A); Condition-split UMAP highlighting endothelial clusters in integrated P0 scRNAseq samples (top left). Volcano plot of significant DEGs in P0 endothelial cells, KO vs. WT (bottom left). Blue lines on volcano plot mark −1 and +1 avg_log2FC cutoff of statistical significance (x axis). Red line on volcano plot marks adjusted p-value significance cutoff (0.05). Y axis is −log10 of adjusted p value. Heatmap showing log-normalized and scaled expression of top 20 DEGs upregulated in P0 ICH samples (up in KO) and downregulated in ICH samples (up in WT). TreePlot of top 15 gene ontology (GO) enrichment pathways overexpressed in endothelial cells at P0 (right). (B); Condition-split UMAP highlighting endothelial clusters in integrated P5 scRNAseq samples (top left). Volcano plot of significant DEGs in P5 endothelial cells, KO vs. WT (bottom left). Blue lines on volcano plot mark −1 and +1 avg_log2FC cutoff of statistical significance (x axis). Red line on volcano plot marks adjusted p-value significance cutoff (0.05). Y axis is −log10 of adjusted p value. Heatmap showing log-normalized and scaled expression of top 20 DEGs upregulated in P5 ICH samples (up in KO) and downregulated in endothelial cells from ICH samples (up in WT). TreePlot of top 15 gene ontology (GO) enrichment pathways overexpressed in endothelial cells at P5 (right). (C); Condition-split UMAP highlighting endothelial clusters in integrated P10 scRNAseq samples (top left). Volcano plot of significantly differentially expressed genes (DEGs) in P10 endothelial cells, KO vs. WT (bottom left). Blue lines on volcano plot mark −1 and +1 avg_log2FC cutoff of statistical significance (x axis). Red line on volcano plot marks adjusted p-value significance cutoff (0.05). Y axis is −log10 of adjusted p value. Heatmap showing log-normalized and scaled expression of top 20 DEGs upregulated in P10 ICH samples (up in KO) and downregulated in endothelial cells from ICH samples (up in WT). TreePlot of top 15 gene ontology (GO) enrichment pathways overexpressed in endothelial cells from ICH samples at P10 (right). (D); Ridgeplot of DEGs downregulated in endothelial cells from KO brains at the three neonatal ages. (E); Ridgeplot of DEGs upregulated in endothelial cells from KO brains at P0, P5 and P10.
Figure 4.
Figure 4.. Differential gene expression and GO enrichment analysis of microglia from ICH samples.
(A); Condition-split UMAP highlighting microglia clusters in integrated P0 scRNAseq samples (top left). Volcano plot of significantly differentially expressed genes (DEGs) in P0 microglia, KO vs. WT (bottom left). Blue lines on volcano plot mark −1 and +1 avg_log2FC cutoff of statistical significance (x axis). Red line on volcano plot marks adjusted p-value significance cutoff (0.05). Y axis is −log10 of adjusted p value. Heatmap showing log-normalized and scaled expression of top 20 DEGs upregulated in microglia from P0 ICH samples (up in KO) and downregulated in ICH samples (up in WT). TreePlot of top 15 gene ontology (GO) enrichment pathways overexpressed in KO microglia at P0 (right). (B); Condition-split UMAP highlighting microglia clusters in integrated P5 scRNAseq samples (top left). Volcano plot of significantly differentially expressed genes (DEGs) in P5 microglia, KO vs. WT (bottom left). Blue lines on volcano plot mark −1 and +1 avg_log2FC cutoff of statistical significance (x axis). Red line on volcano plot marks adjusted p-value significance cutoff (0.05). Y axis is −log10 of adjusted p value. Heatmap showing log-normalized and scaled expression of top 20 DEGs upregulated in microglia from P5 ICH samples (up in KO) and downregulated in ICH samples (up in WT). TreePlot of top 15 gene ontology (GO) enrichment pathways overexpressed in microglia in ICH samples at P5 (right). (C); Condition-split UMAP highlighting microglia in integrated P10 scRNAseq samples (top left). Volcano plot of significantly differentially expressed genes (DEGs) in P10 endothelial cells, KO vs. WT (bottom left). Blue lines on volcano plot mark −1 and +1 avg_log2FC cutoff of statistical significance (x axis). Red line on volcano plot marks adjusted p-value significance cutoff (0.05). Y axis is −log10 of adjusted p value. Heatmap showing log-normalized and scaled expression of top 20 DEGs upregulated in P10 ICH samples (up in KO) and downregulated in microglia from ICH samples (up in WT). TreePlot of top 15 gene ontology (GO) enrichment pathways overexpressed in microglia from ICH samples P10 (right). (D); Ridgeplot of differently expressed genes downregulated in brain microglia in KO mice at the three neonatal ages (P0, P5, and P10). (E); Ridgeplot of shared differently expressed genes upregulated in KO microglia at P0, P5 and P10.
Figure 5.
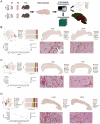
Figure 5.. In situ spatial analysis of DEGs in control and ICH samples.
(A); Experimental workflow for Xenium-based analysis of gene expression. One mouse was used per age, for each condition. (B); UMAP of P0 integrated WT and KO samples (left). Bar plots of P0 cell type proportion per condition (middle top). Dot plot of P0 marker genes used for cluster annotation (bottom left). Spatial location of cells in WT and KO P0 mouse cortex (top right) and H&E images of control and hemorrhagic brains with pseudocolored cells (bottom left). (C); UMAP of P5 integrated ICH and control samples (left). Bar plot of P5 cell type proportion per condition (middle top). Dot plot of P5 marker genes used for cluster annotation (top right). Spatial location of cells in WT and KO P5 mouse cortex (top right) and H&E images of control and ICH samples with pseudocolored cells (bottom left). (D); UMAP of P10 integrated control and hemorrhagic brain samples (left). Bar plot of P10 cell type proportions per condition (middle top). Dot plot of P10 marker genes used for cluster annotation (top right). Spatial location of cells in WT and KO P10 mouse cortex (top right) and H&E images of samples with pseudocolored cells (bottom left).
Figure 6.
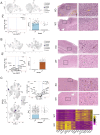
Figure 6.. Spatial analysis of endothelial cell DEGs.
(A); Representative image of spatial organization of cells around blood vessels in P5 control and ICH samples. (B); P0 integrated split UMAP highlighting endothelial clusters (left). Volcano plot of P0 DEGs in endothelial cells from control and ICH samples (top middle). Boxplots of Cav1 expression in P0 endothelial cells (bottom middle). Representative spatial images from control and hemorrhagic cortices showing H&E with overlayed endothelial cells (red) at 500 and 100 μm. Cav1 transcript counts are shown within cells (yellow). (C); P5 integrated split UMAP highlighting endothelial clusters (left). Volcano plot of P5 DEGs for endothelial cells from WT and KO brain samples (top middle). Boxplots of Htra3 expression in P5 endothelial cells (bottom middle). Spatial representative images from P0 control and ICH cortex showing H&E with overlayed endothelial cells (red) at 500 and 100 μm. Htra3 transcript counts are shown within cells (green). (D); P10 integrated split UMAP highlighting endothelial clusters (left). Volcano plot of P10 DEGs for endothelial cells from WT and KO brains (top middle). Boxplots of Adamtsl2 expression in P0 endothelial cells (bottom middle). Spatial representative images from P10 WT and KO cortex showing H&E with overlayed endothelial cells (red) at 500 and 100 μm. Adamtsl2 transcript counts are shown within cells (orange).
Figure 7.
Figure 7.. Spatial analysis of microglial cell DEGs.
(A); P0 integrated split UMAP highlighting microglia clusters (top left). Volcano plot of P0 DEGs for microglia in WT and KO brains (bottom left). Boxplots of Hmox1 expression in P0 microglia (bottom middle). Spatial representative images (right) from P0 WT and KO cortex showing H&E overlayed microglia (red) at 500 and 100 μm. Hmox1 transcript counts are shown within cells (yellow). (B); P5 integrated split UMAP highlighting microglia clusters (left). Volcano plot of P5 DEGs in microglia from WT and KO brain samples (top middle). Boxplots of Siglech expression in P5 microglia (bottom middle). Spatial representative images (right) from P5 WT and KO cortex showing H&E and overlayed microglia (red) at 500 and 100 μm. Siglech transcript counts from differential gene expression analysis are shown within cells (green). (C); P10 integrated split UMAP highlighting microglia clusters (left). Volcano plot of P10 DEGs in microglia from WT and KO brains (middle top). Boxplots of Axl expression in P10 microglia (middle bottom). Spatial representative images (top right) from P0 WT and KO cortex showing H&E with overlayed microglia (red) at 500 and 100 μm. Axl transcript counts are shown within cells (orange). Single cell heatmap of scaled transcripts highlighting top DEGs in the two P10 WT and KO microglial clusters (bottom right).
Figure 8.
Figure 8.. Pseudotime trajectory inference analysis, differential gene expression, and gene ontology enrichment in vascular endothelial cells.
(A); UMAP of endothelial cells from all scRNAseq samples. (B); UMAP split by condition and clustered according to neonatal age (P0, P5 and P10). (C); Condition-split UMAP showing cells within pseudotime trajectory highlighted, cell colors correspond to time along trajectory. Principal curves are shown as black line along trajectory. Arrows show pseudotime trajectory directionality. (D); Subset UMAP showing only cells within pseudotime trajectory (colored cells in C), clustered by sample age (left). Dot plot of top 20 DEGs for each age from cells within pseudotime trajectory (right). (E); Dot plot of GO enrichment results showing top 15 enriched pathways per neonatal age. (F); Key pathways of interest depicted as a category network plot (cnetPlot) showing GO terms and related genes for each neonatal age.
Figure 9.
Figure 9.. Pseudotime trajectory inference analysis, differential gene expression, and gene ontology enrichment in microglial cells.
(A); UMAP of microglial cells from all scRNAseq samples. (B); UMAP split by condition and clustered according to neonatal age of sample. (C); Condition-split UMAP showing cells within pseudotime trajectory highlighted, cell colors correspond to time along trajectory. Principal curves are shown as black line along trajectory. Arrows show pseudotime trajectory directionality. (D); Subset UMAP showing only cells within pseudotime trajectory (colored cells in C), clustered by sample age (left). Dot plot of top 20 DEGs for each neonatal age from cells within pseudotime trajectory (right). (E); Dot plot of GO enrichment results showing top 15 enriched pathways per developmental age. (F); Key pathways of interest depicted as a category network plot (cnetPlot) showing GO terms and related genes for each neonatal age.
Figure 10.
Figure 10.. CellChat-based identification of cell-cell communication networks.
(A); Chord plot showing direction and interaction weight indicated by arrows/thickness representing aggregated cell-cell communication probability computed using the CellChat probabilistic model. (B); Heatmap of communication probabilities between sender and receiver cell types (x-axis) mediated by ligand–receptor pathways (y-axis) for P0, P5, and P10 neonatal ages. Communication probabilities were calculated based on the presence of ligand-receptor factors within cells from the Xenium spatial data. Rectangle color corresponds to mean probability score. (C); Heatmap showing examples of communication probabilities across ligand-receptor pairs within the LAMA4 signaling pathway. Sender–receiver cell type interactions (x-axis) for control and ICH samples are shown at the three neonatal ages. Rectangle color corresponds to mean probability score. (D); Heatmap of cell-cell communication probabilities between sender and receiver cell types (x-axis) mediated by ligand–receptor pairs involved in GAS signaling pathways (y-axis) for P10 control and ICH samples. Rectangle color corresponds to mean probability score.

Similar articles

References

    1. Garcia-Gallardo A., and Campbell M. (2025). Understanding the Blood-Brain Barrier: From Physiology to Pathology. Adv Exp Med Biol 1477, 1–33. 10.1007/978-3-031-89525-8_1. - DOI - PubMed
    1. Langen U.H., Ayloo S., and Gu C. (2019). Development and Cell Biology of the Blood-Brain Barrier. Annu Rev Cell Dev Biol 35, 591–613. 10.1146/annurev-cellbio-100617-062608. - DOI - PMC - PubMed
    1. Ben-Zvi A., and Liebner S. (2022). Developmental regulation of barrier- and non-barrier blood vessels in the CNS. J Intern Med 292, 31–46. 10.1111/joim.13263. - DOI - PubMed
    1. Paredes I., Himmels P., and Ruiz de Almodovar C. (2018). Neurovascular Communication during CNS Development. Dev Cell 45, 10–32. 10.1016/j.devcel.2018.01.023. - DOI - PubMed
    1. Tiedt S., Buchan A.M., Dichgans M., Lizasoain I., Moro M.A., and Lo E.H. (2022). The neurovascular unit and systemic biology in stroke - implications for translation and treatment. Nat Rev Neurol 18, 597–612. 10.1038/s41582-022-00703-z. - DOI - PubMed

Publication types