[Preprint]. 2025 Aug 1:2025.07.31.667987.
doi: 10.1101/2025.07.31.667987.

Concerted actions of distinct serotonin neurons orchestrate female pup care behavior

Affiliations

Concerted actions of distinct serotonin neurons orchestrate female pup care behavior

Shuyun Alina Xiao et al. bioRxiv. .

Abstract

In many mammalian species, female behavior towards infant conspecifics changes across reproductive stages. Sexually naïve females interact minimally or aggressively with infants, whereas the same animals exhibit extensive care behavior, even towards unrelated infants, after parturition1-6. Here, we discovered that two distinct sets of serotonin neurons collectively mediate this dramatic transition in maternal behavior-serotonin neurons projecting to the medial preoptic area (mPOA) promote pup care in mothers, whereas those projecting to the bed nucleus of the stria terminalis (BNST) suppress pup interaction in virgin female mice. Disrupting serotonin synthesis in either of these subpopulations or stimulating either subpopulation is sufficient to toggle pup-directed behavior between that displayed by virgin females and that of lactating mothers. In virgin female mice, the first pup interaction triggers an increase in serotonin release in BNST but a decrease in mPOA. In mothers, serotonin activity becomes greatly elevated in mPOA during pup interactions. Acute interruption of serotonin signaling locally in either mPOA or BNST disrupts the stage-dependent switch in pup care. Together, these results highlight how functionally distinct serotonin subpopulations orchestrate social behaviors appropriate for a given reproductive state, and suggest a circuit logic for how a neuromodulator coordinates adaptive behavioral changes across life stages.


Conflict of interest statement

Competing interests: The authors declare that they have no competing interests.

Figures

Extended Data Fig. 1 |
Extended Data Fig. 1 |. Additional characterization of serotonin neuron activity during social interactions.
a, Left, representative ΔF/F traces of DR serotonin neurons during interactions with a juvenile female intruder; Gray dash lines in these and all subsequent panels indicate ΔF/F = 0. Right, quantification of mean peak ΔF/F before and during juvenile female interactions (n = 5 females; paired t-test). Female DR serotonin neurons showed significant increase in activity during interactions with a juvenile female. b, Top, representative ΔF/F traces of DR serotonin neurons during interactions with a male intruder when the recorded female was in non-estrus. Bottom, representative ΔF/F traces of DR serotonin neurons during interactions with a male intruder when the recorded female was in estrus. c, Representative ΔF/F traces of DR serotonin neurons in females during mating and when the male ejaculated. Serotonin neurons in female mice showed increase in activity following male ejaculation (single ejaculation trial recorded from n = 3 females in DR, and n = 2 females in MR, see panel h), consistent with a previous study reporting that female DR serotonin neurons are activated by ejaculation. d, Quantification of mean peak ΔF/F of DR serotonin neurons before and during male mounting attempts. Hollow circles indicate when the female rejected mounting during non-estrus, and solid circles indicate when the female mated with the male during estrus (n = 5 females; note that 2 out of 5 DR females did not mate during estrus recordings, mixed effects analysis performed on the three females recorded during both estrus cycles followed by Šídák’s multiple comparisons test). No significant change in female serotonin neuron activity was observed at the population level during sexual interactions with male across estrus cycle. e, Quantification of mean peak ΔF/F before and during pup retrieval in mothers (n = 5 females; Wilcoxon matched-pairs signed rank test). f–j, Same as a–e, but in MR (n = 5 for all except n = 4 for panel j; one mother did not retrieve). k, Left, PETHs of ΔF/F of a representative naïve virgin female during pup interactions recorded in the DR. Right, group peak ΔF/F during the first three pup interactions (one-way ANOVA). The first pup interaction triggered significantly higher activity in DR serotonin neurons than following interactions. Purple trace, the first interaction. Green trace, mean response of all interactions ± s.e.m. l, m, Same as (k) but for juvenile female (l) or dummy pup (m) interactions. n, Left, mean interaction duration with real pups and dummy pups in DR-recorded naïve virgin females. Right, interaction-normalized activity of DR serotonin neurons during interactions with real pups or dummy pups in naïve virgin females (paired t-test). o–r, Same as k–n, but in MR (n = 5). See Source Data for detailed statistics.
Extended Data Fig. 2 |
Extended Data Fig. 2 |. Validation of TRAP in capturing pup-activated serotonin neurons.
a, Schematic of viral-genetic strategy for validating TRAP in capturing pup-activated serotonin neurons. b, Representative histology showing the overlap of TRAP-induced tdTomato expression (magenta), Fos (yellow) and Tph2 staining (cyan) from a naïve virgin female subjected to pup interaction both during TRAP and before Fos staining (left) and a naïve virgin female subjected to home cage interaction during TRAP and pup interaction before Fos staining (right). Arrows point towards example tdTomato+ cells that are Tph2+. Scale bars, 100 μm (50 μm in enlarged view of neurons outlined in the boxed areas). c, The efficiency and specificity of TRAP in capturing pup-activated serotonin neurons (n = 4). Efficiency = #triple+ / #Fos+ & Tph2+. Specificity = #triple+ / #tdTomato+ & Tph2+. These data indicate that the majority of pup-TRAPed neurons are also activated by pup interaction measured by Fos immunostaining, and vice versa. d, Percentage of TRAP/Fos overlap in Tph2+ neurons (n = 3 HC-TRAP and pup-Fos, 4 pup-TRAP and pup-Fos, 3 male-TRAP and pup-Fos; one-way ANOVA), calculated as #triple+ / #Fos+ & Tph2+. These data indicate that pup-TRAP can preferentially capture serotonin neurons that are activated by pup interactions. e, The number of labeled neurons is significantly higher in the pup-TRAP than the HC-TRAP conditions from Fig. 2 (n = 5, 5; two-tailed t-test). f, Allen abbreviations and full names of all brain regions that exhibit significantly higher raw axon density labeling in the pup-TRAP condition than the HC-TRAP condition, at 3% false discovery rate. Brain regions that are also among the top 30 regions that differ between the two conditions in normalized labeling density are highlighted in red. Regions are listed in alphabetical order. Note that in the current paper, Allen abbreviation BST is denoted as BNST, and MPO and MPN are referred to collectively as mPOA. See Source Data for detailed statistics.
Extended Data Fig. 3 |
Extended Data Fig. 3 |. 5HTmPOA and 5HTBNST show different cell body location preference in the raphe and little overlap.
a, Schematic of viral-genetic strategy for retrogradely labeling 5HTmPOA and 5HTBNST neurons. b, Preference score of 5HTmPOA and 5HTBNST cell body location in the DR and MR (n = 7, 5; two-tailed t-test), calculated as (#DR – #MR) / (#DR + #MR). c, d, Representative histology showing the distribution of 5HTmPOA (c) and 5HTBNST (d) cell body location in the DR (top) and MR (bottom). Dotted gray lines outline the edge of the aqueduct. Scale bars, 200 μm. e, Schematic of viral-genetic strategy for dual labeling of 5HTmPOA and 5HTBNST neurons in the same brain. f, g, Representative histology showing the overlap of 5HTmPOA (magenta) and 5HTBNST (cyan) with Tph2 staining (blue) (f), and the overlap when both viruses were sequentially injected into mPOA as a control (g). Scale bars, 100 μm (20 μm in enlarged view of neurons outlined in the boxed areas). h, Percentage overlap between 5HTmPOA and 5HTBNST neurons is significantly lower than when the two retrograde Cre-dependent AAVs were injected into the same site (n = 3, 4; two-tailed t-test). See Source Data for detailed statistics.
Extended Data Fig. 4 |
Extended Data Fig. 4 |. Additional characterization of 5HTmPOA-cKO and 5HTBNST-cKO histology and phenotypes.
a, Representative serotonin staining in mPOA and BNST after AAVretro-Cre injection into either mPOA or BNST of WT or Tph2flox/flox mice (a, left). Normalized fluorescence of serotonin staining in mPOA and BNST in control (black), 5HTmPOA-cKO (pink) and 5HTBNST-cKO (blue) mice. Two-way ANOVA followed by Šídák’s multiple comparisons test (n = 3, 3, 3). Scale bars, 50 μm. b, Pearson correlation between the number of Cre+ and AADC+ but Tph2 cells (that is, Tph2 knockout serotonin neurons) and the total time spent in pup contact in 5HTmPOA-cKO mothers (left) or 5HTBNST-cKO naïve virgins (right). c, Time spent sniffing or grooming pups across reproductive stages in 5HTmPOA-cKO (n = 8, 11; one control animal died during labor; mixed effects analysis followed by Šídák’s multiple comparisons test). d, e, Rate of retrieval (left) and time spent nesting around pups (right) by control and 5HTmPOA-cKO mice as naïve virgins (d) and mothers (e). f–h, Same as c–e except for 5HTBNST-cKO. i, j, Time spent sniffing/grooming pups by 5HTmPOA-cKO females (top) and 5HTBNST-cKO females (bottom) as virgins (i) and mothers (j). 1st through 4th denote the first through last five-minute-long quarters within the single behavioral session. Pup interaction by 5HTmPOA-cKO mothers was consistently low throughout the behavioral session (j), whereas that by 5HTBNST-cKO virgins was high since the start of the session and remained so during most of the session (i). k, Litter size did not differ significantly between 5HTmPOA-cKO (top) or 5HTBNST-cKO females (bottom) and their respective controls. l, The average body size (from snout to tail base, indicated the arrows) at weaning age (postnatal day 21, P21) is significantly lower among pups raised by 5HTmPOA-cKO mothers (top), but not those raised by 5HTBNST-cKO mothers (bottom). m, Two example litters weaned from a 5HTmPOA-cKO mother (left) and an mPOA-injected control mother (right). n, The average body size of pups at wean date shows a significant positive correlation with the time spent in contact with pups in the recorded behavior sessions (control, gray; 5HTmPOA-cKO, pink; 5HTBNST-cKO, blue). o, p, The amount of social sniffing initiated by the juvenile female intruder (left) and the amount of aggression towards the juvenile female intruder do not differ significantly between 5HTmPOA-cKO females and their controls (o) or between 5HTBNST-cKO females and their controls (p). See Source Data for detailed statistics.
Extended Data Fig. 5 |
Extended Data Fig. 5 |. Validation of SOUL activation and additional behavioral characterizations.
a, Representative histology showing the overlap of SOUL (red), Fos (green) and Tph2 (gray) without (left) and with (right) blue light stimulation. Scale bar, 20 μm. b, Percentage of Fos+ cells out of all SOUL+ serotonin neurons is significantly higher following blue light stimulation (n = 3, 4; two-tailed t test). c, d, Time spent sniffing/grooming pups during SOUL off (I) and SOUL on (A) by the mPOA-injected (c) and BNST-injected (d) mice. Statistics shown are from the same analyses as Fig. 4e–f, j–k. e, Time spent in contact with pups during SOUL off (I) and SOUL on (A) by the mPOA-injected (e1) and BNST-injected (e2) mice [mPOA: n = 5 WT, 9 Sert-Flp+;Tph2+/+, 5 Sert-Flp+;Tph2fl/fl; BNST: n = 7 WT (one died during labor), 8 Sert-Flp+;Tph2+/+, 7 Sert-Flp+;Tph2fl/fl; three-way repeated measures (RM) ANOVA or mixed-effects analysis followed by Tukey multiple comparisons test]. f, Session-by-session duration of time spent sniffing/grooming pups in the mPOA-injected virgins (top) and BNST-injected mothers (bottom). g, Schematic showing experimental design for the conditioned place preference test. h, Activation of 5HTmPOA in mice with normal Tph2 led to a significant increase in preference for the chamber that received blue light stimulation (n = 4 WT, 9 Sert-Flp+;Tph2+/+, 5 Sert-Flp+;Tph2fl/fl; two-way RM ANOVA followed by Tukey multiple comparisons test). The preference index was calculated as (time in chamber paired with blue stim – time in chamber paired with orange stim) / (total time in either chamber). i, Activation of 5HTBNST has no significant effect in conditioned place preference (n = 5 WT, 8 Sert-Flp+;Tph2+/+, 7 Sert-Flp+;Tph2fl/fl; two-way RM ANOVA followed by Tukey multiple comparisons test). See Source Data for detailed statistics.
Extended Data Fig. 6 |
Extended Data Fig. 6 |. Additional characterization and controls for serotonin sensor recordings.
a, Quantifications of area under curve (AUC) normalized to interaction duration before and during all pup interactions, including the first and subsequent interactions ranging from 9–20 trials total, in naïve virgins recorded in mPOA (left, n = 9) and BNST (right, n = 9). b,c, Peri-event time histograms (PETHs) of ΔF/F of g5-HT3.0 signal in mPOA aligned to the onset of females sniffing object (b) and sniffing/grooming juvenile female intruder (c). Each panel shows both group g5-HT3.0 signal in naïve virgins (black trace) and the same females as mothers (pink trace) (n = 9 virgins and mothers except in c, n = 5 for mother trace; the other 4 mothers attacked the juvenile female and were excluded as the behavior was not comparable to their non-aggressive interactions with juvenile female intruder as virgins). d, e, Same as b, c except for g5-HT3.0 imaging in BNST (n = 6 virgins and mothers except in e, n = 3 for mothers that had non-aggressive interactions with the juvenile female). f, Schematic showing the experimental setup and timeline for recording mutant serotonin sensor (g5-HT3.0mut) in mPOA. g, Left, group g5-HT3.0mut signal in mPOA during the first pup interaction in naïve virgins. Right, quantifications of area under curve (AUC) normalized to interaction duration before and after the first pup interaction in naïve virgins. (n = 5 females; Wilcoxon matched-pairs signed rank test) h, PETHs of ΔF/F of g5-HT3.0mut signal in mPOA aligned to the onset of females sniffing/grooming pups as virgins (left) or mothers (right). i, Within-animal comparisons of mean peak ΔF/F of g5HT3.0mut signal in mPOA between virgins (V) and the same animals as mothers (M) during pup interaction (n = 5 females; paired t-test). j–m, Same as f–i except for g5-HT3.0mut imaging in BNST (n = 5). See Source Data for detailed statistics.
Extended Data Fig. 7 |
Extended Data Fig. 7 |. Additional behavioral characterization of local 2C– infusion.
a, Time spent nesting around pups (left) and the rate of retrieval (right) did not differ significantly between virgin females that received 2C– in mPOA and controls (n = 7, 7). b, Females with 2C– infused in mPOA spent significantly less time nesting around pups (left) and displayed significantly lower rate of retrieval in comparison to control mice as mothers (right) (n = 6, 7 for mothers). c, Females (virgins) with 2C– infused in mPOA spent significantly less time sniffing/grooming juvenile female intruder than control mice (left). The time sniffed by the intruder does not differ between the two groups (right) (n = 6, 7, one control female died during labor). d, Object interaction does not differ significantly between virgin females that received 2C– in mPOA and controls. e–h, Same analyses as a–d, but for BNST instead of mPOA. 2C– infusion did not differ from controls except that it significantly increased time spent sniffing/grooming juvenile female intruder (g) (n = 6, 7 for virgins and n = 6, 6 for mothers). See Source Data for detailed statistics.
Extended Data Fig. 8 |
Extended Data Fig. 8 |. Summary of behavioral data for different loss- and gain-of-function manipulations of 5HTmPOA and 5HTBNST.
Left, experiment schematic. Black circles, targeted projection-specific serotonin neurons; gray circles, serotonin neurons that do not project to the target region of interest; smaller gray or black dots represent serotonin; gray triangles, other neurotransmitters or neuropeptides. Main table, summary of results. Pink, manipulations targeting 5HTmPOA; blue, manipulations targeting 5HTBNST; upward arrows, significantly more interaction than respective controls; downward arrows, significantly less interaction; en dash, no significant difference from controls. cKO, conditional knockout; Htr, serotonin receptor. In summary, most experiments show consistent results between the two loss-of-function (LOF) experiments—Tph2 cKO and Htr2C– infusion—and opposite effects for between loss- and gain-of-function (GOF) manipulations. We note the following two exceptions: (I) 2C– infusion in mPOA but not 5HTmPOA-cKO led to lower amount of pup contact time in virgins, and (II) 2C– infusion in mPOA but not 5HTmPOA-cKO inhibited pup retrieval in mothers (each marked with an asterisk). These discrepancies may be due to (1) functional heterogeneity across axon collaterals in 5HTmPOA and/or among serotonin receptors in mPOA; (2) the difference between long-term, gradual disruption of serotonin synthesis versus acute reduction of serotonin signaling; and/or (3) local infusion of 2C– in mPOA having a more complete coverage in reducing 5-HT activity in mPOA than retrograde Cre injection used for 5HTmPOA-cKO. One or a combination of these possibilities—reduced effect of potential functional heterogeneity (e.g., perturbing another target of 5HTmPOA may have an opposite effect as perturbing mPOA), the lack of compensation, and higher efficiency— may have led 2C– infusion in mPOA to cause a more dramatic phenotype than 5HTmPOA-cKO in both virgins and mothers.
Fig. 1 |
Fig. 1 |. Serotonin neurons are active during social interactions.
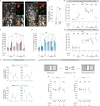
a, Schematic of fiber photometry recording of serotonin neurons in DR and MR. All neural signals were recorded at two wavelengths: 490 nm that captures Ca2+-dependent fluorescence and 405 nm, an isosbestic control that captures Ca2+-independent background noise and motion artifacts. b, Percentage of GCaMP6f cells co-expressing Tph2 (left) and percentage of Tph2 cells co-expressing GCaMP6f in the raphe (right). n = 3 mice. c, Representative confocal images showing the overlap of GCaMP6f (green) and Tph2 (magenta) in Sert-Cre;Ai148 mice. Arrowheads point to example double-labeled cells. Scale bars, 100 μm. d, Experimental timeline for the six behaviors during which photometry recording was performed in each female. Black arrows highlight transitions in female reproductive states. e, Representative histology showing GCaMP6f expression (green) and fiber track (dotted white line) in DR, coronal view. Scale bar, 200 μm. f–h, Peri-event time histograms (PETHs) of ΔF/F (relative change in the 490-nm fluorescence signal after removing baseline fluctuations estimated from the 405-nm control signal) of DR serotonin neurons aligned to the onset of females sniffing/grooming a juvenile female (f), sniffing/grooming pups as naive virgins (g, left) and as mothers (g, right), rejecting male mounting during non-estrus (h, left), and mating upon male mounting during estrus (h, right) (n = 5 for fh, left, n = 3 for h, right). i, Mean peak ΔF/F of DR serotonin neurons during the six behaviors (d), with lines linking data from the same mice. j, Representative ΔF/F traces of DR serotonin neurons during pup interactions in the same female as a naive virgin (j, top) and a mother (j, bottom). Gray dash line indicates ΔF/F = 0. k, Responses before (–1 sec relative to behavior onset) and during pup sniffing/grooming across reproductive stages [n = 5; mixed-effects model: Restricted Maximum Likelihood (REML)–fixed effects type III followed by Šídák’s multiple comparisons test]. l, Same as (e) but in MR, sagittal view. m–o, Same as f–h, but in MR (n = 5). p–r, Same as i–k, but in MR. Data are shown as mean ± s.e.m. Abbreviation in this and all subsequent figures: DR, dorsal raphe; MR, median raphe. A, anterior; P, posterior; D, dorsal; V, ventral; L, lateral; M, medial. * p < 0.05; ** p < 0.01; *** p < 0.001; NS, not significant. See Source Data for detailed statistics.
Fig. 2 |
Fig. 2 |. Whole-brain axon mapping of serotonin neurons activated by pup interaction.
a, Schematic of viral-genetic strategy and whole-brain imaging. b, Representative histology showing the overlap (orange, mCherry+ & Tph2+ / mCherry+ = 97.4% from two mice) of mCherry (red) and Tph2 expression (gray) in the DR of a 4OHT-injected TRAP2;Sert-Flp mouse, coronal view. Scale bars, 100 μm (20 μm in enlarged view of neurons outlined in the boxed areas). c, Representative histology showing raphe serotonin cell bodies from an example pup-TRAPed brain (magenta box) and home cage (HC)-TRAPed brain (cyan box), sagittal view. Scale bar, 200 μm (c, left). 3D rendering of axonal projections from the same two brains (c, right). Aq, aqueduct. d, Heatmap showing raw labeling density across 292 regions defined by the Allen Atlas (n = 5 pup-TRAP, n = 5 HC-TRAP, with each column representing a mouse). Gray horizontal lines to the right show findings that pass false discovery rate at 3%. e, Difference in range-normalized labeling density between pup-TRAP and HC-TRAP conditions shown by t-statistic. Dashed line demarcates the top 30 regions that differ between the two conditions in normalized labeling density. Dots are color coded by brain regions per Allen Brain Atlas coloring convention. f, Maximum intensity projection of 60-μm optical sections from the same two representative brains in selected target regions, including BNST (top) and mPOA (which includes both MPO and MPN defined by Allen Brain Atlas, bottom). Sections are shown in coronal view. Scale bars, 500 μm. g, Coronal maps showing the voxel-wise difference in average axon labeling density between the pup-TRAPed and HC-TRAPed brains. Darker red indicates higher mean axon density in the pup-TRAP condition. Black lines and text highlight a subset of regions with higher axon labeling density in the pup-TRAP condition. Cyan line and text annotate SCH, a region densely innervated by serotonin neurons but is not differentially labeled between pup- and HC-TRAP conditions. See Supplementary Video 1 for the fly-through of coronal maps showing all brain regions. See Extended Data Fig. 2f for explanations of anatomical region abbreviations, and Source Data for detailed statistics.
Fig. 3 |
Fig. 3 |. Serotonin is required in 5HTmPOA to promote pup care in mothers, but in 5HTBNST to inhibit pup interaction in virgins.
a, Schematic showing viral-genetic strategy to conditionally knock out Tph2 from projection-defined serotonin neurons. b, Representative histology showing that Tph2 (magenta) is expressed in AADC+ (green) neurons expressing Cre (orange) in wild type (WT) control mice (left), but is absent in Tph2flox/flox mice (right). Scale bars, 50 μm (20 μm in enlarged view of neurons outlined in the boxed areas). c, Percentage of AADC+ and Cre+ neurons that co-express Tph2 in WT and Tph2fl/fl mice (n = 3, 6; two-tailed t-test). The ~20% AADC+ / Tph2 cells in WT likely represent dopamine neurons near the DR. d, Experimental timeline. JF, juvenile female; obj, object; NE, non-estrus; E, estrus. Arrows indicate behavioral recording days (d). e, Schematic of control and 5HTmPOA-cKO neurons via bilateral injection of AAVretro-Cre into mPOA. f, Example ethogram showing pup-directed behaviors by a representative control and 5HTmPOA-cKO female as virgin (f1, top) vs. mother (f1, bottom). Example heat map showing the nose position of the same animals during pup interaction as virgin (f2, top) vs. mother (f2, bottom). Nose position was obtained using automatic animal pose tracking. Red circles indicate the main pup location in that session. g, h, Time spent sniffing/grooming pups (g, left; two-tailed t-test) or in contact with pups (g, right; Mann Whitney U-test) by mPOA-injected WT control and 5HTmPOA-cKO as virgins (n = 9, 11), and as mothers (h; two-tailed t-test) (8, 11; one control animal died during labor). i, Total pup contact time across reproductive stages in control and 5HTmPOA-cKO females (mixed effects analysis followed by Šídák’s multiple comparisons test). j, Novel object interaction (left) and distance travelled (right) by control and 5HTmPOA-cKO (n = 9, 11; object: Mann Whitney U-test; distance: two-tailed t-test). Distance travelled was calculated based on nose position obtained using automatic animal pose tracking. k, Left, time spent interacting with juvenile female intruder (n = 9, 11; two-tailed t-test) by mPOA-injected WT control and 5HTmPOA-cKO females. Right, receptivity across estrus cycle (right; n = 7, 10; mixed effects analysis followed by Šídák’s multiple comparisons test). l–r, Same as e–k except for 5HTBNST-cKO (n = 7, 9). For c, g–k, and n–r, each dot or line represents one animal; data are shown as mean ± s.e.m. See Source Data for detailed statistics.
Fig. 4 |
Fig. 4 |. 5HTmPOA activation increases pup interaction in virgins, whereas 5HTBNST activation inhibits pup interaction in mothers.
a, Schematic showing viral-genetic strategy for (1) control #1, which have normal Tph2 expression but minimal SOUL expression as the animals lack Flp in Sert+ neurons; (2) experimental mice, which have SOUL (red) expressed in 5HTmPOA or 5HTBNST neurons with normal Tph2 expression (gray); and (3) control #2 with SOUL expressed in 5HTmPOA or 5HTBNST neurons that have Tph2 conditionally knocked out. The three genotypes are presented in the same order from left to right in e–h and j–m. b, Representative confocal sections showing that SOUL expression (red) overlaps with Tph2 (gray) in Sert-Flp+;Tph2+/+ mice (left, corresponding to Experimental in a), but does not in Sert-Flp+;Tph2fl/fl mice (right, corresponding to Control #2 in a). Scale bars, 100 μm (20 μm in high magnification inset). c, Experimental timeline and optogenetic stimulation paradigm for each behavioral session. CPP, conditioned place preference. Other abbreviations same as Fig. 3d. d, Three example ethograms of time spent sniffing/grooming pups during 5HTmPOA activation in Sert-Flp virgins with normal Tph2. Each row is one mouse, with both SOUL off (I for inactive, orange) and SOUL on (A, for active, blue) periods shown. Red dotted lines on the ethograms mark the start of laser stimulations. Red solid lines mark the end of the session. e, f, Time spent sniffing/grooming pups during SOUL off (I) and SOUL on (A) by the mPOA-injected naïve virgin females (e) and as mothers (f). g, Object interaction between SOUL off (I) and SOUL on (A) in the mPOA-injected mice. h, Interaction time with a juvenile female intruder between SOUL off (I) and SOUL on (A) in the mPOA-injected mice. i–m, Same as d–h except for BNST-injected female mice. For d–h (n = 5, 9, 5) and i–m (n = 7, 8, 7 with one WT female that died during labor). Each dot or line represents one animal; data are shown as mean ± s.e.m. See Source Data for detailed statistics.
Fig. 5 |
Fig. 5 |. Local dynamics and action of serotonin at mPOA and BNST.
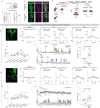
a, Top, representative histology aligned to the mouse brain atlas showing fiber implantation for serotonin sensor (g5-HT3.0) recording in mPOA. Bottom, experiment timeline. All animals were recorded at two wavelengths: 490 nm which captures serotonin-dependent fluorescence and 405 nm, an isosbestic control that captures serotonin-independent background noise and motion artifacts. Scale bars, 500 μm (50 μm in high magnification inset) b, Left, representative ΔF/F trace of g5-HT3.0 signal in mPOA during the first and subsequent pup interactions in a naïve virgin. Right, group g5-HT3.0 signal in mPOA during the first pup interaction in naïve virgins. n = 9 recorded females. c, Quantifications of area under curve (AUC) normalized to interaction duration before and during the first pup, object, and juvenile female interaction in naïve virgins. (n = 9 females recorded in mPOA; two-way repeated measures (RM) ANOVA followed by Tukey multiple comparisons tests). d, Representative ΔF/F traces of g5-HT3.0 signal in mPOA during the pup interactions in a naïve virgin (top) and the same animal after parturition (bottom). e, Peri-event time histograms (PETHs) of ΔF/F of g5-HT3.0 signal in mPOA aligned to the onset of females sniffing/grooming pups. The panel shows both group g5-HT3.0 signal in naïve virgins (black trace) and the same females as mothers (pink trace) (n = 9 females). f, Within-animal comparisons of mean peak ΔF/F of g5-HT3.0 signal in mPOA between virgins (V) and the same animals as mothers (M) during pup, object, and juvenile female (JF) interaction (n = 9 virgins and mothers except n = 5 for JF interaction; the other 4 mothers attacked the juvenile female and were excluded as the behavior was not comparable to their non-aggressive interactions with juvenile female intruder as virgins; two-way RM ANOVA followed by Tukey multiple comparisons tests). g–l, Same as a–f, but for g5-HT3.0 recording at BNST. n = 9 (h, i); n = 6 (k, l) except n = 3 for JF interaction in (l). m, Experimental setup for Htr2C antagonist (2C–) infusion in mPOA and representative histology showing infusion target indicated by Fluoro-Ruby (magenta). Scale bar, 500 μm. n, Time spent sniffing/grooming pups (left; n = 7, 7; two-tailed t-test) or maintaining contact with pups (right; n = 7, 7; two-tailed t-test) by naïve virgin females with 2C– or vehicle infused in mPOA. o, Time spent sniffing/grooming pups (left; n = 6, 7 Mann Whitney U test) or maintaining contact with pups (right; n = 6, 7, one control female died during labor; two-tailed t-test) by mothers with 2C– or vehicle infused in mPOA. p, Total pup contact time across reproductive stages in mice with 2C– or vehicle infused in mPOA (n = 7, 7 for virgins; n = 6, 7 for mothers; mixed effects analysis followed by Šídák’s multiple comparisons test). q–t, Same as m–p except for 2C– infusion in BNST. n = 6, 7 for vehicle and 2C– (r); n = 6, 6 for vehicle and 2C– (one 2C– female died during labor); n = 6, 7 for virgins and n = 6, 6 for mothers (s, t). See Source Data for detailed statistics.

Similar articles

References

    1. McCarthy M. M. & Vom Saal F. S. The influence of reproductive state on infanticide by wild female house mice (Mus musculus). Physiol. Behav. 35, 843–849 (1985). - PubMed
    1. Dulac C., O’Connell L. A. & Wu Z. Neural control of maternal and paternal behaviors. Science 345, 765–770 (2014). - PMC - PubMed
    1. Kohl J., Autry A. E. & Dulac C. The neurobiology of parenting: A neural circuit perspective. BioEssays 39, 1–11 (2017). - PMC - PubMed
    1. Mei L., Yan R., Yin L., Sullivan R. M. & Lin D. Antagonistic circuits mediating infanticide and maternal care in female mice. Nature 618, 1006–1016 (2023). - PMC - PubMed
    1. Kaplan H. S., Horvath P. M., Rahman M. M. & Dulac C. The Neurobiology of Parenting and Infant-Evoked Aggression. Physiol. Rev. 105, 315–381 (2024). - PMC - PubMed

Publication types

LinkOut - more resources