

Spatial and Diurnal Variations in Sodium Content Within Intervertebral Disc Tissue
- PMID: 40766839
- PMCID: PMC12322741
- DOI: 10.1002/jsp2.70079
Spatial and Diurnal Variations in Sodium Content Within Intervertebral Disc Tissue
Abstract
Background: Daily cycles in tissue osmolarity within the intervertebral disc (IVD) are a biophysical signal that regulates cellular metabolism and arise from deformation of the charged and hydrated extracellular matrix (ECM). However, the magnitude of these osmotic cycles remains unclear due to spatial variations in ECM composition and fixed charge density (FCD) between the regions of the IVD and between the pericellular matrix (PCM) and surrounding ECM. This study aimed to (1) validate the use of laser ablation-inductively coupled plasma-mass spectrometry (LA-ICP-MS) to assess intra-tissue sodium content and (2) apply this method to assess temporal and spatial changes in intra-tissue sodium content during a diurnal loading cycle.
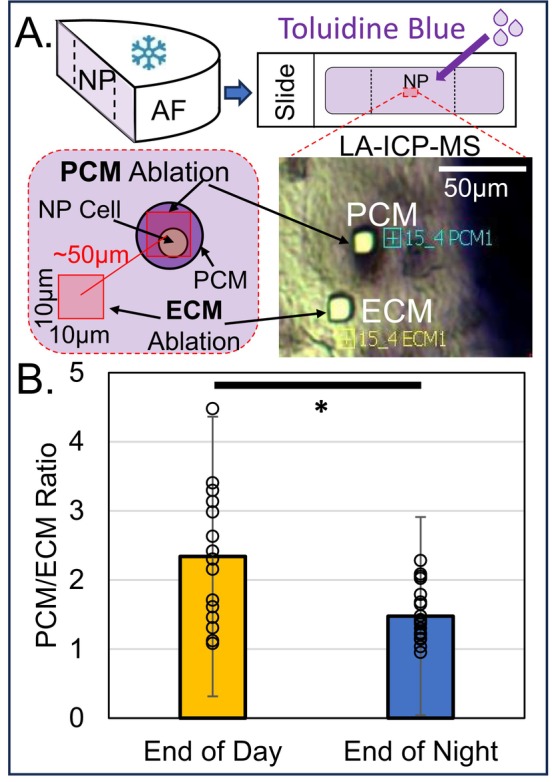
Methods: The FCD of nucleus pulposus (NP) tissue was modified via equilibrium dialysis, and intra-tissue sodium was assessed via inductively coupled plasma-optical emission spectroscopy (ICP-OES) and LA-ICP-MS. In addition, tissue was stained with a cationic iodine-based contrast agent, and iodine was assessed via LA-ICP-MS. Diurnal changes in sodium were measured via LA-ICP-MS and ICP-OES in bovine caudal motion segments loaded under simulated physiologic loading for 40 (n = 4) or 48 (n = 4) hours, representing end-of-day and end-of-night deformations, respectively.
Results: Intra-tissue sodium content assessed via LA-ICP-MS strongly correlated (r ≥ 0.95) with ICP-OES sodium content, theoretical FCD values, and LA-ICP-MS iodine content in equilibrated tissue. Diurnal sodium results demonstrate that at the macroscale the NP region possessed a greater sodium content than the annulus fibrosus (AF) and experienced greater diurnal changes ("end-of-day-NP" sodium [0.52 ± 0.18 mEq Na/g wet wt], "end of night-NP" sodium [0.34 ± 0.13 mEq Na/g wet wt]) than the AF which did not experience a diurnal change. At the microscale, average PCM sodium normalized to adjacent ECM sodium at the end-of-day (2.3 ± 0.96) was greater than at the end-of-night (1.5 ± 0.38), indicating cells embedded within their specialized PCM likely experience elevated osmotic fluctuations.
Keywords: fixed charge density; laser ablation‐inductively coupled plasma‐mass spectrometry; pericellular matrix; tissue sodium.
© 2025 The Author(s). JOR Spine published by Wiley Periodicals LLC on behalf of Orthopaedic Research Society.
Conflict of interest statement
The authors declare no conflicts of interest.
Figures


References
-
- Urban J. and McMullin J., “Swelling Pressure of the Intervertebral Disc: Influence of Proteoglycan and Collagen Contents,” Biorheology 22 (1985): 145–157. - PubMed
-
- Urban J. P. G. and McMullin J. F., “Swelling Pressure of the Lumbar Intervertebral Discs: Influence of Age, Spinal Level, Composition, and Degeneration,” Spine 13 (1988): 179–187. - PubMed
-
- Urban J., Maroudas A., Bayliss M., and Dillon J., “Swelling Pressures of Proteoglycans at the Concentrations Found in Tissues,” Biorheology 16 (1979): 447–464. - PubMed
-
- Vergroesen P. P. A., van der Veen A. J., Emanuel K. S., van Dieën J. H., and Smit T. H., “The Poro‐Elastic Behaviour of the Intervertebral Disc: A New Perspective on Diurnal Fluid Flow,” Journal of Biomechanics 49 (2016): 857–863. - PubMed
LinkOut - more resources
Full Text Sources
Miscellaneous
