

Optogenetic control of transgene expression in Marchantia polymorpha
- PMID: 40766900
- PMCID: PMC12319710
- DOI: 10.1002/aps3.11632
Optogenetic control of transgene expression in Marchantia polymorpha
Abstract
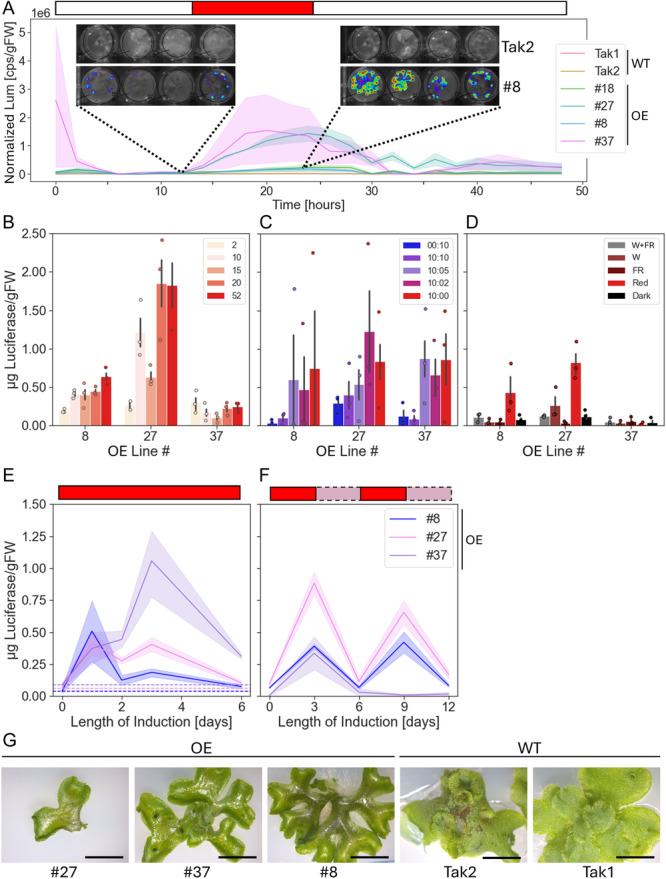
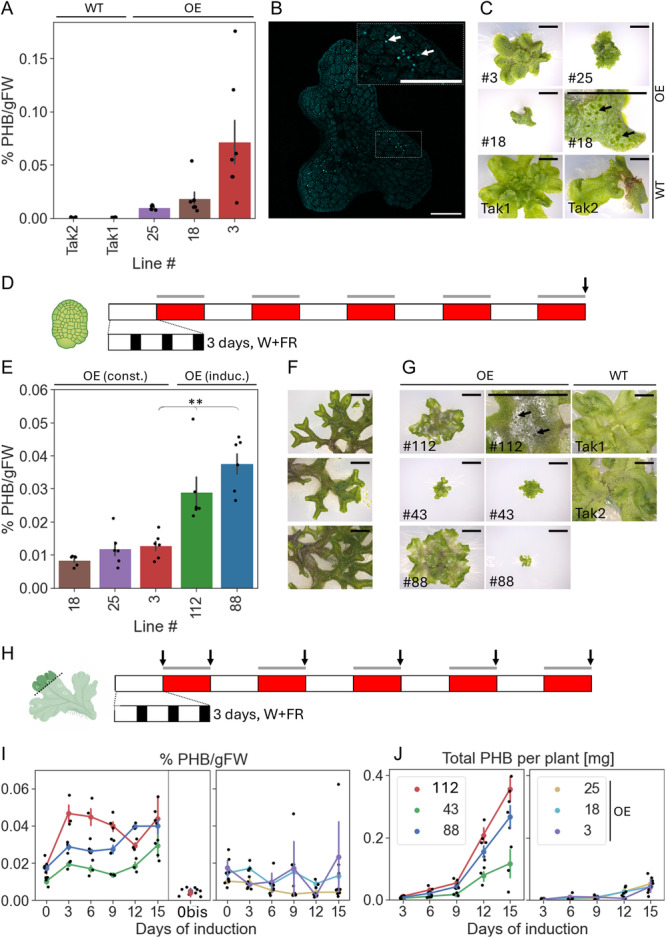
Premise: The model liverwort Marchantia polymorpha is an emerging testbed species for plant metabolic engineering but lacks well-characterized inducible promoters, which are necessary to minimize biochemical and physiological disruption when over-accumulating target products. Here, we demonstrate the functionality of the light-inducible plant-usable light-switch elements (PULSE) optogenetic system in Marchantia and exemplify its use through the light-inducible overproduction of the bioplastic poly-3-hydroxybutyrate (PHB).
Methods: The PULSE system was used to drive expression of luciferase as a reporter and characterize its induction in transgenic M. polymorpha. Additionally, PULSE was used to drive expression of the PHB biosynthetic pathway; the accumulation of PHB under light-inducible control was compared to constitutive overexpression.
Results: PULSE was fully functional and minimally leaky in M. polymorpha. The presence of the PULSE construct, even in the absence of induction, resulted in a developmental phenotype. Constitutive and inducible expression resulted in similar PHB accumulation levels.
Discussion: PHB biosynthesis in plants is known to adversely affect plant health, but placing its production under optogenetic control alleviated negative effects on biomass accumulation in some instances. The work presented here represents a significant expansion of the toolbox for the metabolic engineering of M. polymorpha.
Keywords: acetyl‐CoA; liverwort; metabolic engineering; poly‐3‐hydroxybutyrate (PHB); toolbox.
© 2025 The Author(s). Applications in Plant Sciences published by Wiley Periodicals LLC on behalf of Botanical Society of America.
Figures
Similar articles
-
Analysis of Poly-3-Hydroxybutyrate Production with Different Microorganisms Using the Dynamic Simulations for Evaluation of Economic Potential Approach.ACS Omega. 2025 Jun 11;10(26):27756-27774. doi: 10.1021/acsomega.4c11178. eCollection 2025 Jul 8. ACS Omega. 2025. PMID: 40657095 Free PMC article.
-
Use of constitutive and inducible oncogene-containing iPSCs as surrogates for transgenic mice to study breast oncogenesis.Stem Cell Res Ther. 2021 May 27;12(1):301. doi: 10.1186/s13287-021-02285-x. Stem Cell Res Ther. 2021. PMID: 34044885 Free PMC article.
-
Short-Term Memory Impairment.2024 Jun 8. In: StatPearls [Internet]. Treasure Island (FL): StatPearls Publishing; 2025 Jan–. 2024 Jun 8. In: StatPearls [Internet]. Treasure Island (FL): StatPearls Publishing; 2025 Jan–. PMID: 31424720 Free Books & Documents.
-
Management of urinary stones by experts in stone disease (ESD 2025).Arch Ital Urol Androl. 2025 Jun 30;97(2):14085. doi: 10.4081/aiua.2025.14085. Epub 2025 Jun 30. Arch Ital Urol Androl. 2025. PMID: 40583613 Review.
-
Factors that impact on the use of mechanical ventilation weaning protocols in critically ill adults and children: a qualitative evidence-synthesis.Cochrane Database Syst Rev. 2016 Oct 4;10(10):CD011812. doi: 10.1002/14651858.CD011812.pub2. Cochrane Database Syst Rev. 2016. PMID: 27699783 Free PMC article.
References
-
- Althoff, F. , Kopischke S., Zobell O., Ide K., Ishizaki K., Kohchi T., and Zachgo S.. 2014. Comparison of the MpEF1α and CaMV35 promoters for application in Marchantia polymorpha overexpression studies. Transgenic Research 23(2): 235–244. - PubMed
-
- Bohmert, K. , Balbo I., Kopka J., Mittendorf V., Nawrath C., Poirier Y., Tischendorf G., et al. 2000. Transgenic Arabidopsis plants can accumulate polyhydroxybutyrate to up to 4% of their fresh weight. Planta 211(6): 841–845. - PubMed
LinkOut - more resources
Full Text Sources
