Observational Study
. 2025 Aug 1;66(11):16.
doi: 10.1167/iovs.66.11.16.

Progression Patterns in Foveal-Sparing Geographic Atrophy With Double-Layer Sign Due to Neovascularization or Basal Laminar Deposits

Affiliations
Observational Study

Progression Patterns in Foveal-Sparing Geographic Atrophy With Double-Layer Sign Due to Neovascularization or Basal Laminar Deposits

Serena Fragiotta et al. Invest Ophthalmol Vis Sci. .

Abstract

Purpose: The purpose of this study was to analyze the prognostic significance of double-layer sign (DLS) in eyes with foveal-sparing geographic atrophy (GA) secondary to age-related macular degeneration.

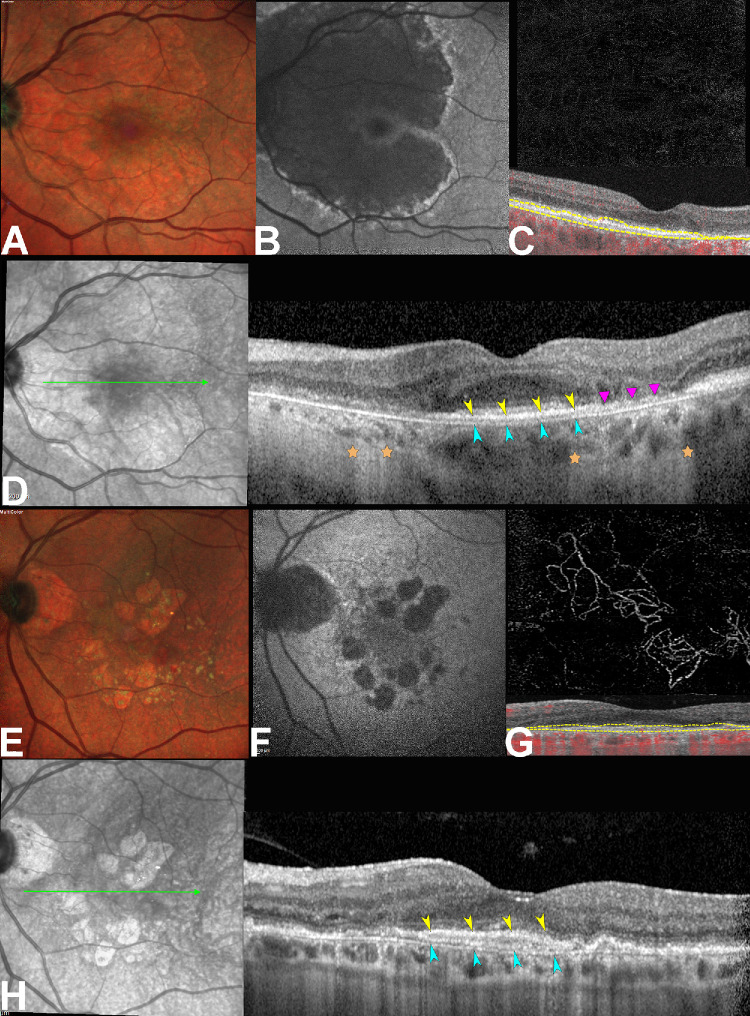
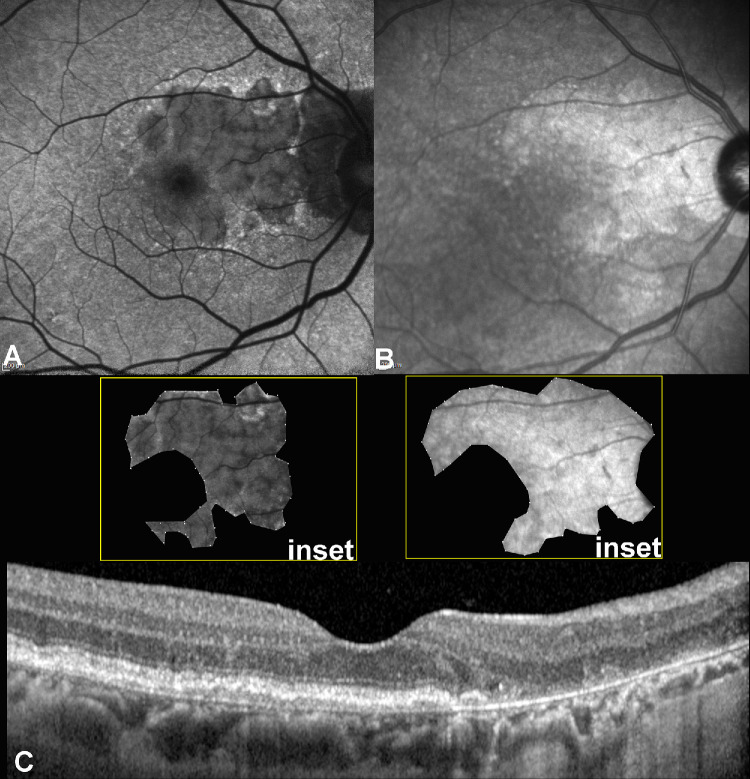
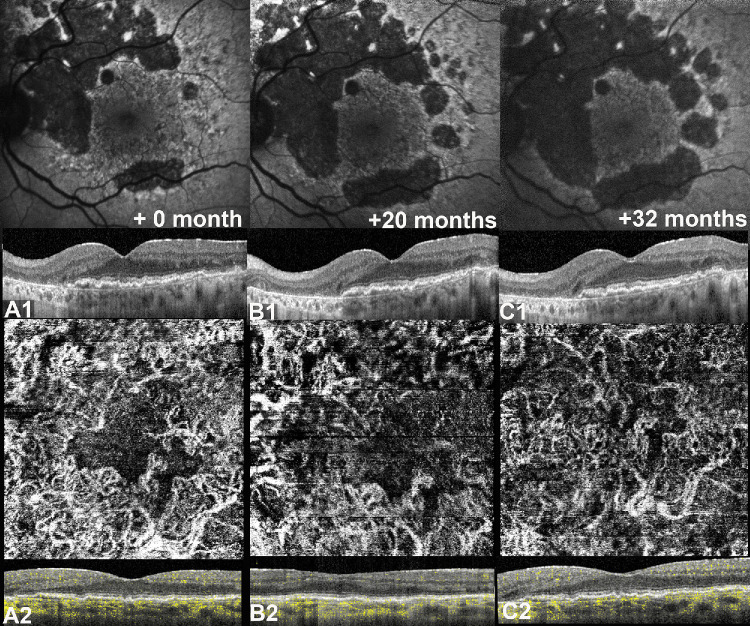
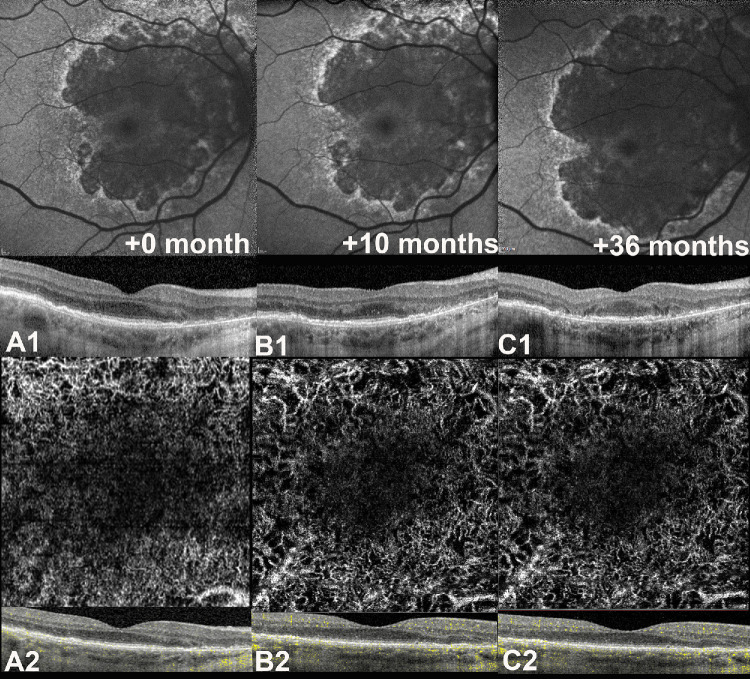
Methods: This retrospective, observational cohort study analyzed 46 eyes (46 patients) with foveal sparing GA and associated DLS, using fundus autofluorescence (FAF), near-infrared reflectance (NIR), optical coherence tomography (OCT), and OCT angiography (OCTA). DLS was defined based on OCTA findings as either thick basal laminar deposits (BLamD) or non-exudative macular neovascularization (NE-MNV). The area of GA and foveal sparing were estimated on both FAF and NIR at different time points. Centrifugal and centripetal GA growth rates referring to the lesion expansion away from and toward the fovea, respectively, were evaluated using a mathematical formula.

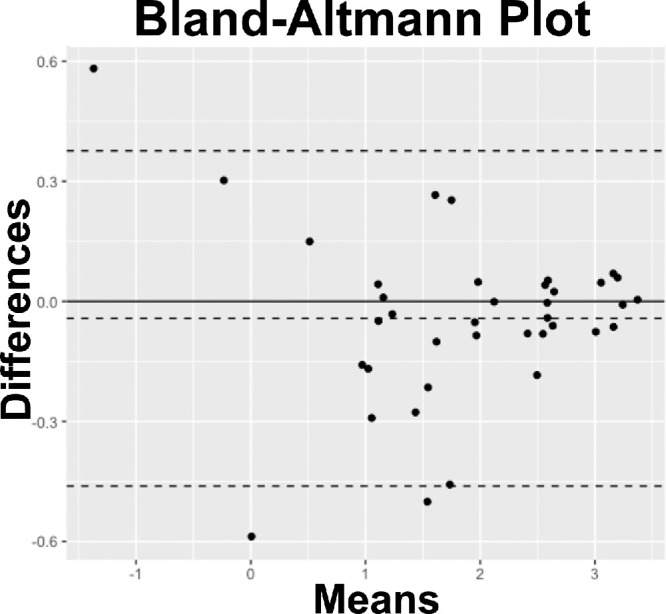
Results: Of the 46 eyes enrolled, 25 had thick BLamD, whereas 21 had type 1 NE-MNV. The NE-MNV eyes showed significantly thicker DLS than those with BLamD (90.4 ± 39.8 µm vs. 57.0 ± 27 µm, 95% confidence interval [CI] = 0.34 to 0.78, P < 0.001). GA areas were smaller on FAF than NIR (95% CI = -0.89 to -0.03, P = 0.03) in the BLamD group, whereas no difference was observed in the NE-MNV group (95% CI = -0.37 to 0.64, P = 0.60). Despite similar GA areas, the NE-MNV eyes exhibited larger foveal sparing (95% CI = 0.02 to 1.21, P = 0.04). The foveal sparing area remained stable (F(1.2, 11 = 4.15, P = 0.06, ω2 = 0.02) in the NE-MNV group, whereas a significant reduction was observed in the BLamD subgroup (F(1.39, 20.9) = 7.5, P < 0.001, ω2 = 0.09).

Conclusions: OCTA has provided valuable insights into the pathogenic interpretation of the DLS signature. Our findings confirm that a neovascular DLS protects the retinal pigment epithelium and outer retina, contributing to prolonged foveal preservation.


Conflict of interest statement

Disclosure: S. Fragiotta, Bayer (F); M. Parravano, Allergan (F), Novartis (F), Bayer (F), Zeiss (F), Omikron (F), Alfaintes (F), and Sifi (F); R. Sacconi, Novartis (F), Bayer (F), and Zeiss (F); M.S. Polito, None; B. Cioffi, None; F. Rissotto, None; F. Beretta, None; E. Costanzo, None; E. Romano, None; V. Capuano, None; E.H. Souied, AbbVie (North Chicago, Illinois, USA) (C), Bayer Shering-Pharma (Berlin, Germany) (C), Hoffmann-La-Roche (Basel, Switzerland) (C), and Novartis (Basel, Switzerland) (C); G. Querques, Alimera Sciences, Inc. (C); Allegro (C), Allergan (C), Apellis (C), Bausch & Lomb (C), Bayer Healthcare Pharmaceuticals (C), Boehringer Ingelheim (C), CenterVue (C), Heidelberg Engineering (C), Lumithera (C), Nevacar (C), Novartis Pharmaceuticals Corporation (C), Roche (C), SIFI (C), Sooft/Fidia (C), Topcon (C), Thea (C), and Zeiss (C)

Figures

Figure 1.
Figure 1.
Multimodal imaging distinction of double layer sign (DLS). Thin DLS. (A) Multicolor imaging obtained through Spectralis optical coherence tomography (HRA + OCT; Heidelberg Engineering, Heidelberg, Germany). (B) Fundus autofluorescence (FAF) shows the extension of the hypofluorescent area corresponding to the outer retina and retinal pigment epithelium (RPE) atrophy. (C) OCT angiography (PLEX Elite 9000; Carl Zeiss Meditec, Inc., Dublin, CA, USA) demonstrated the absence of flow signal using an RPE-RPE fit segmentation. (D) OCT B-scan passing through the fovea (green arrow) reveals the presence of a thin RPE-basal lamina (BL; yellow arrowheads) Bruch's membrane (BrM; teal arrowheads) splitting with a hyporeflective interior. A residual hyper-reflective coarse material can be appreciated in correspondence with a nascent atrophic region (magenta triangles), likely expression of residual basal laminar deposits (BLamD). The posterior hypertransmission regions are marked by orange stars. (E) Multicolor imaging of a case with thick BLamD. (F) The corresponding demonstrated hypo-autofluorescent oval regions of atrophy surrounding the fovea. (G) OCT angiography demonstrated the presence of a type 1 neovascular network using an RPE-RPE fit segmentation. (H) OCT B-scan passing through the fovea (green arrow) demonstrates the presence of a thick separation between the RPE-BL (yellow arrowheads) and the BrM (teal arrowheads) with a stratified reflectivity.
Figure 2.
Figure 2.
Double layer sign (DLS) associated with thick basal laminar deposits. (A) Fundus autofluorescence (FAF; Heidelberg Engineering, Heidelberg, Germany) shows the extension of geographic atrophy (GA) seen as a hypo-autofluorescent area surrounded by a ring of increased autofluorescence. (B) Near-infrared reflectance (NIR) obtained during the same visit shows the atrophic region as hyper-reflective. The atrophic area at baseline appears different from those observed on NIR, with an apparent underestimation of atrophy on FAF at baseline (insets). Despite this, the Bland-Altmann test revealed a substantial agreement between the two imaging methods, as shown in Figure 3. (C) Spectral-domain optical coherence tomography (OCT) B-scan passing through the fovea shows a thin peculiar separation of the retinal pigment epithelium (RPE) and its basal lamina with Bruch’s membrane with a hyporeflective homogenous interior.
Figure 3.
Figure 3.
Bland Altmann plot analyzing the geographic atrophy (GA) area delineation on both fundus autofluorescence and near-infrared images. The bland-Altmann test revealed a substantial agreement between the two methods of GA areas delineation (mean bias = −0.27, 95% CI = 1.7 to −2.25, P = 0.10).
Figure 4.
Figure 4.
Geographic atrophy (GA) with foveal sparing in a case of double layer sign (DLS) associated with non-exudative macular neovascularization (NE-MNV). (A1) Fundus autofluorescence (FAF) at baseline shows the atrophic lesion with foveal sparing as confirmed through optical coherence tomography (OCT) B-scan passing through the fovea. The OCT B-scan is showing an irregular DLS at medium internal reflectivity. (A2) OCT angiography (Heidelberg, Germany) of the choriocapillaris slab confirms the presence of a type 1 neovascular network at baseline. (B1) At 20 months, the atrophic area has enlarged with relative preservation of the macular region, corresponding to the area occupied by a thick DLS on OCT B-scan passing through the fovea. (B2) OCTA confirmed the presence of a neovascular signal within the DLS. (C1) At 32 months from baseline, despite a further enlargement of the atrophic lesion can be appreciated, the foveal sparing area is still preserved and relatively stable compared to B1. (C2) OCTA slab demonstrates the presence of a diffuse neovascular network within the DLS.
Figure 5.
Figure 5.
A comparative case with geographic atrophy (GA) with foveal sparing associated with a thin double layer sign (DLS). (A1) Fundus autofluorescence (FAF) at baseline shows the atrophic lesions with foveal sparing at baseline confirmed with optical coherence tomography (OCT) B-scan passing through the fovea showing a thin hyporeflective DLS. Noteworthy, despite that the area of foveal sparing seen on OCT B-scan appears similar to that in Figure A1 at baseline, the corresponding estimation of FAF differs substantially, further highlighting the limitations of FAF in delineating GA and foveal sparing in eyes with thick basal laminar deposits (BLamD). (A2) OCT angiography (Heidelberg, Germany) of the choriocapillaris slab showing the absence of a neovascular network at the level of thin DLS. (B1) FAF at 10 months shows an enlargement of the atrophic lesion with preservation of the foveal sparing area, with a relative stability of the OCT B-scan. (B2) OCTA slab is unchanged. (C1) At 36 months, the area of atrophy demonstrates further centrifugal enlargement with a marked reduction of the sparing area, as confirmed through OCT B-scan passing through the fovea. A residual hyper-reflective material lying on Bruch's membrane co-localizing with the posterior hypertransmission can be appreciated, a possible signature for persistent BLamD in the atrophic zone. (C2) OCTA choriocapillaris slab shows no changes from baseline A2.

Similar articles

References

    1. Wong WL, Su X, Li X, et al.. Global prevalence of age-related macular degeneration and disease burden projection for 2020 and 2040: a systematic review and meta-analysis. Lancet Glob Health. 2014; 2: e106–e116. - PubMed
    1. Sarks JP, Sarks SH, Killingsworth MC.. Evolution of geographic atrophy of the retinal pigment epithelium. Eye (Lond). 1988; 2(Pt 5): 552–577. - PubMed
    1. Sarks SH. Ageing and degeneration in the macular region: a clinico-pathological study. Br J Ophthalmol. 1976; 60: 324–341. - PMC - PubMed
    1. Li M, Dolz-Marco R, Huisingh C, et al.. Clinicopathologic correlation of geographic atrophy secondary to age-related macular degeneration. Retina. 2019; 39: 802–816. - PMC - PubMed
    1. Li M, Huisingh C, Messinger J, et al.. Histology of geographic atrophy secondary to age-related macular degeneration: a multilayer approach. Retina. 2018; 38: 1937–1953. - PMC - PubMed

Publication types

LinkOut - more resources