. 2025 Sep 2;13(9):e0079825.
doi: 10.1128/spectrum.00798-25. Epub 2025 Aug 6.

Gellan gum formulations containing natural polyphenolic compounds to treat oral candidiasis

Affiliations

Gellan gum formulations containing natural polyphenolic compounds to treat oral candidiasis

Narchonai Ganesan et al. Microbiol Spectr. .

Abstract

Oral candidiasis (OC) is caused by Candida albicans, targeting immunocompromised individuals and developing drug resistance, highlighting the need for advanced therapeutics. Polyphenols such as caffeic acid phenethyl ester (CAPE) and ellagic acid (EA) display antifungal and immune-modulating properties. Incorporating CAPE and EA in gellan gum (GG) formulation enhances their applicability and effectiveness against OC. We developed GG-based formulations loaded with CAPE (1,000 µg/mL), EA (1,000 µg/mL), or CAPE + EA (1,000 µg/mL each) against C. albicans. GG formulations containing gellan (0.6% and 1.0%), genipin (5 mM), polyethylene glycol 400 (0.5%), and sorbitan monooleate 80 (0.5%) demonstrated enhanced release of CAPE and EA. The 0.6% GG formulation reduced C. albicans CFU by 2-6 log10 within 30 min (P < 0.05) and biofilm mass by 48% (CAPE, P = 0.0034), 60.7% (EA, P = 0.0980), and 70% (CAPE + EA, P = 0.0181). Both 0.6% and 1.0% GG formulations inhibited hyphae (P < 0.0001). GG formulations showed high viability of human red blood cells (92%-94%) and human gingival cells (61%-69%). In artificial chewing simulations (ACS), 0.6% GG exhibited 67.7% (30 min), 55.9% (60 min), and 35.8% (120 min) for CAPE release, and 48.2% (30 min), 45.1% (60 min), and 42.1% (120 min) for EA. In 1% GG, about 44.07% (30 min), 43.8% (60 min), and 29.5% (120 min) of CAPE and 55.8% (30 min), 49.6% (60 min), and 50.6% (120 min) of EA were released. The present study is the first to evaluate the efficacy of CAPE- and EA-loaded GG formulations against C. albicans under ACS, thereby supporting their potential development for OC treatment.IMPORTANCECandida albicans causes OC and presents challenges due to rising antifungal resistance and recurrence in immunocompromised patients. Existing antifungal treatments for OC often fail due to limited bioavailability, short retention times, adverse side effects, and the bitter taste of formulations, impacting patient adherence. CAPE and EA are recognized for their antifungal and immunomodulatory properties but face practical limitations in therapeutic applications, such as poor bioavailability and stability. The present study addresses these challenges by developing GG-based formulations incorporating CAPE and EA. The formulation exhibited significant antifungal efficacy against C. albicans biofilms and hyphal formation, reducing fungal viability under simulated mechanical chewing conditions. These GG-based systems showed minimal cytotoxicity, indicating promising biocompatibility and suitability for oral application. Therefore, the study presents the first report of CAPE/EA-loaded GG formulations under simulated chewing that highlights the importance of innovative therapeutic strategies to improve clinical outcomes in OC treatment.

Keywords: Candida albicans; artificial chewing simulation; biofilm; caffeic acid phenethyl ester; ellagic acid; hyphae.


Conflict of interest statement

The authors declare no conflict of interest.

Figures

Fig 1
Fig 1
Growth inhibition of C. albicans by CAPE, EA, and CAPE + EA (0–840 min). (A) Structure of CAPE and EA. (B) CAPE (32, 16, 8, 4, and 0 µg/mL) showed maximum inhibition at a concentration of 32 µg/mL. (C) EA (8, 4, 2, 1, and 0 µg/mL) demonstrated maximum inhibition at concentrations ranging from 4 to 8 μg/mL. (D) CAPE + EA (32 + 4, 16 + 2, 8 + 1, 4 + 0.5, and 0 µg/mL) exhibited maximum inhibition at the concentrations of 32 + 4 and 16 + 2 µg/mL. Data are presented as mean ± SD (n = 3).
Fig 2
Fig 2
Dispersion of GG at various concentrations. (A) Visual representation of GG dispersion at concentrations of 0.6%, 1.0%, 2.0%, and 3.0% of gellan. (B) Quantitative measurement of GG dispersibility (diameter in cm) shows that the higher concentrations of gellan led to reduced dispersion: 0.6% (2.06 cm), 1.0% (1.73 cm), 2.0% (1.36 cm), and 3.0% (0.93 cm). Data are presented as mean ± SD (n = 3). Statistical differences were analyzed by one-way analysis of variance.
Fig 3
Fig 3
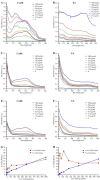
UV-Vis absorption spectra (A–F) and drug release (%) (G and H) of the 0.6% and 1% GG formulations loaded with 1,000 µg/mL of CAPE, EA, or CAPE + EA over 60 min. (A–B) The UV-Vis spectra of varying concentrations (1,000, 500, 250, 125, 75, 31.25, 15.6, and 0 µg/mL) of CAPE and EA were recorded, revealing primary absorption peaks at 325 and 255 nm for CAPE and EA, respectively. (C and D) The UV-Vis absorption spectra of the 0.6% GG formulation loaded with CAPE or EA at 1,000, 500, 250, 125, 75, 31.25, 15.6, and 0 µg/mL concentrations demonstrated a decrease in absorbance as drug concentration decreased over 60 min. (E and F) Similarly, the UV-Vis absorption spectra of the 1% GG formulation loaded with CAPE or EA (1,000, 500, 250, 125, 75, 31.25, 15.6, and 0 µg/mL) exhibited a decrease in absorbance with declining drug concentration at 60 min. (G and H) The percentage of drug release at 60 min was quantified for the 0.6% and 1.0% GG formulations. The maximum drug release of CAPE and EA from the 0.6% GG formulation was 32.07% and 28.3%, respectively. In comparison, the maximum drug release of CAPE and EA from the 1% GG formulation was 28.8% and 43.04%, respectively.
Fig 4
Fig 4
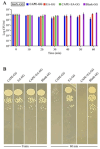
Killing kinetics of C. albicans treated with the 0.6% GG formulation loaded with CAPE (1,000 µg/mL), EA (1,000 µg/mL), or CAPE (1,000 µg/mL) + EA (1,000 µg/mL) over 60 min. (A) Quantitative analysis of the anticandidal activity of the 0.6% GG formulations showed significant reductions in viable fungal colonies. Treatment with CAPE (1,000 µg/mL), EA (1,000 µg/mL), or CAPE (1,000 µg/mL) + EA (1,000 µg/mL) resulted in reductions of 6 log₁₀ colony-forming units (CFU) (P = 0.0219), 1.2 log10 CFU (P = 0.0184), and 0.8 log10 CFU (P = 0.1249), respectively, within 60 min. (B) Visual representation of microbial colonies demonstrated a reduction in CFUs as the duration of treatment increased over 0–60 min. Decreased colony formation indicated effective killing of C. albicans. Data are presented as mean ± SD (n = 3). Statistical differences were analyzed by one-way analysis of variance.
Fig 5
Fig 5
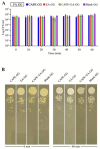
Killing kinetics of C. albicans treated with 1% gellan gum (GG) formulations. GG formulation (1%) was loaded with CAPE (1,000 µg/mL), EA (1,000 µg/mL), or CAPE (1,000 µg/mL) + EA (1,000 µg/mL). C. albicans were treated over 60 min. (A) Quantitative analysis of the anticandidal activity of the 1% GG formulations for CAPE + EA GG (P = 0.1649), CAPE-GG (P = 0.2413), and EA-GG (P = 0.4156) when compared with the blank-GG control at 60 min. (B) Visual representation of microbial colonies demonstrating reduced CFUs as over 0–60 min of treatment. Data are presented as mean ± SD (n = 3). Statistical differences were analyzed by one-way analysis of variance.
Fig 6
Fig 6
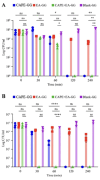
Killing kinetics of C. albicans treated with the 0.6% and 1% GG formulations of CAPE (1,000 µg/mL), EA (1,000 µg/mL), or CAPE (1,000 µg/mL) +EA (1,000 µg/mL) over 240 min. (A) The 0.6% GG formulation loaded with CAPE (1,000 µg/mL), EA (1,000 µg/mL), or CAPE (1,000 µg/mL) +EA (1,000 µg/mL) showed time-dependent reductions in viable C. albicans cells, with CAPE + EA demonstrating the most significant antifungal activity (P < 0.05). (B) The 1% GG formulation loaded with CAPE (1,000 µg/mL), EA (1,000 µg/mL), or CAPE (1,000 µg/mL) +EA (1,000 µg/mL) showed a similar trend, with CAPE + EA exhibiting enhanced antifungal activity compared with the individual treatments. The higher GG concentration (1%) resulted in slightly slower drug release but sustained antifungal effects over the duration. Data are presented as mean ± SD (n = 3). Statistical differences were analyzed by one-way analysis of variance. *P  <  0.05, **P <  0.005, ****P  <  0.0001. ns, non-significant.
Fig 7
Fig 7
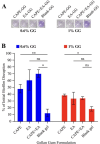
Biofilm disruption of C. albicans using the GG formulations loaded with CAPE (1,000 µg/mL), EA (1,000 µg/mL), or CAPE (1,000 µg/mL) + EA (1,000 µg/mL). (A) Qualitative analysis of biofilm disruption using crystal violet staining. The 0.6% and 1% GG formulations with CAPE (1,000 µg/mL), EA (1,000 µg/mL), or CAPE (1,000 µg/mL) + EA (1,000 µg/mL) caused reductions in crystal violet, indicating C. albicans initial biofilm disruption. (B) Bar graph of the percentages of initial biofilm disruption after treatment with the 0.6% and 1.0% GG formulations loaded with CAPE (1,000 µg/mL), EA (1,000 µg/mL), or CAPE (1,000 µg/mL) + EA (1,000 µg/mL). Blank-GG formulations without drugs were used as controls. The 0.6% GG formulation disrupted 48.05% (CAPE-GG), 60.75% (EA-GG), and 70.27% (CAPE + EA GG) of C. albicans biofilm. The 1% GG formulation disrupted 38.6% (CAPE-GG), 33.9% (EA-GG), and 18.5% (CAPE + EA GG) of C. albicans biofilm. Data are presented as mean ± SD (n = 3). Statistical differences were analyzed by one-way analysis of variance. *P  <  0.05, **P <  0.005. ns, non-significant.
Fig 8
Fig 8
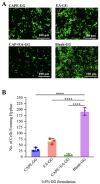
Inhibition of C. albicans hyphae formation using the GG formulations loaded with 1,000 µg/mL of CAPE, EA, or CAPE + EA. (A) Representative fluorescence microscopy images of C. albicans strain MLR62 tagged with hyphae-specific green fluorescence protein to visualize the inhibition of its hyphal and yeast forms after treatment with the 0.6% GG formulations loaded with CAPE (1,000 µg/mL), EA (1,000 µg/mL), or CAPE (1,000 µg/mL) + EA (1,000 µg/mL). Blank-GG formulation was used as a control. Images showed significantly reduced hyphal structures after treatment with CAPE-GG, EA-GG, and CAPE + EA GG compared with the blank-GG control. Scale bar = 100 µm. (B) Quantification of hyphal inhibition (number of hyphae formed) demonstrated that CAPE-GG, EA-GG, and CAPE-EA-GG exhibited a reduction of C. albicans hyphae. The blank-GG formulation had 191 hyphae forming C. albicans. Data are presented as mean ± SD (n = 3). Statistical differences were analyzed by one-way analysis of variance. ****P < 0.0001.
Fig 9
Fig 9
(A) Hemolysis assay showing the effects of the 0.6% and 1% gellan gum (GG) formulations loaded with CAPE (1,000 µg/mL), EA (1,000 µg/mL), or CAPE (1,000 µg/mL) + EA (1,000 µg/mL) and blank-GG on live cell viability (%) in 2% hRBCs. Triton X-100 (2%) was used as positive control. Both the 0.6% and 1.0% CAPE-GG, EA-GG, and CAPE + EA GG formulations exhibited high cell viability, with no significant hemolysis compared with positive control. (B) WST-1 assay showing the cytotoxicity of the 0.6% and 1.0% GG formulations (CAPE-GG, EA-GG, CAPE + EA GG, and blank-GG) on the HGF-1 cell line. Triton X-100 (2%) served as positive control, and untreated cells were used as negative control. The 0.6% GG formulations showed higher cell viability (62.0%–85.7%) compared with the 1% GG formulations (51%–69%). Triton X-100 demonstrated significant cytotoxicity, reducing cell viability to less than 10%. Data are presented as mean ± SD (n = 6). Statistical differences were analyzed by one-way analysis of variance. *P < 0.05, ****P  <  0.0001. ns, non-significant.
Fig 10
Fig 10
Artificially simulated chewing of the 0.6% and 1.0% GG formulations loaded with CAPE (1,000 µg/mL) and EA (1,000 µg/mL) at 30, 60, and 120. Drug release (%) from the GG formulations at the 30, 60, and 120 min time points. (A) For the 0.6% GG formulations, the maximum release of CAPE was 67.7%, whereas EA was 48.2% at 30 min. (B) For the 1% GG formulations, the maximum release of CAPE was 44.07%, whereas EA was 55.8% at 60 min. Data are presented as mean ± SD (n = 2).
Fig 11
Fig 11
Reduction in C. albicans CFU under chewing simulation using 0.6% GG formulations loaded with CAPE (1,000 µg/mL), EA (1,000 µg/mL), or CAPE (1,000 µg/mL) + EA (1,000 µg/mL). (A) CFU reduction of C. albicans following exposure to 0.6% GG formulations containing CAPE (1,000  µg/mL), EA (1,000  µg/mL), or CAPE + EA (1,000  µg/mL each) at time points 30, 60, and 120  min. At 30  min, CAPE-GG (P  =  0.0076), EA-GG (P  =  0.0227), and CAPE + EA GG (P  =  0.0045) showed significant reductions in CFU compared to the untreated control. At 60 min, none of the formulations showed a significant reduction in CFU. At 120 min, CAPE-GG (P  =  0.0011) and CAPE + EA GG (P  =  0.0027) again showed significant antifungal effects. (B) Comparison of 30–120 min CFU counts highlights the sustained anticandidal efficacy of the 0.6% GG formulations, including CAPE-GG, EA-GG, and CAPE + EA GG, under dynamic chewing simulation. Data are presented as mean ± SD (n  =  3). Statistical analysis was performed using two-way analysis of variance.*P < 0.05, **P  <  0.005. ns, not significant.
Fig 12
Fig 12
Reduction in C. albicans CFU under chewing simulation using 1% GG formulations loaded with CAPE (1,000 µg/mL), EA (1,000 µg/mL), or CAPE (1,000 µg/mL) + EA (1,000 µg/mL). (A) CFU reduction of C. albicans following exposure to 1% GG formulations containing CAPE (1,000  µg/mL), EA (1,000  µg/mL), or CAPE + EA (1,000  µg/mL each) at time points 30, 60, and 120  min. At 30 min, CAPE-GG (P  = 0.452), EA-GG (P  < 0.001), and CAPE + EA GG (P  =  0.059) showed reductions in CFU compared to the untreated control. At 60 and 120 min, none of the formulations showed significant CFU reduction. (B) Comparison of 30–120 min CFU counts highlights the sustained anticandidal efficacy of the 1% GG formulations, including CAPE-GG, EA-GG, and CAPE + EA GG, under dynamic chewing simulation. Data are presented as mean ± SD (n  =  3). Statistical analysis was performed using two-way analysis of variance. ***P  <  0.001. ns, not significant.

References

    1. Millsop JW, Fazel N 2. 2016. Oral candidiasis. Clin Dermatol 34:487–494. doi: 10.1016/j.clindermatol.2016.02.022 - DOI - PubMed
    1. Prevention CfDCa. 2024. Candidiasis. Available from: https://www.cdc.gov/candidiasis. Retrieved Jun 2025.
    1. Vila T, Sultan AS, Montelongo-Jauregui D, Jabra-Rizk MA 2. 2020. Oral candidiasis: a disease of opportunity. J Fungi (Basel) 6:15. doi: 10.3390/jof6010015 - DOI - PMC - PubMed
    1. Erfaninejad M, Zarei Mahmoudabadi A, Maraghi E, Hashemzadeh M, Fatahinia M. 2022. Epidemiology, prevalence, and associated factors of oral candidiasis in HIV patients from southwest Iran in post-highly active antiretroviral therapy era. Front Microbiol 13:983348. doi: 10.3389/fmicb.2022.983348 - DOI - PMC - PubMed
    1. Patil S, Majumdar B, Sarode SC, Sarode GS, Awan KH. 2018. Oropharyngeal candidosis in HIV-infected patients-an update. Front Microbiol 9:980. doi: 10.3389/fmicb.2018.00980 - DOI - PMC - PubMed

MeSH terms

LinkOut - more resources