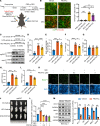
. 2025 Jul 24;135(19):e186534.
doi: 10.1172/JCI186534. eCollection 2025 Oct 1.

Serum- and glucocorticoid-induced kinase 3 orchestrates glucocorticoid signaling to facilitate chromatin remodeling during murine adipogenesis

Affiliations

Serum- and glucocorticoid-induced kinase 3 orchestrates glucocorticoid signaling to facilitate chromatin remodeling during murine adipogenesis

Qilong Chen et al. J Clin Invest. .

Abstract

Elevated glucocorticoid levels are common in conditions such as aging, chronic stress, Cushing syndrome, and glucocorticoid therapy. While glucocorticoids suppress inflammation through the glucocorticoid receptor (GR), they also cause metabolic side effects. Investigating alternative pathways beyond GR activation is crucial for reducing these side effects. Our phosphoproteomics analysis revealed that glucocorticoid exposure promotes phosphorylation at the RxxS motifs of multiple proteins in preadipocytes, including those mediated by serum- and glucocorticoid-induced kinase 3 (SGK3). SGK3 is a key mediator of glucocorticoid-induced adipogenesis, as shown by impaired adipogenesis after SGK3 inhibition or genetic ablation. Sgk3-KO mice were resistant to obesity induced by glucocorticoid or a high-fat diet, and proteolysis targeting chimeras (PROTAC) targeting SGK3 reduced adipogenesis in both obese mice and in a thyroid eye disease cell line. Mechanistically, SGK3 translocated to the nucleus upon glucocorticoid stimulation, interacted with and phosphorylated the BRG1 subunit of the BAF complex, and prevented BRG1 degradation, promoting chromatin remodeling necessary for adipogenesis. These findings highlight SGK3 as a potential therapeutic target to mitigate metabolic side effects of elevated glucocorticoid levels.

Keywords: Adipose tissue; Cell biology; Metabolism; Obesity.


Figures
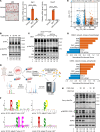
Figure 1
Figure 1. SGK3 is essential for protein phosphorylation in response to glucocorticoid stimulation.
(A) Representative images of Oil Red O staining of differentiated preadipocytes treated with vehicle or RU486 (left). Scale bar: 200 μm. mRNA level of GR targets Sgk1 (middle) and Rasd1 (right) in preadipocytes treated with DEX or DEX and RU486 for 24 hours. n = 4 from different culture wells. (B) Protein phosphorylation in preadipocytes induced by DEX treatment at various time points. Relative band intensities were quantified (normalized to HSP90) and are shown below the figure. (C) Protein phosphorylation in GFP- or Cre-expressed Nr3c1fl/fl primary SVF cells induced by DEX treatment. Relative band intensities were quantified (normalized to β-actin) and are shown below the figure. (D) Experimental workflow to identify glucocorticoid-induced protein phosphorylation. (E) Volcano plot illustrating DEX-induced phosphorylation alterations. (F) Motif analysis of DEX-induced phosphorylation sites. (G) GSEA analysis of DEX-induced phosphorylation sites with datasets of network_kinase_phosphotarget and network_kinase_phosphosite. (H) SGK3 deficiency attenuates DEX-induced phosphorylation of RxxS/T peptides and phosphorylation of NDRG1 at serine 330. Relative band intensities were quantified (normalized to HSP90) and are shown below the figure. Identical sample aliquots were loaded on separate gels for immunoblotting analysis in B, C, and H. Data in A are represented as mean ± SEM, and 1-way ANOVA was used for statistical analysis. ****P < 0.0001.
Figure 2
Figure 2. Sgk3-deficient mice are protected from glucocorticoid-induced obesity.
(AD) Body weight (A), fat mass (B), lean mass (C), and spleen weight (D) of vehicle or DEX-treated Sgk3+/+ and Sgk3–/– male mice over 28 days. n = 7 for Sgk3+/+ (Veh), n = 6 for Sgk3+/+ (DEX), n = 7 for Sgk3–/– (Veh), n = 8 for Sgk3–/– (DEX). (EG) Body weight (E), fat mass (F), and lean mass (G) of DEX-treated Sgk3+/+ and Sgk3–/– female mice over 28 days. n = 8 for Sgk3+/+, n = 11 for Sgk3–/–. (H–L) Body weight (H), fat mass (I), lean mass (J), pgWAT weight (K), and iWAT weight (L) of DEX-treated Sgk3fl/fl and Sgk3-iKO (inducible KO by tamoxifen) male mice over 32 days. n = 7 for each group. (MO) Body weight (M), fat mass (N), and lean mass (O) of DEX-treated Sgk3fl/fl and Sgk3-iKO female mice over 28 days. n = 5 for Sgk3fl/fl mice, n = 8 for Sgk3-iKO mice. (P) Representative images of H&E staining of pgWAT, iWAT, brown adipose tissue, and muscle of PBS- or DEX-treated Sgk3fl/fl and Sgk3-iKO female mice over 28 days. Scale bar: 100 μm. Related quantifications of adipocyte area of pgWAT and iWAT. n = 5 mice per group (>200 adipocytes are quantified for each mouse). Data in AD are represented as mean ± SEM, and 2-way ANOVA was used for statistical analysis. Data in EO are represented as mean ± SEM, and an unpaired 2-tailed t test was used for statistical analysis. Data in P are represented as mean ± SEM. *P < 0.05, **P < 0. 01.
Figure 3
Figure 3. SGK3 regulates adipogenesis.
(A) Protein level of SGK3, adiponectin, FABP4, ACC1, and HSL in 3T3-L1 preadipocytes during adipogenic differentiation. (B) mRNA level of Sgk3 in 3T3-L1 preadipocytes during adipogenic differentiation. n = 3 independent assays. (CE) Representative images of Oil Red O staining and related quantifications of differentiated Sgk3 KO (C), Sgk3 KD (D), and vehicle or SGK3 PROTAC-treated (E) preadipocytes on day 7. Scale bar: 200 μm. n = 3 independent assays. (F) Protein level of SGK3 in Sgk3 KO, KD, and SGK3 PROTAC-treated preadipocytes. (G) Protein level of ACC1, FASN, adiponectin, PPARγ, C/EBPα, and SGK3 during preadipocyte differentiation with or without SGK3 PROTAC treatment during the first 2 days. (H) Representative images of Oil Red O staining (left) and related quantifications (right) of differentiated preadipocytes with or without SGK3 PROTAC treatment during indicated times on day 7. Scale bar: 200 μm. n = 4 independent assays. (I) mRNA level of Adipoq, Cebpa, Fabp4, and Pparg during preadipocyte differentiation with or without SGK3 PROTAC treatment during the first 2 days. n = 4 samples from different culture wells. Data in B and HI are represented as mean ± SEM, and 1-way ANOVA was used for statistical analysis. Data in CE are represented as mean ± SEM, and a paired 2-tailed t test was used for statistical analysis. ns, no significance; *P < 0.05, **P < 0.01, ***P < 0.001, ****P < 0.0001.
Figure 4
Figure 4. SGK3 regulates adipogenesis independently of GR signaling.
(A) Representative images of Oil Red O staining and related quantifications of differentiated preadipocytes transfected with Ctrl or Nr3c1 siRNA and/or treated with SGK3 PROTAC on day 7. Scale bar: 200 μm. n = 4 independent assays. (B) Representative images of Oil Red O staining and related quantifications of differentiated preadipocytes treated with RU486 and/or SGK3 PROTAC on day 21. Scale bar: 200 μm. n = 3 independent assays. (C) Representative immunofluorescence images of GR in SVF cells treated as indicated. Scale bar: 50 μm. (D and E) mRNA level of Sgk1 (D) and Rasd1 (E) in preadipocytes treated with DEX, SGK3 PROTAC, and RU486 as indicated. n = 4 samples from different culture wells. (F) Representative images of Oil Red O staining of differentiated preadipocytes with or without SGK3 S486D overexpression in control and GR-deficient cells on day 7. Scale bar: 200 μm. (G) SGK3 S486D overexpression effects on protein levels of adiponectin and C/EBPα on day 3 of differentiation in control and GR-deficient cells. Identical sample aliquots were loaded on separate gels for immunoblotting analysis in Figure G. Data in A, B, D, and E are represented as mean ± SEM, and 1-way ANOVA was used for statistical analysis. ns, no significance; *P < 0.05, ***P < 0.001, ****P < 0.0001.
Figure 5
Figure 5. Glucocorticoid-induced nuclear SGK3 translocation during early stage of preadipocyte differentiation.
(A) Strategy for identifying SGK3-interacting proteins. (B) GO enrichment analysis of SGK3-interacting proteins. (C) Representative immunofluorescence images of SGK3 and lamin A&C in differentiating primary SVF cells on day 2. Scale bar: 20 μm. (D) Localization of SGK3 in the cytosol fraction and nucleus at indicated time points during preadipocyte differentiation and related quantifications (normalized to H3). n = 3 independent assays. (E) Representative immunofluorescence images of SGK3 in preadipocytes treated with MDI or DEX for 2 days. Scale bar: 20 μm. (F) Co-IP shows SGK3 and importin β1 interaction in cells treated with MDI for 3 days. (G) Co-IP shows SGK3 and importin β1 interaction in cells treated with or without MDI for 2 days. (H) DEX-induced nuclear translocation of SGK3 with or without importazole treatment and related quantifications (normalized to H3) over 2 days. n = 4 samples from different culture wells. Data in D are represented as mean ± SEM. Identical sample aliquots were loaded on separate gels for immunoblotting analysis in Figure D. Data in H are represented as mean ± SEM, and 1-way ANOVA was used for statistical analysis. *P < 0.05.
Figure 6
Figure 6. Deficiency of SGK3 impairs chromatin remodeling during preadipocyte differentiation.
(A) Representative Western blot (upper) and related quantifications (lower) of BRG1, ACTL6A, SMARCC2, SMARCB1, GR, and SGK3 in SGK3 PROTAC-treated preadipocytes. n = 4 samples from different culture wells. (B) Representative images of Oil Red O staining (left) and related quantifications (right) of differentiated preadipocytes transfected with Ctrl or Brg1 siRNA and/or treated with SGK3 PROTAC on day 7. Scale bar: 200 μm. n =3 independent assays. (C) Enrichment analysis of genes near the regions of induced BRG1 occupation during preadipocyte differentiation. (D) Heatmap of BRG1 CUT&TAG (upper) and ATAC-Seq (lower) signals with or without SGK3 PROTAC treatment during preadipocyte differentiation. (E) Quantification of BRG1 CUT&TAG signals and ATAC-Seq signals in regions of induced BRG1 occupation during preadipocyte differentiation. n = 1,158 regions. (F) BRG1 CUT&TAG and ATAC-Seq signals in the Pparg and Cebpa gene locus. Data in A are represented as mean ± SEM, and unpaired 2-tailed t test was used for statistical analysis. Data in B are represented as mean ± SEM, and 2-way ANOVA was used for statistical analysis. Identical sample aliquots were loaded on separate gels for immunoblotting analysis in A. Data in E are represented as mean and 25th to 75th percentile, and 1-way ANOVA was used for statistical analysis. ns, no significance; *P < 0.05, ***P < 0.001, ****P < 0.0001.
Figure 7
Figure 7. SGK3 regulates differentiation-associated chromatin remodeling via BRG1.
(A) Co-IP assay indicates BRG1 interaction with SGK3. (B) Direct interaction between SGK3 and BRG1 detected by GST pulldown assay. (C) Protein level of BRG1 in Sgk3 overexpression (left) or KO (right) cells. (D) mRNA level of Brg1 in SGK3 PROTAC-treated cells. n = 6 samples from different culture wells. (E and F) Representative Western blot of BRG1 protein levels (upper) and related quantifications (lower) in vehicle or SGK3 PROTAC-treated preadipocytes measured under cycloheximide (E) or bortezomib (F) treatment, n = 6 samples from different culture wells. (G) Representative Western blot of BRG1 protein levels (left) and related quantifications (right) in Sgk3fl/fl and Sgk3 APKO SVF cells expressing either kinase-dead (K191A) or constitutively active (S486D) SGK3 mutants treated with cycloheximide for 8 hours. n = 4 samples from different culture wells. (H) Ubiquitination level of Flag-BRG1 protein in HEK293T cells with or without SGK3 PROTAC treatment. (I) In vitro kinase assay shows SGK3 directly phosphorylates BRG1. (J) Intensity of 428-threonine and 1417-serine phosphorylated peptides of human BRG1 protein quantified by mass spectrometry (MS). (K) Representative Western blot of WT and T428A/S1417A mutant human BRG1 protein levels (left) and related quantifications (right) measured under cycloheximide treatment in HEK293T cells. n = 4 samples from different culture wells. (L) Ubiquitination level of WT and T428A/S1417A mutant human BRG1 proteins in HEK293T cells treated with or without SGK3 PROTAC. Data in D, E, F, G, and K represented as mean ± SEM. Unpaired 2-tailed t test used for statistical analysis in D. Two-way ANOVA used for statistical analysis in E and K. Multiple 2-tailed t tests used for statistical analysis in F. One-way ANOVA used for statistical analysis in G. Identical sample aliquots were loaded on separate gels for immunoblotting analysis in H and L. Data in J represented as value. *P < 0.05, **P < 0.01, ***P < 0.001, ****P < 0.0001.
Figure 8
Figure 8. Pharmaceutical targeting of SGK3 attenuates HFD-induced obesity in mice and adipogenesis in vivo and in human cells.
(A) Experimental workflow to examine the function of SGK3 in adipogenesis in vivo using AdipoChaser-mT/mG mice. (B) Effects of SGK3 PROTAC on adipogenesis in iWAT with or without DEX treatment. Left: representative images of iWAT sections showing preexisting (green) and newborn (red) adipocytes. Right: quantification of newborn adipocytes per field. Scale bar: 100 μm. n = 3 for PBS-vehicle and PBS-PROTAC groups, n = 5 for DEX-vehicle and DEX-PROTAC groups. (C) Experimental workflow (upper) to examine the function of SGK3 PROTAC in the treatment of HFD-induced obesity. Western blot (lower) was used for detecting SGK3 in pgWAT and iWAT of control and SGK3 PROTAC-treated mice. (DI) Body weight (D), body weight change (E), fat mass (F), lean mass (G), pgWAT weight (H), and iWAT weight (I) of mice fed with chow diet and HFD fed with or without SGK3 PROTAC treatment. n = 8 for CD-vehicle, n = 6 for HFD-vehicle and HFD-PROTAC. (J) Representative images of pgWAT of mice fed with chow diet and HFD fed with or without SGK3 PROTAC treatment. (K and L) Representative images of BODIPY staining (K) and related quantifications (L) of differentiated human preadipocytes treated with SGK3 PROTAC at indicated concentrations. Scale bar: 500 μm. n = 4 samples from different culture wells. (M) Representative Western blot and related quantifications of ACC1, C/EBPα, BRG1, GR, and SGK3 in differentiating human preadipocytes with or without SGK3 PROTAC treatment on day 3. n = 3 samples from different culture wells. Identical sample aliquots were loaded on separate gels for Western blotting analysis in M. Data in B, DI, L, and M are represented as mean ± SEM, and 1-way ANOVA was used for statistical analysis. *P < 0.05, **P < 0. 01, ***P < 0. 001, ****P < 0. 0001.

References

    1. Vandewalle J, et al. Therapeutic mechanisms of glucocorticoids. Trends Endocrinol Metab. 2018;29(1):42–54. doi: 10.1016/j.tem.2017.10.010. - DOI - PubMed
    1. Smith TJ, Hegedus L. Graves’ disease. N Engl J Med. 2016;375(16):1552–1565. doi: 10.1056/NEJMra1510030. - DOI - PubMed
    1. Oray M, et al. Long-term side effects of glucocorticoids. Expert Opin Drug Saf. 2016;15(4):457–465. doi: 10.1517/14740338.2016.1140743. - DOI - PubMed
    1. Macfarlane DP, et al. Glucocorticoids and fatty acid metabolism in humans: fuelling fat redistribution in the metabolic syndrome. J Endocrinol. 2008;197(2):189–204. doi: 10.1677/JOE-08-0054. - DOI - PubMed
    1. Thuzar M, et al. Glucocorticoids suppress brown adipose tissue function in humans: A double-blind placebo-controlled study. Diabetes Obes Metab. 2018;20(4):840–848. doi: 10.1111/dom.13157. - DOI - PubMed

MeSH terms

Substances