Exploration of Fully-Automated Body Composition Analysis Using Routine CT-Staging of Lung Cancer Patients for Survival Prognosis
- PMID: 40767951
- PMCID: PMC12327357
- DOI: 10.1002/jcsm.70021
Exploration of Fully-Automated Body Composition Analysis Using Routine CT-Staging of Lung Cancer Patients for Survival Prognosis
Abstract
Background: AI-driven automated body composition analysis (BCA) may provide quantitative prognostic biomarkers derived from routine staging CTs. This two-centre study evaluates the prognostic value of these volumetric markers for overall survival in lung cancer patients.
Methods: Lung cancer cohorts from Hospital A (n = 3345, median age 65, 86% NSCLC, 40% M1, 40% female) and B (n = 1364, median age 66, 87% NSCLC, 37% M1, 38% female) underwent automated BCA of abdominal CTs ±60 days of primary diagnosis. A deep learning network segmented muscle, bone and adipose tissues (visceral = VAT, subcutaneous = SAT, intra-/intermuscular = IMAT and total = TAT) to derive three markers: Sarcopenia Index (SI = Muscle/Bone), Myosteatotic Fat Index (MFI = IMAT/TAT) and Abdominal Fat Index (AFI = VAT/SAT). Kaplan-Meier survival analysis, Cox proportional hazards modelling and machine learning-based survival prediction were performed. A survival model including clinical data (BMI, ECOG, L3-SMI, -SATI, -VATI and -IMATI) was fitted on Hospital A data and validated on Hospital B data.
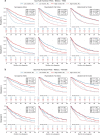
Results: In nonmetastatic NSCLC, high SI predicted longer survival across centres for males (Hospital A: 24.6 vs. 46.0 months; Hospital B: 13.3 vs. 28.9 months; both p < 0.001) and females (Hospital A: 37.9 vs. 53.6 months, p = 0.008; Hospital B: 23.0 vs. 28.6 months, p = 0.018). High MFI indicated reduced survival in males at both hospitals (Hospital A: 43.7 vs. 28.2 months; Hospital B: 28.8 vs. 14.3 months; both p ≤ 0.001) but showed center-dependent effects in females (significant only in Hospital A, p < 0.01). In metastatic disease, SI remained prognostic for males at both centres (p < 0.05), while MFI was significant only in Hospital A (p ≤ 0.001) and AFI only in Hospital B (p = 0.042). Multivariate Cox regression confirmed that higher SI was protective (A: HR 0.53, B: 0.59, p ≤ 0.001), while MFI was associated with shorter survival (A: HR 1.31, B: 1.12, p < 0.01). The multivariate survival model trained on Hospital A's data demonstrated prognostic differentiation of groups in internal (n = 209, p ≤ 0.001) and external (Hospital B, n = 361, p = 0.044) validation, with SI feature importance (0.037) ranking below ECOG (0.082) and M-status (0.078), outperforming all other features including conventional L3-single-slice measurements.
Conclusion: CT-based volumetric BCA provides prognostic biomarkers in lung cancer with varying significance by sex, disease stage and centre. SI was the strongest prognostic marker, outperforming conventional L3-based measurements, while fat-related markers showed varying associations. Our multivariate model suggests that BCA markers, particularly SI, may enhance risk stratification in lung cancer, pending centre-specific and sex-specific validation. Integration of these markers into clinical workflows could enable personalized care and targeted interventions for high-risk patients.
Keywords: body composition analysis; deep learning; lung cancer; myosteatosis; sarcopenia.
© 2025 The Author(s). Journal of Cachexia, Sarcopenia and Muscle published by Wiley Periodicals LLC.
Conflict of interest statement
Marcel Kemper received research or travel grants from Amgen, AstraZeneca, Daiichi Sankyo, Janssen‐Cilag, Novartis, Roche Pharma and Takeda Pharma.
Annalen Bleckmann received honoraria or travel grants not related to this manuscript from Bayer, BMS, Takeda, Onkowissen TV, MSD, Boehringer, AstraZeneca, Sanofi, Pfizer, Streamedup, Lilly, Art Tempi, Amgen, RG GmbH, Roche, Novartis, Digimed Verlag, Janssen, DGHO Juniorakademie, Ärztekammer, Pius Hospital Osnabrück, St. Johannes Hospital DO, WTZ, Daiichi, FOMF and Knappschaftskrankenhaus Bochum.
Annalen Bleckmann participated on a Data Safety Monitoring Board or Advisory Board from Bayer, BMS, Takeda, Onkowissen TV, MSD, Boehringer, AstraZeneca, Sanofi, Pfizer, Streamedup, Lilly, Art Tempi, Amgen, RG GmbH, Roche, Novartis, Digimed Verlag, Janssen, Daiichi.
Marcel Opitz received honoraria for Advisory Board not related to this manuscript from Insmed.
Apart from this, the authors declare that they have no known competing financial interests or personal relationships that could have appeared to influence the work reported in this paper.
Figures


References
-
- World Health Organization . “Global Cancer Observatory: Cancer Today. Cancer Today”. 2020. Accessed August 1, 2023, https://gco.iarc.fr/today/home.
-
- Siegel R. L., Miller K. D., and Jemal A., “Cancer Statistics, 2020,” CA: A Cancer Journal for Clinicians 70, no. 1 (2020): 7–30. - PubMed
-
- Herbst R. S., Morgensztern D., and Boshoff C., “The Biology and Management of Non‐Small Cell Lung Cancer,” Nature 553, no. 7689 (2018): 446–454. - PubMed
-
- Wang M., Herbst R. S., and Boshoff C., “Toward Personalized Treatment Approaches for Non‐Small‐Cell Lung Cancer,” Nature Medicine 27, no. 8 (2021): 1345–1356. - PubMed
-
- Prado C., Maia Y., Ormsbee M., Sawyer M., and Baracos V., “Assessment of Nutritional Status in Cancer—The Relationship Between Body Composition and Pharmacokinetics,” Anti‐Cancer Agents in Medicinal Chemistry 13, no. 8 (2013): 1197–1203. - PubMed
Publication types
MeSH terms
Grants and funding
LinkOut - more resources
Full Text Sources
Medical
Research Materials

