. 2025 Aug 26;44(8):116123.
doi: 10.1016/j.celrep.2025.116123. Epub 2025 Aug 5.

CD138 and APRIL regulate plasma cell survival, competition, and retention in the bone marrow niche

Affiliations

CD138 and APRIL regulate plasma cell survival, competition, and retention in the bone marrow niche

Rosa Park et al. Cell Rep. .

Abstract

Durable serological protection is maintained through the persistence of antigen-specific plasma cells (PCs), but key factors regulating the survival of nascent PCs remain unclear. Previously, we reported that bone marrow (BM) PCs partially organize into clusters that are enriched for long-lived PCs, suggesting that clusters are survival niches. Here, we report that acute blockade of a proliferation-inducing ligand (APRIL) and B cell activating factor (BAFF) using transmembrane activator and CAML interactor (TACI)-Fc rapidly disrupts clusters and mobilizes BM PCs. CD138, a surface co-receptor that is abundant on PCs and binds APRIL but not BAFF, regulates PC retention in the BM and adhesion and motility on fibronectin. Cell-intrinsic CD138 levels control competition for survival between nascent CD138low PCs and mature CD138high PCs, and enhanced survival of CD138high PCs correlates with retention in clusters. Collectively, these results indicate that PC clusters are survival niches and that dynamic competition between new and pre-existing PCs regulates the survival of new PCs and the durability of antibody responses.

Keywords: APRIL; CD138; CP: Immunology; bone marrow; long-lived plasma cells; plasma cells.


Conflict of interest statement

Declaration of interests The authors declare no competing interests.

Figures
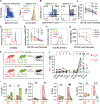
Figure 1.
Figure 1.. CD138 confers functional and cell-intrinsic advantages to BM PCs
(A) Gating of CD138highB220 PCs in BM samples, followed by breakdown of PCs into CD138-level percentiles. (B) Representative flow plots of CD93 and CD98 expression by BM PCs with the lowest 10% and highest 10% of CD138 levels. (C, E, and G) Frequency of PCs that are CD93+CD98+ (C), normalized 2-NBDG uptake (E), and CXCR4 levels (G) among BM PCs in indicated CD138-level percentiles. (D and F) Representative histograms of 2-NBDG uptake (D) and CXCR4 levels (F) among BM PCs according to indicated CD138 level percentiles. (H) Schematic for generating CD138 mixed BM chimeras. (I) Frequencies of indicated cell types out of total live BM cells in Tom+ or Tom compartments within individual chimeras. Data from Tom+WT:WT and Tom+WT: KO chimeras are on the left and right of the dotted midline, respectively. (J) Total live BM cells from chimeras were separated into Tom+ and Tom compartments, and Tom+:Tom count ratios were calculated for total live cells (‘‘total’’) and indicated cell types. Each datapoint represents one mouse, and data from the same mouse are connected by lines (C, E, G, I, and J). Lines on floating bars represent the minimum, mean, and maximum (I). Data are pooled from two or more independent experiments. *p < 0.05, **p < 0.01, ***p < 0.001, ****p < 0.0001, and ns, not significant by paired ANOVA (C, E, and G) or paired t test (I and J). (C) n = 23; (E) n = 14; (G) n = 6; (I and J) n = 8–10; n = 3 for LLPC data, which are from one experiment. See also Figure S1.
Figure 2.
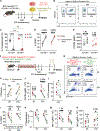
Figure 2.. CD138 promotes cell-intrinsic maturation and survival of BM PCs in competitive settings
(A) Experimental setup for measuring steady-state PC turnover rates in CD138+/+ and CD138−/− mice. (B) Representative flow plots of timestamped and non-labeled (bulk) PC populations at days 5 and 90. (C) Percentage of timestamped PCs out of total PCs on days 5 and 90 in CD138+/+ and CD138−/− mice. Data are presented as mean ± SEM. (D and E) CD93+ percentage (D) and surface CXCR4 levels (E) of timestamped PCs. CD93+ percentage increases and fold increases of CXCR4 levels in CD138+/+ PCs relative to CD138−/− PCs are indicated. (F) Experimental setup for generating timestamping CD138 mixed BM chimeras and assessing turnover of timestamped PCs. (G) Representative flow plots of timestamped BM PCs from chimeric compartments on days 5 and 30. (H) Chimerism–defined as CD138+/+:CD138−/− compartment cell count ratios–for total live BM cells and timestamped PCs. (I and J) CD93+ percentage (I) and surface CXCR4 levels (J) of timestamped PCs. (K) Absolute numbers of timestamped BM PCs, per leg. (L) Percentage of timestamped BM PCs remaining on day 30 relative to mean day 5 values. (M and N) Intracellular Mcl-1 (M) and Bcl-2 (N) levels of timestamped PCs. Each datapoint represents one mouse, and data from the same mice are connected by lines (C–E and H–N). Data are pooled from two independent experiments. *p < 0.05, **p < 0.01, ***p < 0.001, ****p < 0.0001, and ns, not significant by paired t test (D, E, and H–N) or unpaired t test (C). (C) n = 3–10; (D and E) n = 8; (H–N) n = 7.
Figure 3.
Figure 3.. Higher CD138 levels confer a survival advantage to nascent vaccine-generated PCs
(A) Schematic for adoptive transfer immunizations. (B) Representative histogram of CD138 expression by endogenous PCs in B6 and B6 HET hosts. (C) Gating for vaccine-generated BHY PCs and WT donor and HET donor subsets. (D) CD138 levels of indicated PCs 2 weeks post-immunization. Mean levels of donor-derived PCs are summarized as percentages of mean host PC levels. (E) Numbers of WT BHY PCs and HET BHY PCs in BM harvested from two legs of B6 and B6 HET hosts. (F) Bcl-2 levels in WT BHY PCs and HET BHY PCs in B6 and B6 HET hosts. Each datapoint represents one mouse, and data from the same mouse are connected by lines (D–F). Lines on floating bars represent the minimum, mean, and maximum (D and F). Data are pooled from two or more independent experiments. *p < 0.05, **p < 0.01, ***p < 0.001, ****p < 0.0001, and ns, not significant by paired t test (D–F). (D) n = 7–10; (E, left) n = 13–23; (E, right) n = 15–19; (F) n = 9–11.
Figure 4.
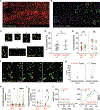
Figure 4.. CD138 controls entry of PCs into survival niches
(A) Representative BM tile from a Tom+WT:KO chimera. Blimp1-YFP+ PCs and tdTomato+ BM cells are in green and red channels, respectively. Scale bar, 100 μm. (B) DBSCAN-processed version of (A). Magenta spots represent non-clustered PCs, and non-magenta spots represent clustered PCs. Different colors indicate distinct clusters. (C) Zoomed-in views of boxed regions in (B). Yellow spots represent Tom+WT PCs, and green spots represent KO PCs. Scale bar, 20 μm. (D) Percentage of total YFP+ PCs in clusters in chimeras. Data are presented as mean ± SD. (E) Percentage of each chimeric PC subset in clusters. Data from Tom+WT:WT and Tom+WT:KO chimeras are on the left and right of the dotted midline, respectively. (F) Time-lapse images highlighting migration trajectories of Tom+WT and KO PCs in a Tom+WT:KO chimera. Scale bar, 50 μm. Time is shown as h:min:s. (G) Tracks of all Tom+WT and KO PCs plotted at a common origin from the Tom+WT:KO chimera in (F). (H) Track displacement velocities of individual PCs. Bars indicate means. (I) Average displacement velocity of chimeric PC subsets on a per-mouse basis. (J) Mean-squared displacement (MSD) rates of chimeric PC subsets, pooled from 4 chimeras each. Lines represent mean values. Each datapoint represents one mouse (D, E, and I) or cell (H), and data from the same mouse are connected by lines (E and I). Data are pooled from two or more independent experiments. *p < 0.05, **p < 0.01, ****p < 0.0001, and ns, not significant by unpaired t test (D and H), paired t test (E and I), or ANCOVA comparing slopes of simple linear regression analyses (J). (D and E) n = 6–8; (H) n = 56–214; (I and J) n = 4.
Figure 5.
Figure 5.. CD138 promotes retention of BM PCs and adhesion and motility on fibronectin
(A) Experimental design. (B and C) PC and PB numbers (B) and frequencies (C) out of total live cells in 50 μL blood before and after treatments. (D) Representative fluorescence and corresponding IRM images of Blimp1-YFP+ PBs. Adherent PBs and corresponding IRM signals are indicated by magentafilled arrowheads. The far-right PB is non-adherent, based on the lack of a corresponding IRM signal in the space indicated by the white-filled arrowhead. Scale bar, 20 μm. (E) Individual IRM cell tracks plotted from a common origin of WT, KO, and αCD138-treated WT PBs on fibronectin- or VCAM-1-coated glass from one representative time-lapse movie each. (F and G) Percentage of adhered cells (F) and displacement velocities (G) for WT, KO, and αCD138-treated WT PBs imaged on fibronectin- or VCAM-1-coated glass. Each datapoint represents one mouse (B and C), movie (F), or cell (G), and data from the same mouse are connected by lines (B and C). Data are presented as mean ± SEM (F and G). Data are pooled from two or more independent experiments. *p < 0.05, **p < 0.01, ****p < 0.0001, and ns, not significant by paired t test (B and C) or unpaired t test (F and G). (B and C) n = 5; (F) n = 3–5; (G) n = 30–132. See also Figure S2.
Figure 6.
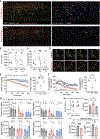
Figure 6.. APRIL and BAFF maintain PCs in their survival niche
(A) Representative BM tiles from before and after TACI-Fc treatment. Left: Blimp1-YFP+ PCs and autofluorescence are in the green and red channels, respectively. Right: DBSCAN-processed tiles. Scale bars, 100 μm. (B and C) PC counts per mm3 of BM (B) and percentage of PCs in clusters (C) in tiles before and after treatments. (D) Time-lapse images of PC clusters, encircled in yellow, after treatments. Scale bars, 25 μm. Time is shown as h:min:s. (E and F) Left, number of total PCs (E) or PCs in clusters (F) over time, as a percentage of initial, in time-lapse images after treatments. Data are pooled from 3 mice per condition and presented as mean ± SEM. Right, percentage of initial total PCs (E) or clustered PCs (F) left 4 h after treatments. (G) PC and PB counts in BM (2 legs) and SP harvested from treated or untreated mice. (H) Blimp1-YFP+ ASC (PCs and PBs) frequency out of total live cells in 50 μL blood before and 24 h after treatments. (I) IκBα levels in BM PCs 6 h after treatments. (J) Bcl-2 and Mcl-1 levels in BM PCs 24 h after treatments. Each datapoint represents one mouse (B, C, E, and F, right sides, and G–J), and data from the same mouse are connected by lines (B, C, and H). Data are presented as mean ± SD (E and F, right sides, G, I, and J). Data are pooled from two or more independent experiments (B–C and E–G) or show one representative experiment (H–J). *p < 0.05, **p < 0.01, ***p < 0.001, and ns, not significant by paired t test (B and C), ratio paired t test (H), or unpaired t test (E and F, right sides, G, I, and J). (B and C) n = 3–4; (E and F) n = 3; (G) n = 4–6; (H) n = 5–6; (I and J) n = 3–5. See also Figure S3.

References

    1. Manz RA, Hauser AE, Hiepe F, and Radbruch A (2005). Maintenance of serum antibody levels. Annu. Rev. Immunol 23, 367–386. 10.1146/annurev.immunol.23.021704.115723. - DOI - PubMed
    1. Slifka MK, Antia R, Whitmire JK, and Ahmed R (1998). Humoral immunity due to long-lived plasma cells. Immunity 8, 363–372. - PubMed
    1. Fooksman DR, Jing Z, and Park R (2024). New insights into the ontogeny, diversity, maturation and survival of long-lived plasma cells. Nat. Rev. Immunol 24, 461–470. 10.1038/s41577-024-00991-0. - DOI - PubMed
    1. Tangye SG (2011). Staying alive: regulation of plasma cell survival. Trends Immunol 32, 595–602. 10.1016/j.it.2011.09.001. - DOI - PubMed
    1. Kunkel EJ, and Butcher EC (2003). Plasma-cell homing. Nat. Rev. Immunol 3, 822–829. 10.1038/nri1203. - DOI - PubMed

Substances

LinkOut - more resources