. 2025 Aug 6:14:RP102392.
doi: 10.7554/eLife.102392.

Acute aerobic exercise intensity does not modulate pain potentially due to differences in fitness levels and sex effects: results from a pharmacological fMRI study

Affiliations

Acute aerobic exercise intensity does not modulate pain potentially due to differences in fitness levels and sex effects: results from a pharmacological fMRI study

Janne Ina Nold et al. Elife. .

Abstract

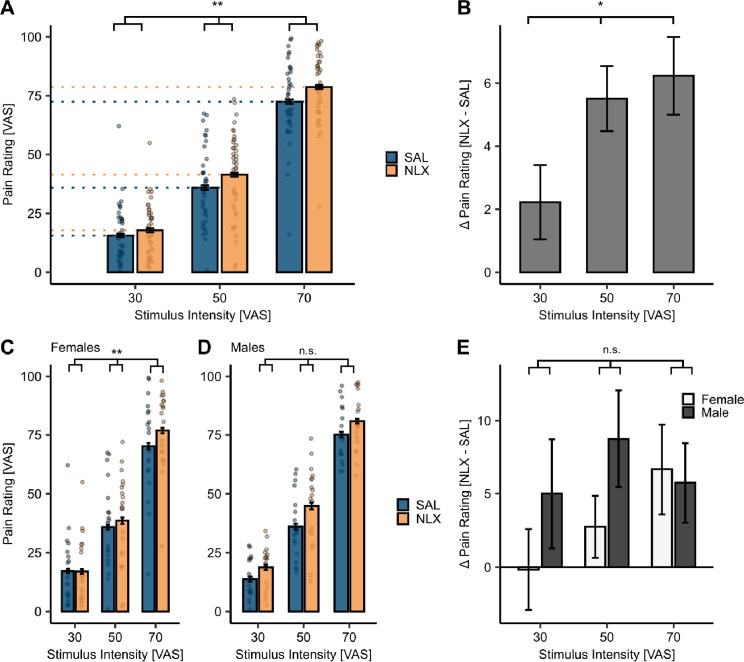
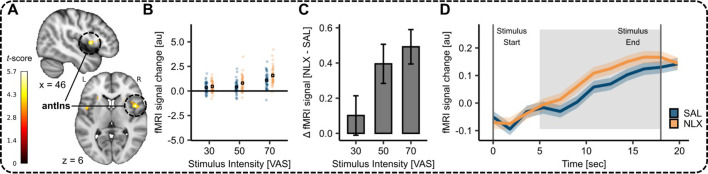
Exercise might lead to a release of endogenous opioids, potentially resulting in pain relief. However, the neurobiological underpinnings of this effect remain unclear. Using a pharmacological within-subject functional magnetic resonance imaging (fMRI) study with the opioid antagonist naloxone and different levels of aerobic exercise and pain, we investigated exercise-induced hypoalgesia (N = 39, 21 female). Overall, high-intensity (HI) aerobic exercise did not reduce pain as compared to low-intensity aerobic exercise. Accordingly, we observed no significant changes in the descending pain modulatory system. The µ-opioid antagonist naloxone significantly increased overall pain ratings but showed no interaction with exercise intensity. An exploratory analysis suggested an influence of fitness level (as indicated by the functional threshold power) and sex, where males showed greater hypoalgesia after HI exercise with increasing fitness levels. This effect was attenuated by naloxone and mirrored by fMRI signal changes in the medial frontal cortex, where activation also varied with fitness level and sex, and was reversed by naloxone. These results indicate that different aerobic exercise intensities have no differential effect on pain in a mixed population sample, but individual factors such as fitness level and sex might play a role. The current study underscores the need for personalised exercise interventions to enhance pain relief in healthy as well as chronic pain populations, taking into account the sex and fitness status as well as the necessity to further investigate the opioidergic involvement in exercise-induced pain modulation.

Keywords: exercise; human; hypoalgesia; medicine; naloxone; neuroimaging; neuroscience; opioids; pain.

Plain language summary

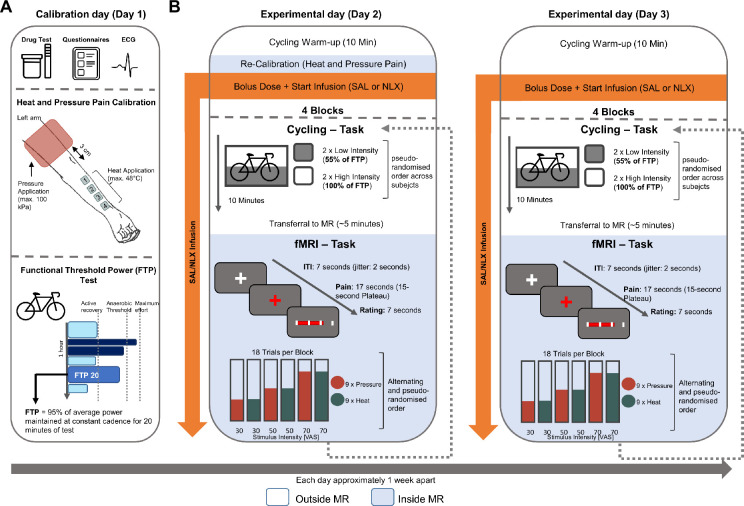
Many people turn to exercise as a way to relieve pain, hoping it will help them feel better. One reason this might work is because exercise can release natural chemicals in the body, called endogenous opioids, which help reduce pain. However, scientists still do not fully understand how this process works. Nold et al. explored how different levels of aerobic exercise – such as low vs. high intensity – affect how people feel pain. They used brain imaging and a medication called naloxone, which blocks the body’s opioid system, to better understand what is happening in the brain during exercise. The study included 39 healthy adults and looked at how factors like fitness level and sex might influence the effects of exercise on pain and how participants perceived pain. To determine whether high-intensity exercise provides more pain relief than low-intensity exercise, Nold et al. studied 18 males and 21 females during both high- and low-intensity exercises. Following the workout, magnetic resonance imaging was used to study brain activity as the participants received nine painful heat and pressure stimuli. Throughout the entire experiment, participants received a constant dose of either naloxone or a saline solution as a control. The study found that high-intensity exercise did not reduce pain any more than low-intensity exercise in the overall group. There were no major changes in how pain was processed in the brain and blocking the body’s opioids with naloxone made pain feel worse, regardless of how hard the participants exercised. However, more detailed analyses revealed that males with higher fitness levels experienced more pain relief after intense exercise than females. However, this effect disappeared when naloxone was given. Brain scans showed this was linked to activity in a part of the brain called the medial frontal cortex. These findings suggest that exercise may help reduce pain for some people more than others – especially depending on their sex and fitness level. In the future, personalized exercise programs could be developed to help manage pain more effectively. But before that can happen, more research is needed to understand exactly how the body’s natural pain-relief systems work during exercise, and how they differ between individuals.


Conflict of interest statement

JN, TF No competing interests declared, CB Senior editor, eLife

Figures

Figure 1.
Figure 1.. Experimental design.
(A) Calibration day (Day 1) with heat and pressure pain calibration and functional threshold power (FTP) test (see Supplementary file 1a). (B) Experimental days (Days 2 and 3) with cycling task (outside MR) and functional magnetic resonance imaging (fMRI) task (inside MR) with the only difference in the drug treatment administered (SAL or NLX). ITI = inter-trial interval; VAS = visual analogue scale.
Figure 1—figure supplement 1.
Figure 1—figure supplement 1.. Effect of exercise intensity, drug treatment, and sex on pressure pain modulation.
(A) Pressure pain ratings pooled across all stimulus intensities in the SAL (blue) and NLX (orange) conditions at low and high exercise intensity. There was no hypoalgesic effect evident in the behavioural pain ratings comparing high-intensity (HI) to low-intensity (LI) exercise in the SAL condition (β = 0.57, CI [–1.73, 2.86], SE = 1.17, t(1354) = 0.48, p = 0.63; blue bars) as well as no interaction of drug treatment and exercise intensity on pressure pain ratings (β = –1.43, CI [–4.87, 2.01], SE = 1.75, t(2756.02) = –0.82, p = 0.42). Bars depict the mean ratings in the SAL and NLX conditions at both exercise intensities averaged across all stimulus intensities. Individual data points depict subject-specific mean pain ratings. Error bars depict the SEM (N = 39). (B) Subject-specific differences in pressure pain ratings (dots) between LI and HI exercise conditions (LI – HI exercise pain ratings) and corresponding regression line pooled across all stimulus intensities in the SAL condition. Fitness level (functional threshold power; FTP) showed no significant relation to pressure pain ratings (r = 0.25, p = 0.13) and no significant main effect of FTP (β = 3.16, CI [–1.64, 7.97], SE = 2.37, t(38) = 1.34, p = 0.19) on difference ratings. No significant interaction of drug treatment, exercise intensity, and sex on difference pain ratings β = −7.97, CI [–18.67, 2.73], SE = 5.51, t(190) = –1.45, p = 0.15 with exercise-induced pain modulation in the (C) SAL and (D) NLX condition showing no significant difference between males (red) and females (blue). In the NLX condition, males show a trend where, with increasing fitness levels (FTP), the hypoalgesic response diminished.
Figure 1—figure supplement 2.
Figure 1—figure supplement 2.. Distribution of weight-corrected functional threshold power (FTP) for both sexes.
Histogram for distribution of weight-corrected FTP for males (orange) and females (green).
Figure 2.
Figure 2.. Behavioural and functional magnetic resonance imaging (fMRI) results for successful pain induction.
(A) Heat pain ratings in the SAL condition for all stimulus intensities (visual analogue scale [VAS] 30, 50, 70) showed a significant main effect of stimulus intensity (p < 2 × 10–16). The p-value reflects the significant main effect of stimulus intensity from the linear mixed effect model (LMER). Significant activation for the parametric effect (heat VAS 70 > 50 > 30) in the SAL condition in the (B) right antIns (MNIxyz: 36, 6, 14; T = 10.35, pcorr-WB < 0.001), (C) right dpIns (MNIxyz: 39, –15, 18, T = 7.65, pcorr-WB < 0.001), and (D) right middle cingulate cortex (MCC) (MNIxyz: 6, 10, 39; T = 7.47, pcorr-WB = 0.001). Displayed are the uncorrected activation maps (puncorr < 0.001) for visualisation purposes. (E–G) Bars depict mean parameter estimates from the respective peak voxels for all stimulus intensities across participants, whereas dots display subject-specific mean parameter estimates at the respective stimulus intensity. p-values were calculated using the LMER model for the fixed effect of stimulus intensity. *p < 0.05, **p < 0.01, ***p < 0.001. Error bars depict SEM (N = 39).
Figure 2—figure supplement 1.
Figure 2—figure supplement 1.. Uncorrected activation map for parametric contrast (visual analogue scale [VAS] 70 > 50 > 30) of heat pain in saline (SAL) condition (p < 0.001).
Blood oxygenation level-dependent (BOLD) activation at p < 0.001 uncorrected superimposed onto mean T1 along 134 slices (2 slice steps) in the z-axis.
Figure 3.
Figure 3.. Successful implementation of high- (HI) and low-intensity (LI) exercise.
(A) Relative power (%FTP), (B) heart rate in beats per minute (bpm), and (C) rating of perceived exertion (RPE; BORG scale) during LI- (green) and HI- (purple) cycling were all significantly different. p-values were calculated using a paired t-test (two-tailed, power: N = 38, heart rate: N = 34, BORG: N = 39). *p < 0.05, **p < 0.01, ***p < 0.001.
Figure 3—figure supplement 1.
Figure 3—figure supplement 1.. Expectation of acute exercise on pain.
(A) Ratings for acute exercise on different pain types and ranging between –3 (large decrease) and 3 (large increase) with 0 denoting ‘no effect’. There was no significant effect for muscle pain (t(38) = 1.78, p = 0.08, M = 0.39, SE = 0.12), joint pain (t(38) = –0.12, p = 0.90, M = –0.03, SE = 0.11), or whole-body pain (t(38) = –1.05, p = 0.30, M=–0.21, SE = 0.12) suggesting there to be no expectation effect on these pain domains in the overall sample. Boxplots depict the distribution of the data with dots depicting subject-specific expectation ratings. Black dots depict the mean expectation ratings averaged across subjects and error bars depict the SEM. (B) Correlation between difference pain ratings (LI − HI exercise intensity) in the saline (SAL) condition and expectation ratings with each facet depicting a different pain type for each subject (dot). This analysis yielded no significant correlation in either of the pain domains (joint pain: r = 0.11, p = 0.49; muscle pain: r = –0.07, p = 0.68; whole-body pain: r = 0.07, p = 0.68). Regression lines are visualised and shaded areas represent the SEM (N = 39).
Figure 4.
Figure 4.. Behavioural results for the effect of drug treatment on pain.
(A) Heat pain ratings revealed a significant interaction between drug and stimulus intensity (p = 0.01). Mean heat pain ratings were significantly higher under naloxone (NLX) treatment (orange) compared to placebo (SAL) (blue) across stimulus intensities. The p-value indicates a significant interaction effect of stimulus intensity and drug. (B) Differences in heat pain ratings between NLX and SAL condition (NLX – SAL) at each stimulus intensity revealed a significant main effect of stimulus intensity (p = 0.02). (C, D) Heat pain ratings at all stimulus intensities in both drug treatment conditions are significantly higher in NLX (orange) compared to SAL (blue) conditions for both sexes. In females (C), a significant interaction of stimulus intensity and drug was evident (p = 0.003) but not in (D) males (p = 0.75). (E) Differences in heat pain ratings between NLX and SAL condition (NLX – SAL) at each stimulus intensity for females (white) and males (dark grey) revealed a significant main effect of stimulus intensity (p = 0.003) and sex (p = 0.03) with an interaction showing a trend (p = 0.06). p-values were calculated using the LMER model for the interaction of stimulus intensity and drug. *p < 0.05, **p < 0.01, ***p < 0.001. Error bars depict the SEM (N = 39).
Figure 5.
Figure 5.. Effect of NLX in the periaqueductal grey (PAG).
(A) Activation for the interaction of stimulus intensity and drug in the PAG (MNIxyz: −2, –24, –8, T = 5.17, pcorr-SVC = 0.01) superimposed onto an MNI template brain. (B) Parameter estimates for SAL (blue) and NLX (orange) conditions for the respective peak voxel in the PAG (MNIxyz: −2, –24, –8). (C) Difference between parameter estimates of the peak voxel between NLX and SAL condition at each stimulus intensity. (D) Time course of blood oxygenation level-dependent (BOLD) responses for SAL (blue) and NLX (orange) during high pain (visual analogue scale [VAS] 70) in this voxel. The shaded areas depict the SEM. The grey solid lines indicate the start and end of the painful stimulus. The shaded grey area displays the approximate time window for BOLD response taking into account a 5-s delay of the haemodynamic response function.
Figure 5—figure supplement 1.
Figure 5—figure supplement 1.. Uncorrected activation map for contrast interaction stimulus intensity and drug treatment (p < 0.001).
Blood oxygenation level-dependent (BOLD) activation at p < 0.001 uncorrected superimposed onto mean T1 along 134 slices (2 slice steps) in the z-axis.
Figure 5—figure supplement 2.
Figure 5—figure supplement 2.. Cortical drug treatment effect in the anterior insula.
(A) Activation for contrast: heat NLX > heat SAL in the right anterior insula (MNIxyz: 46, 8, 6; T = 5.70, pcorr-WB = 0.08) superimposed onto MNI template brain along x and z dimensions. (B) Parameter estimates for saline (blue) and naloxone (orange) conditions for the respective peak voxel in the right anterior insula (MNIxyz: 46, 8, 6). Individual dots indicate subject-specific mean parameter estimates whereas solid dots indicate the overall mean for drug treatment conditions at stimulus intensity. (C) Difference between parameter estimates of the respective peak voxels between naloxone and saline condition at each stimulus intensity. (D) Time course of blood oxygenation level-dependent (BOLD) response for saline (blue) and naloxone (orange) condition for heat pain at visual analogue scale (VAS) 70 in the respective peak voxels. The shaded areas around the curves represent the standard error of the mean (n = 39). The grey solid lines indicate stimulus start and stimulus end, and the shaded grey area displays the approximate time window for BOLD response (5 s after stimulus onset).
Figure 6.
Figure 6.. Effect of exercise intensity and drug treatment on pain modulation.
(A) No significant main effect of exercise intensity on pain ratings in the SAL condition (p = 0.44, blue bars). The p-value was calculated using the LMER model with exercise intensity. In a separate LMER model for the interaction of exercise intensity and drug treatment, this interaction effect was not significant (p = 0.91) but a significant main effect of drug treatment (p = 0.005) was evident. Bars depict the average pain ratings in the SAL (blue) and NLX (orange) conditions in both exercise conditions averaged across all stimulus intensities and the dots represent the subject-specific average ratings averaged across all stimulus intensities. Error bars depict the SEM (N = 39). Regions of interest (ROIs) in the (B) rostral ventral medulla (RVM), (C) periaqueductal grey (PAG), and (D) frontal midline (comprised of anterior cingulate cortex [ACC] and ventromedial prefrontal cortex [vmPFC]). (E–G) Parameter estimates extracted from both exercise and treatment conditions for the respective ROIs showed no significant effect of exercise intensity in the SAL condition (Supplementary file 1l–n) as well as no interaction of stimulus intensity with drug treatment (Supplementary file 1p–r). n.s. = not significant, *p < 0.05, **p < 0.01, ***p < 0.001.
Figure 6—figure supplement 1.
Figure 6—figure supplement 1.. Uncorrected activation map for contrast exercise high > low of heat pain in saline (SAL) condition (p < 0.01).
Blood oxygenation level-dependent (BOLD) activation at p < 0.01 uncorrected superimposed onto mean T1 along 134 slices (2 slice steps) in the z-axis.
Figure 6—figure supplement 2.
Figure 6—figure supplement 2.. Uncorrected activation map for contrast exercise low > high in heat pain in saline (SAL) condition (p < 0.01).
Blood oxygenation level-dependent (BOLD) activation at p < 0.01 uncorrected superimposed onto mean T1 along 134 slices (2 slice steps) in the z-axis.
Figure 6—figure supplement 3.
Figure 6—figure supplement 3.. Effect of exercise intensity and drug treatment on heat pain ratings at different stimulus intensities (visual analogue scale [VAS] 30, 50, 70).
Bars depict the mean ratings in the saline (SAL; blue) and naloxone (NLX; orange) conditions. Individual data points depict subject-specific mean pain ratings. Error bars depict the SEM. The LMER was extended to include the stimulus intensity and yielded a significant main effect of stimulus intensity (β = 1.39, CI [1.31, 1.47], SE = 0.04, t(2753.12) = –34.082, p < 0.001) and a significant interaction of stimulus intensity and drug treatment (β = 0.12, CI [0.01, 0.24], SE = 0.06, t(2751) = 2.13, p = 0.03), but no significant interaction of exercise intensity, drug treatment, and stimulus intensity (β = –0.05, CI [–0.20, 0.11], SE = 0.08, t(2751) = –0.56, p = 0.58).
Figure 6—figure supplement 4.
Figure 6—figure supplement 4.. Uncorrected activation map for contrast interaction exercise intensity and drug treatment (pos) of heat pain (p < 0.01).
Blood oxygenation level-dependent (BOLD) activation at p < 0.01 uncorrected superimposed onto mean T1 along 134 slices (2 slice steps) in the z-axis.
Figure 6—figure supplement 5.
Figure 6—figure supplement 5.. Uncorrected activation map for contrast interaction exercise intensity and drug treatment (neg) of heat pain (p < 0.01).
Blood oxygenation level-dependent (BOLD) activation at p < 0.01 uncorrected superimposed onto mean T1 along 134 slices (2 slice steps) in the z-axis.
Figure 7.
Figure 7.. Fitness level on difference pain ratings (LI − HI exercise) and medial frontal cortex (mFC) activation.
(A) Subject-specific differences in heat pain ratings (dots) between low-intensity (LI) and high-intensity (HI) exercise conditions (LI – HI exercise pain ratings) and corresponding regression line pooled across all stimulus intensities in the SAL condition. Fitness level (functional threshold power; FTP) showed a significant positive relation to heat pain ratings with a significant main effect of FTP (p = 0.02) on difference ratings. (B) Cortical activation for contrast: exercise high > exercise low with mean-centred covariate FTP (weight-corrected) in the right mFC (MNIxyz: 6, 45, 10; T = 4.59, pcorr-SVC = 0.05) across all stimulus intensities in the SAL condition superimposed onto an MNI template brain. (C) Differences between parameter estimates of LI and HI exercise conditions (LI – HI exercise parameter estimates) from respective peak voxel, plotted for each subject as a function of fitness level (FTP). Regression lines are visualised and shaded areas represent the SEM (N = 39).
Figure 7—figure supplement 1.
Figure 7—figure supplement 1.. Effect of exercise intensity and fitness level on absolute pain ratings and medial frontal cortex (mFC) activation.
(A) Subject-specific heat pain ratings (dots) between low-intensity (LI, green) and high-intensity (purple) exercise conditions and corresponding regression lines pooled across all stimulus intensities in the saline condition. (B) Cortical activation for contrast: exercise high > exercise low with mean-centred covariate functional threshold power (FTP; weight-corrected) in right mFC (MNIxyz: 6, 45, 10; T = 4.59, pcorr-SVC = 0.05) across all stimulus intensities in the saline condition superimposed onto the MNI template brain. (C) Parameter estimates of LI (green) and HI (purple) exercise conditions from respective peak voxel plotted for each subject depending on fitness levels (FTP) and pooled across stimulus intensities.
Figure 7—figure supplement 2.
Figure 7—figure supplement 2.. Uncorrected activation map for contrast exercise high > exercise low intensity with covariate functional threshold power (FTP) in saline condition (p < 0.001).
Blood oxygenation level-dependent (BOLD) activation at p < 0.001 uncorrected superimposed onto mean T1 along 134 slices (2 slice steps) in the z-axis.
Figure 7—figure supplement 3.
Figure 7—figure supplement 3.. Small volume correction mask based on preregistered regions of interest (ROIs).
Small volume correction mask with 1 mm smoothing in MNI space superimposed onto MNI template with slices along x- (top) and z-axis (bottom). Colour codes are according to ROI: red = rostral ventral medulla (RVM); yellow = frontal midline comprises anterior cingulate cortex (ACC) and ventromedial prefrontal cortex (vmPFC); green = periaqueductal grey (PAG).
Figure 8.
Figure 8.. Exercise-induced pain modulation potentially depends on sex, fitness level, and drug treatment in medial frontal cortex (mFC).
(A) Exercise-induced pain modulation in the SAL condition for males (red) and females (blue). Males showed larger hypoalgesic responses with increasing fitness levels as indicated by positive difference ratings in the SAL condition. Females showed no association between fitness levels and difference ratings. (B) No exercise-induced pain modulation after blocking µ-opioid receptors with NLX in males (red) and females (blue). (C) The activation pattern in the mFC (MNIxyz: 12, 64, 2; T = 4.78, pcorr-SVC = 0.039) resulting from a two-sample t-test (two-tailed) between males and females for contrast interaction of exercise and drug with covariate functional threshold power (FTP) superimposed onto an MNI template brain. The difference in parameter estimates from the peak voxel in the mFC in (D) SAL and (E) NLX condition for males (red) and females (blue). Each dot represents the difference in parameter estimates between LI and high-intensity (HI) exelow-intensityrcise conditions (LI – HI exercise) for each subject averaged across all stimulus intensities. Shaded areas represent the SEM (female: N = 21, male: N = 18).
Figure 8—figure supplement 1.
Figure 8—figure supplement 1.. Uncorrected activation map for two-sample t-test between males and females for contrast: interaction exercise and drug with covariate functional threshold power (FTP; p < 0.001).
Blood oxygenation level-dependent (BOLD) activation at p < 0.001 uncorrected superimposed onto mean T1 along 134 slices (2 slice steps) in the z-axis.
Author response image 1.
Author response image 1.. Heat (A) and Pressure (B) pain ratings in the saline (SAL) condition for pre (purple) and post (turquoise) exercise pain ratings at LI and HI exercise and all stimulus intensities (VAS 30, 50, 70).
The bars depict the mean pain rating pre and post-exercise and the dots depict the subject-specific mean ratings. The error bars depict the SEM.
Author response image 2.
Author response image 2.. Heat pain ratings at different intensities (30, 50, and 70 VAS) in different study samples.
Bars depict the mean ratings in the saline (SAL) condition. Individual data points depict subject-specific mean pain ratings. Error bars depict the SEM.
Author response image 3.
Author response image 3.. Pressure pain ratings in the SAL condition at stimulus intensity (VAS 30, 50, and 70).
Bars depict the mean ratings in the saline (SAL) condition. Individual data points depict subject-specific mean pain ratings. Error bars depict the SEM.
Author response image 4.
Author response image 4.. Fitness level on difference pain ratings (LI-HI exercise) without subjects with highest and lowest FTP (N = 37).
(A) Subject-specific differences in heat pain ratings (dots) between LI and HI exercise conditions (LI – HI exercise pain ratings) and corresponding regression line pooled across all stimulus intensities in the SAL condition. Fitness level (FTP) showed a significant positive relation to heat pain ratings with a significant main effect of FTP (P = 0.039) on difference ratings.
Author response image 5.
Author response image 5.. Raincloud plot of relative power (%FTP) during low (green) and high (purple) intensity exercise.
Individual data points depict subject-specific averages across blocks.
Author response image 6.
Author response image 6.. Raincloud plot of rating of perceived exertion (RPE) on the BORG scale during low (green) and high (purple) intensity exercise.
Individual data points depict subject-specific averages across blocks. A rating of 6 reflects ‘no exertion’ and 20 reflects ‘maximal exertion’.
Author response image 7.
Author response image 7.. Post-hoc power analysis for behavioural effects from the linear mixed effects (LMER) model with interaction drug, fitness level, and sex using the R package powerCurve with α = 0.8 and 1000 simulations.

Update of

  • doi: 10.1101/2024.06.25.600579
  • doi: 10.7554/eLife.102392.1
  • doi: 10.7554/eLife.102392.2

Similar articles

References

    1. Allen H, Coggan A. Racing and Training with a Power Meter. Boulder, CO: VeloPress; 2006.
    1. Allen H, Coggan A. Training and Racing with a Power Meter. VeloPress; 2012.
    1. Årnes AP, Nielsen CS, Stubhaug A, Fjeld MK, Hopstock LA, Horsch A, Johansen A, Morseth B, Wilsgaard T, Steingrímsdóttir ÓA. Physical activity and cold pain tolerance in the general population. European Journal of Pain. 2021;25:637–650. doi: 10.1002/ejp.1699. - DOI - PubMed
    1. Årnes AP, Nielsen CS, Stubhaug A, Fjeld MK, Johansen A, Morseth B, Strand BH, Wilsgaard T, Steingrímsdóttir ÓA. Longitudinal relationships between habitual physical activity and pain tolerance in the general population. PLOS ONE. 2023;18:e0285041. doi: 10.1371/journal.pone.0285041. - DOI - PMC - PubMed
    1. Aslaksen PM, Bystad M, Vambheim SM, Flaten MA. Gender differences in placebo analgesia: event-related potentials and emotional modulation. Psychosomatic Medicine. 2011;73:193–199. doi: 10.1097/PSY.0b013e3182080d73. - DOI - PubMed