. 2025 Aug 12;122(32):e2504778122.
doi: 10.1073/pnas.2504778122. Epub 2025 Aug 6.

Immiscible proteins compete for RNA binding to order condensate layers

Affiliations

Immiscible proteins compete for RNA binding to order condensate layers

Wilton T Snead et al. Proc Natl Acad Sci U S A. .

Abstract

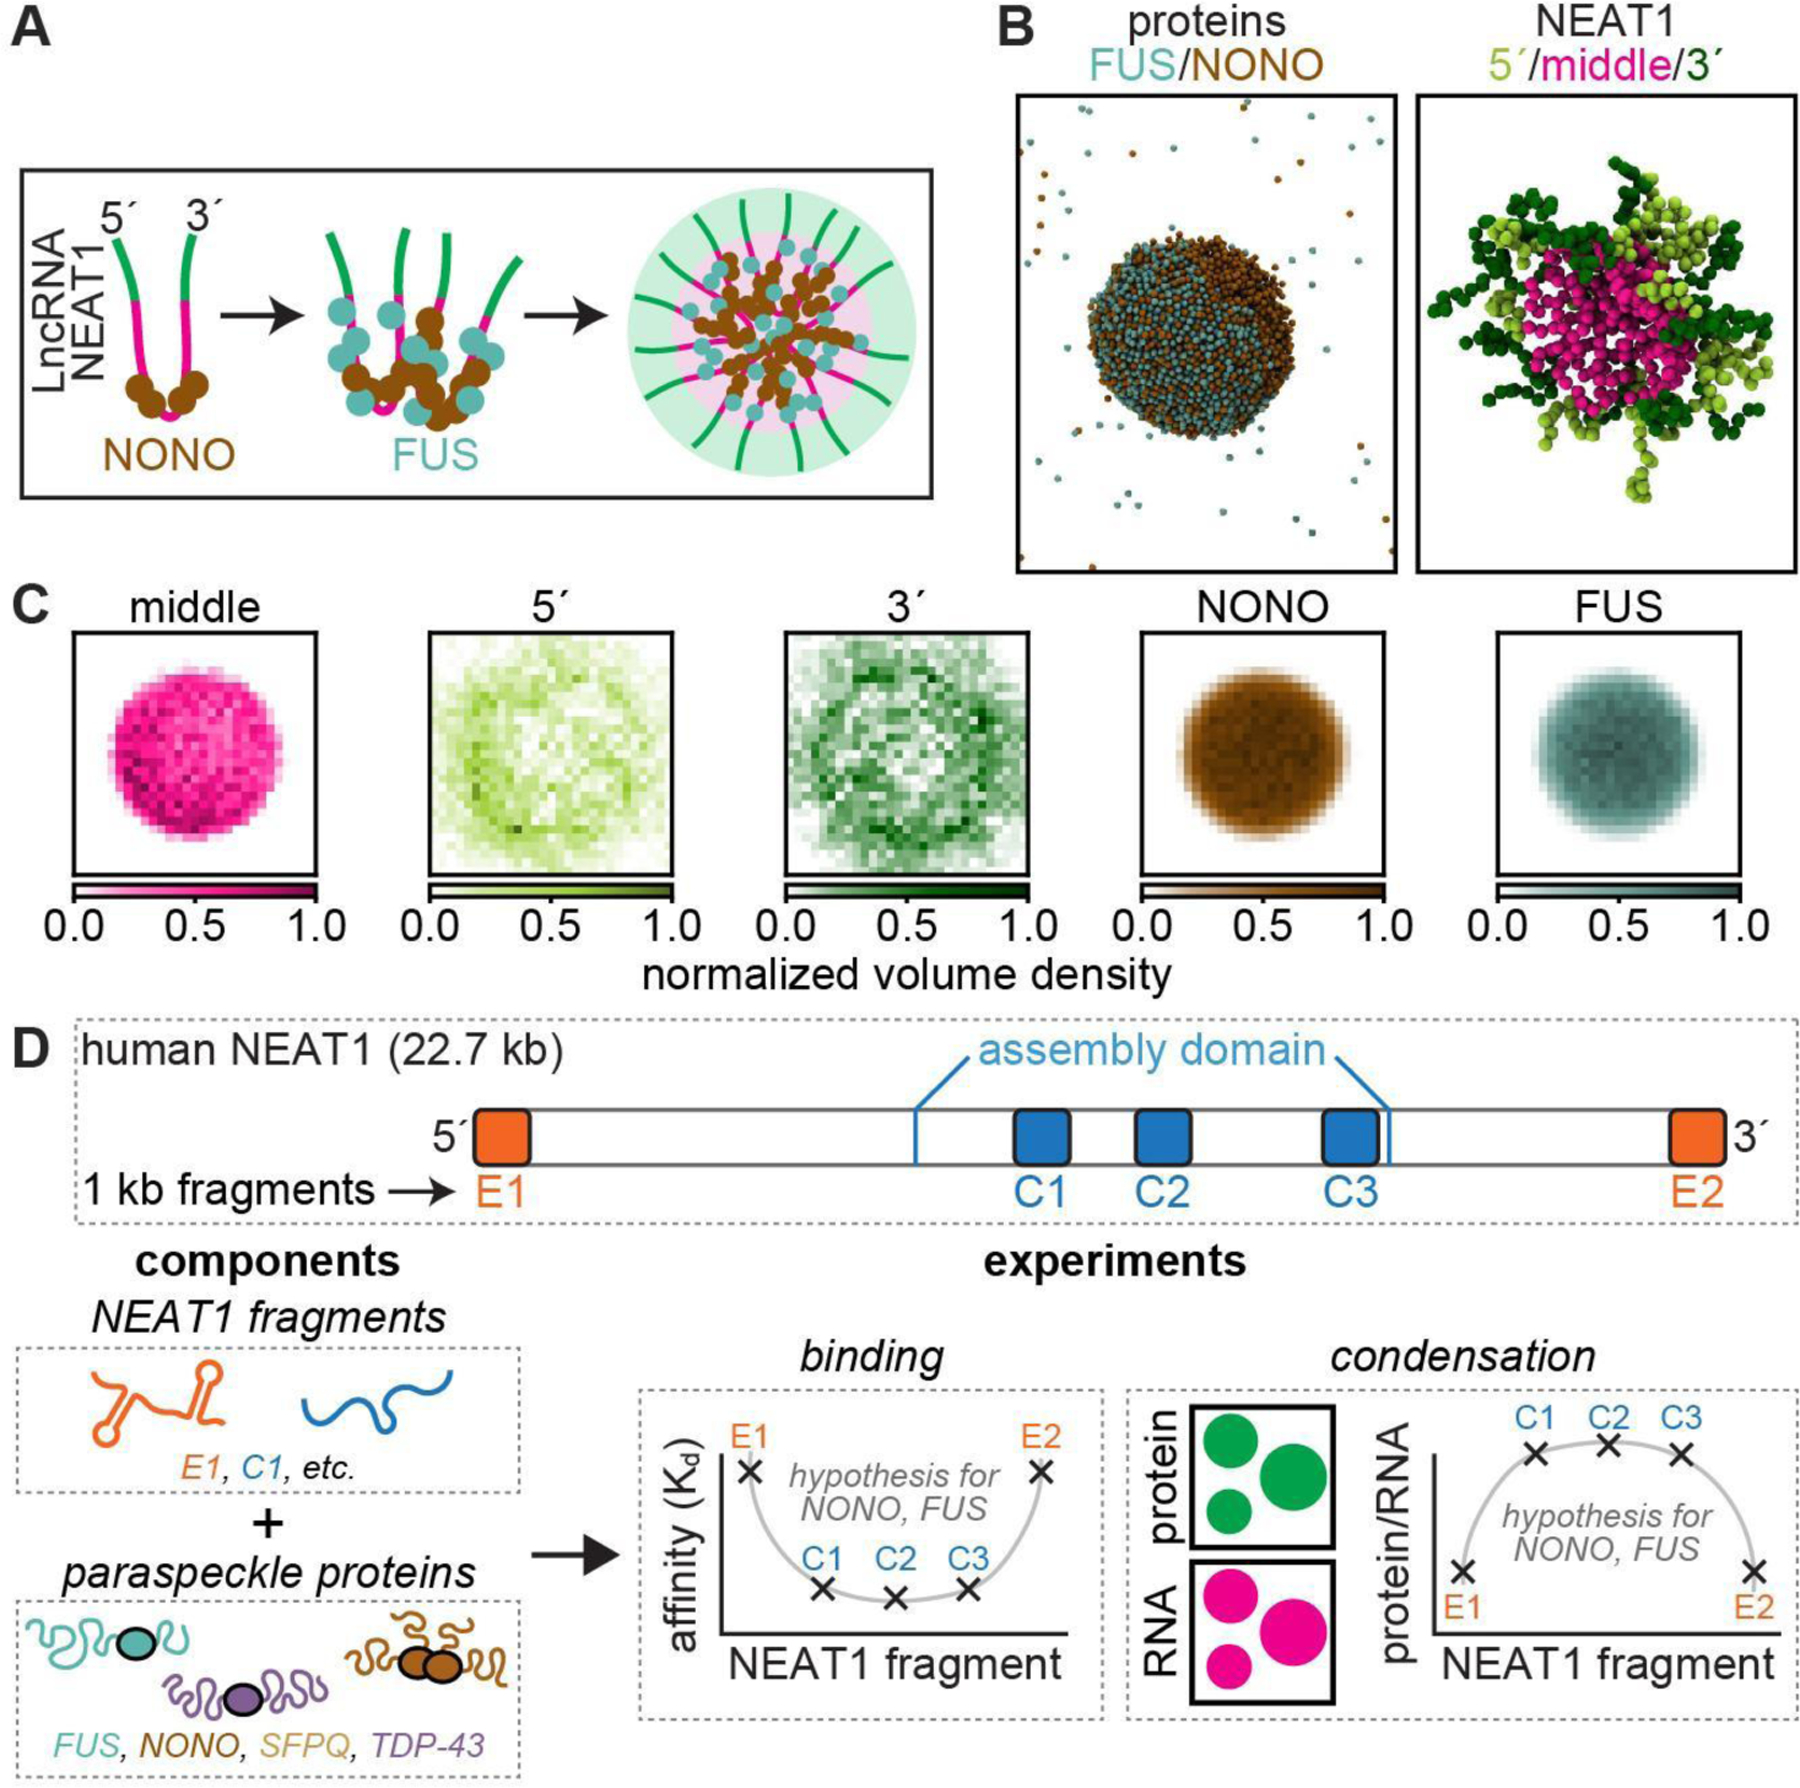
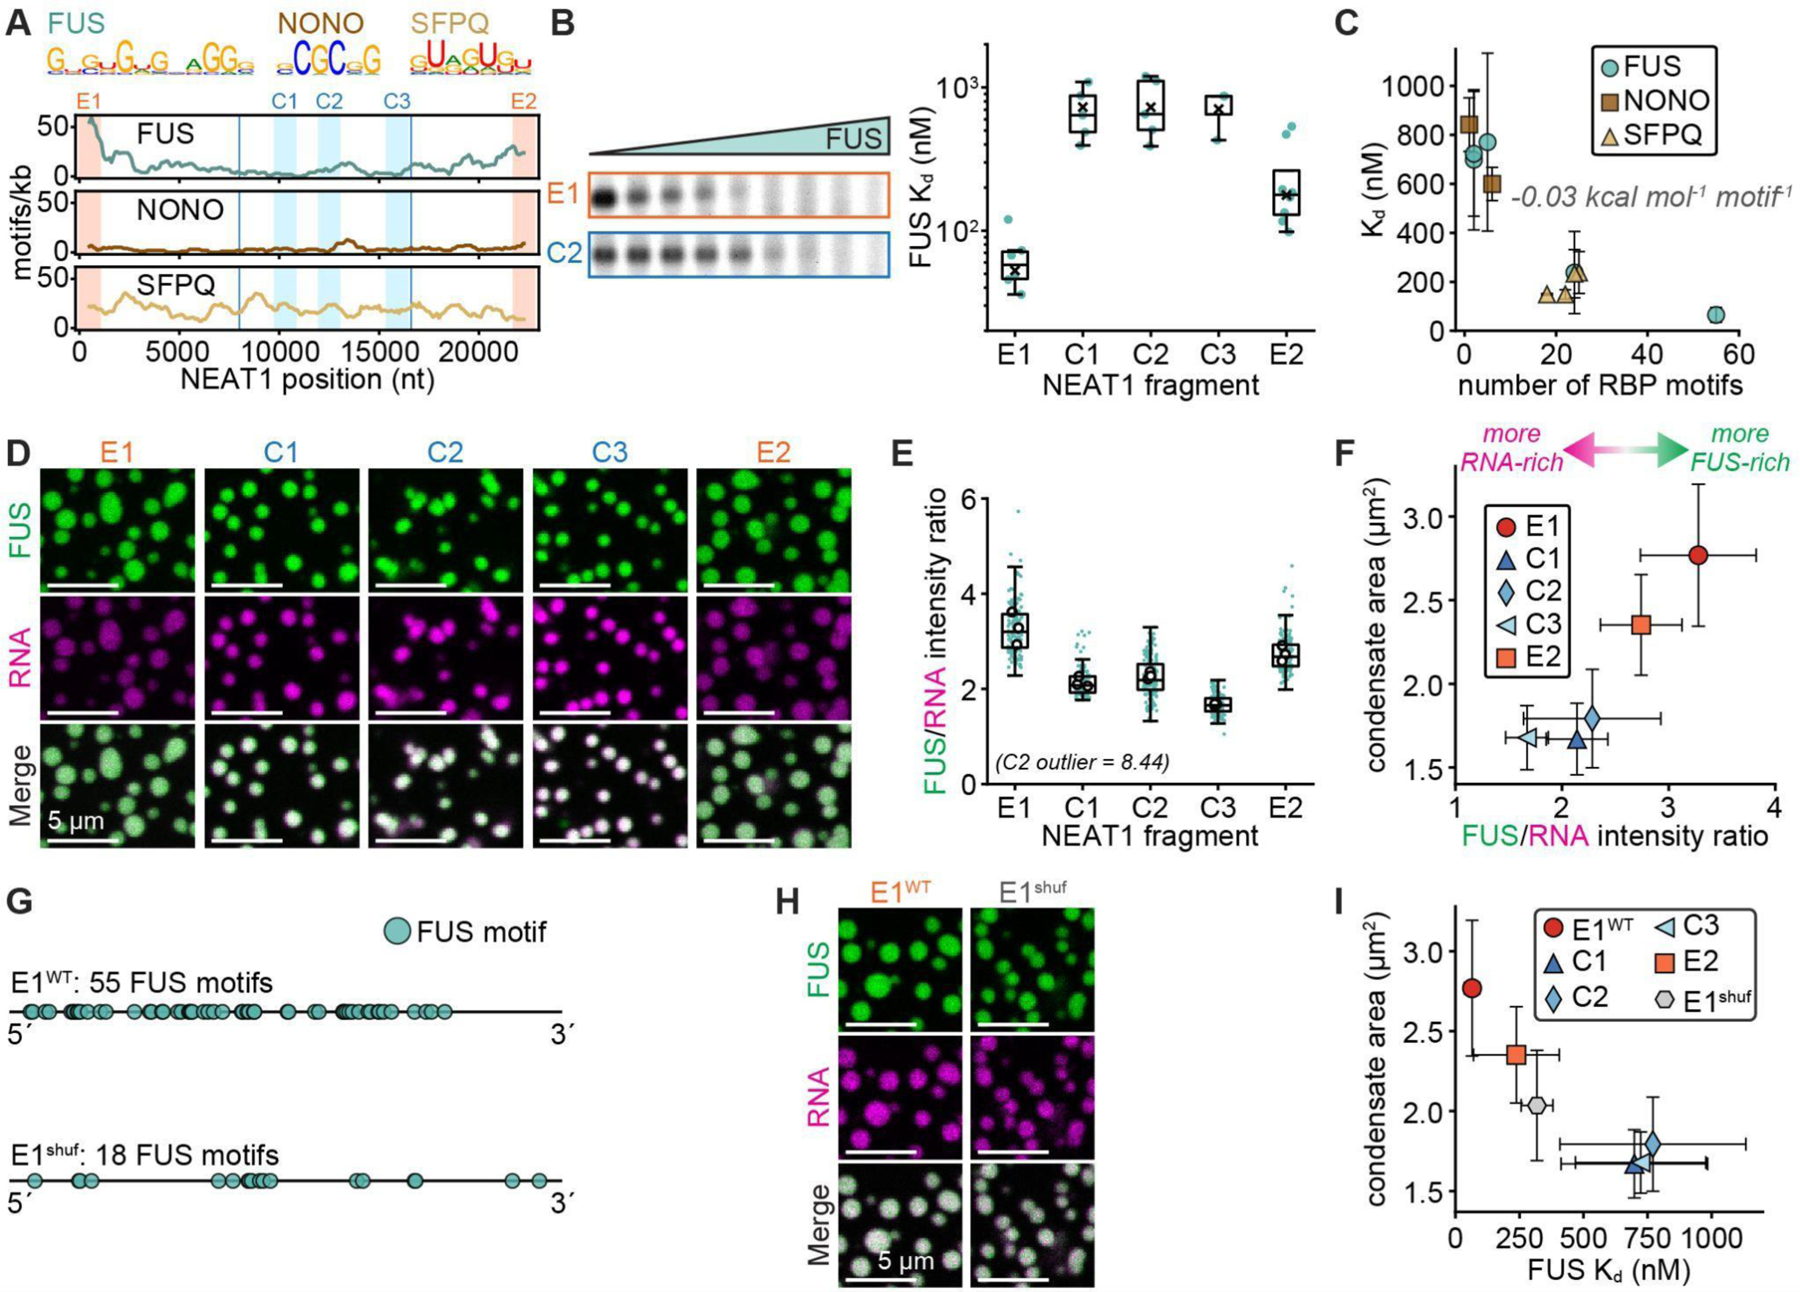
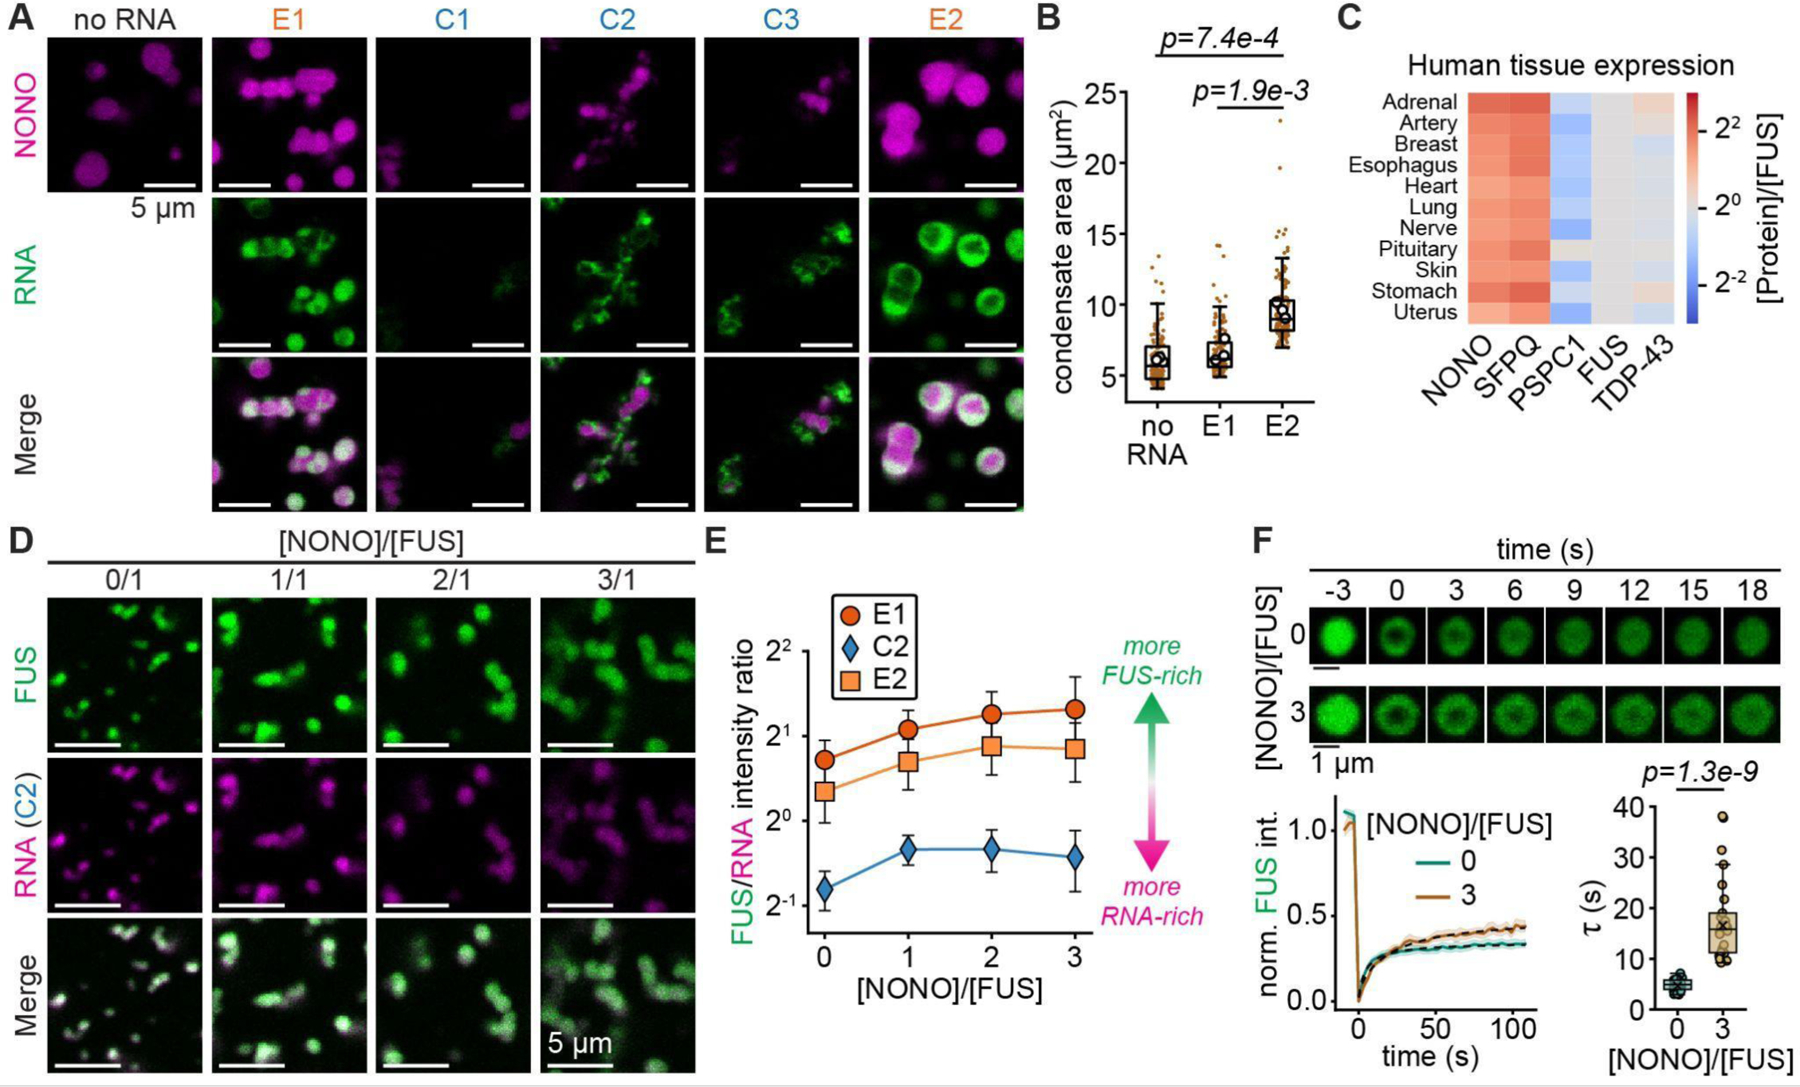
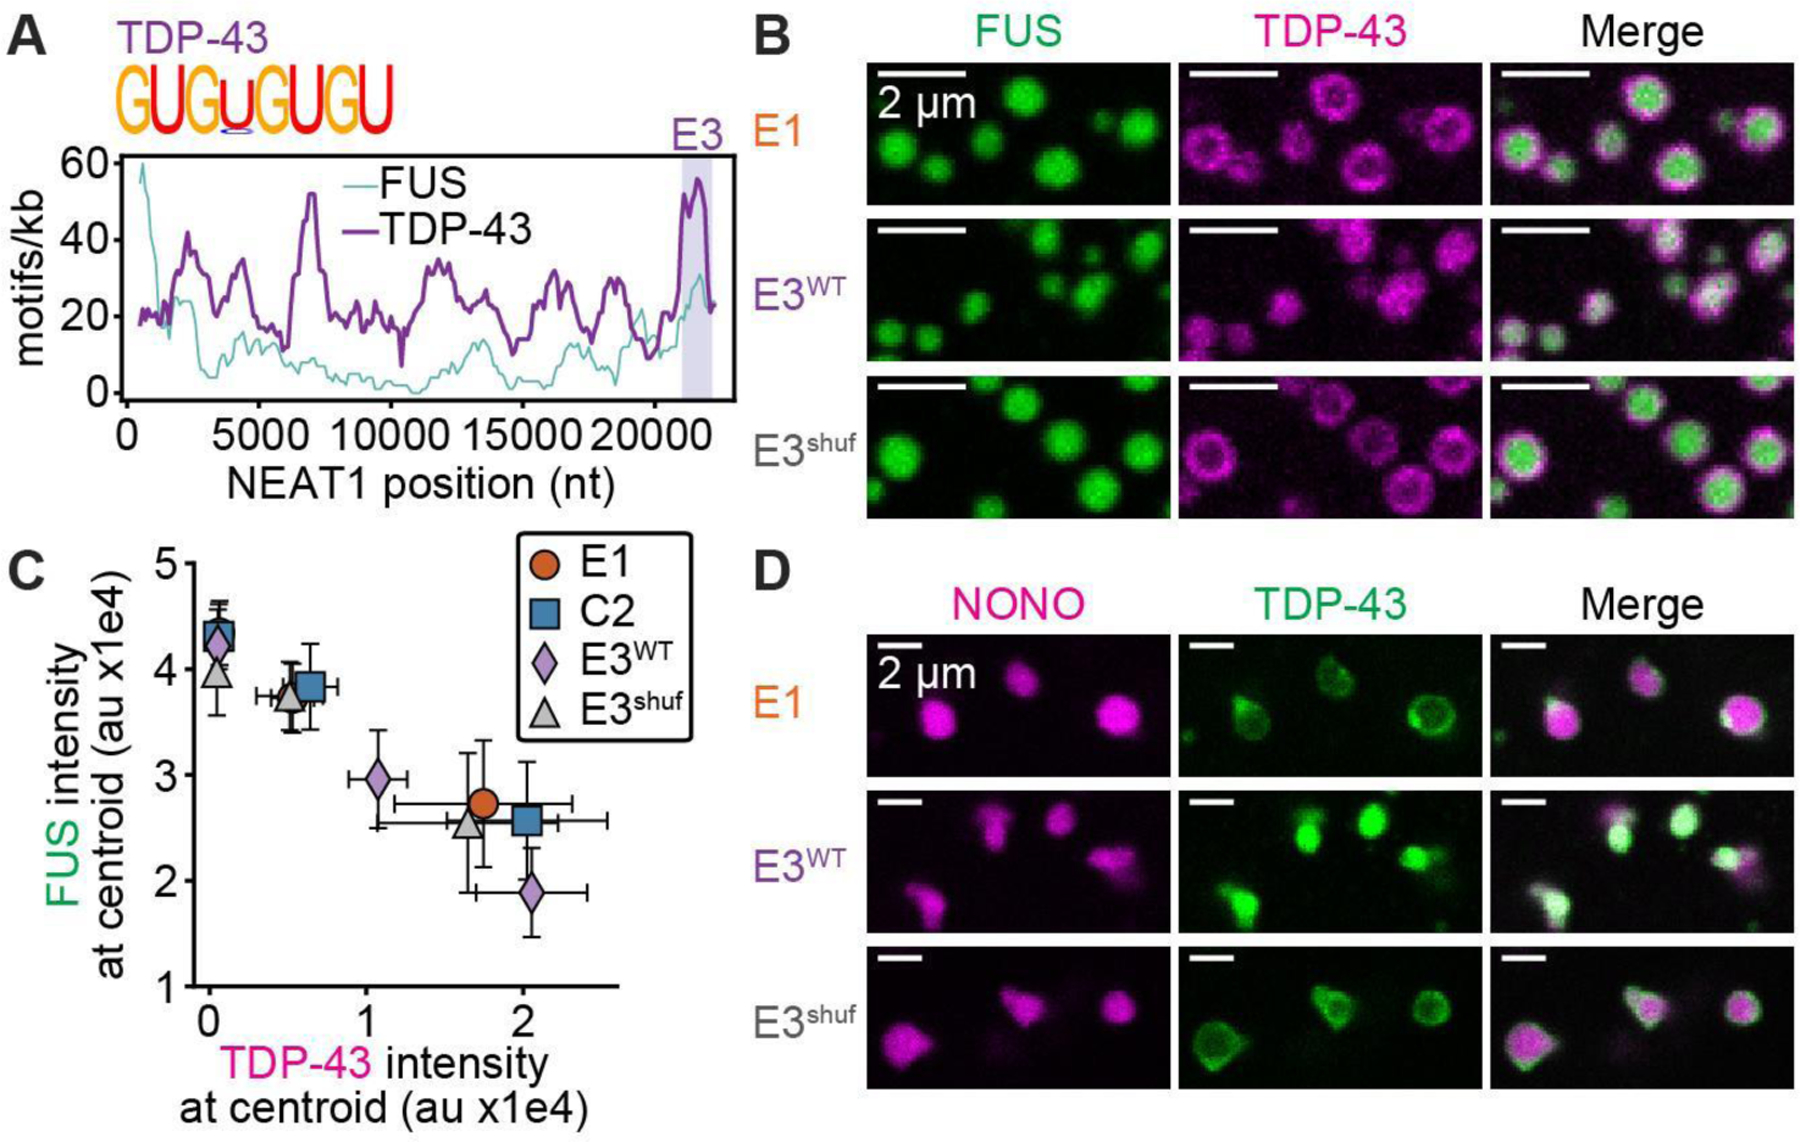
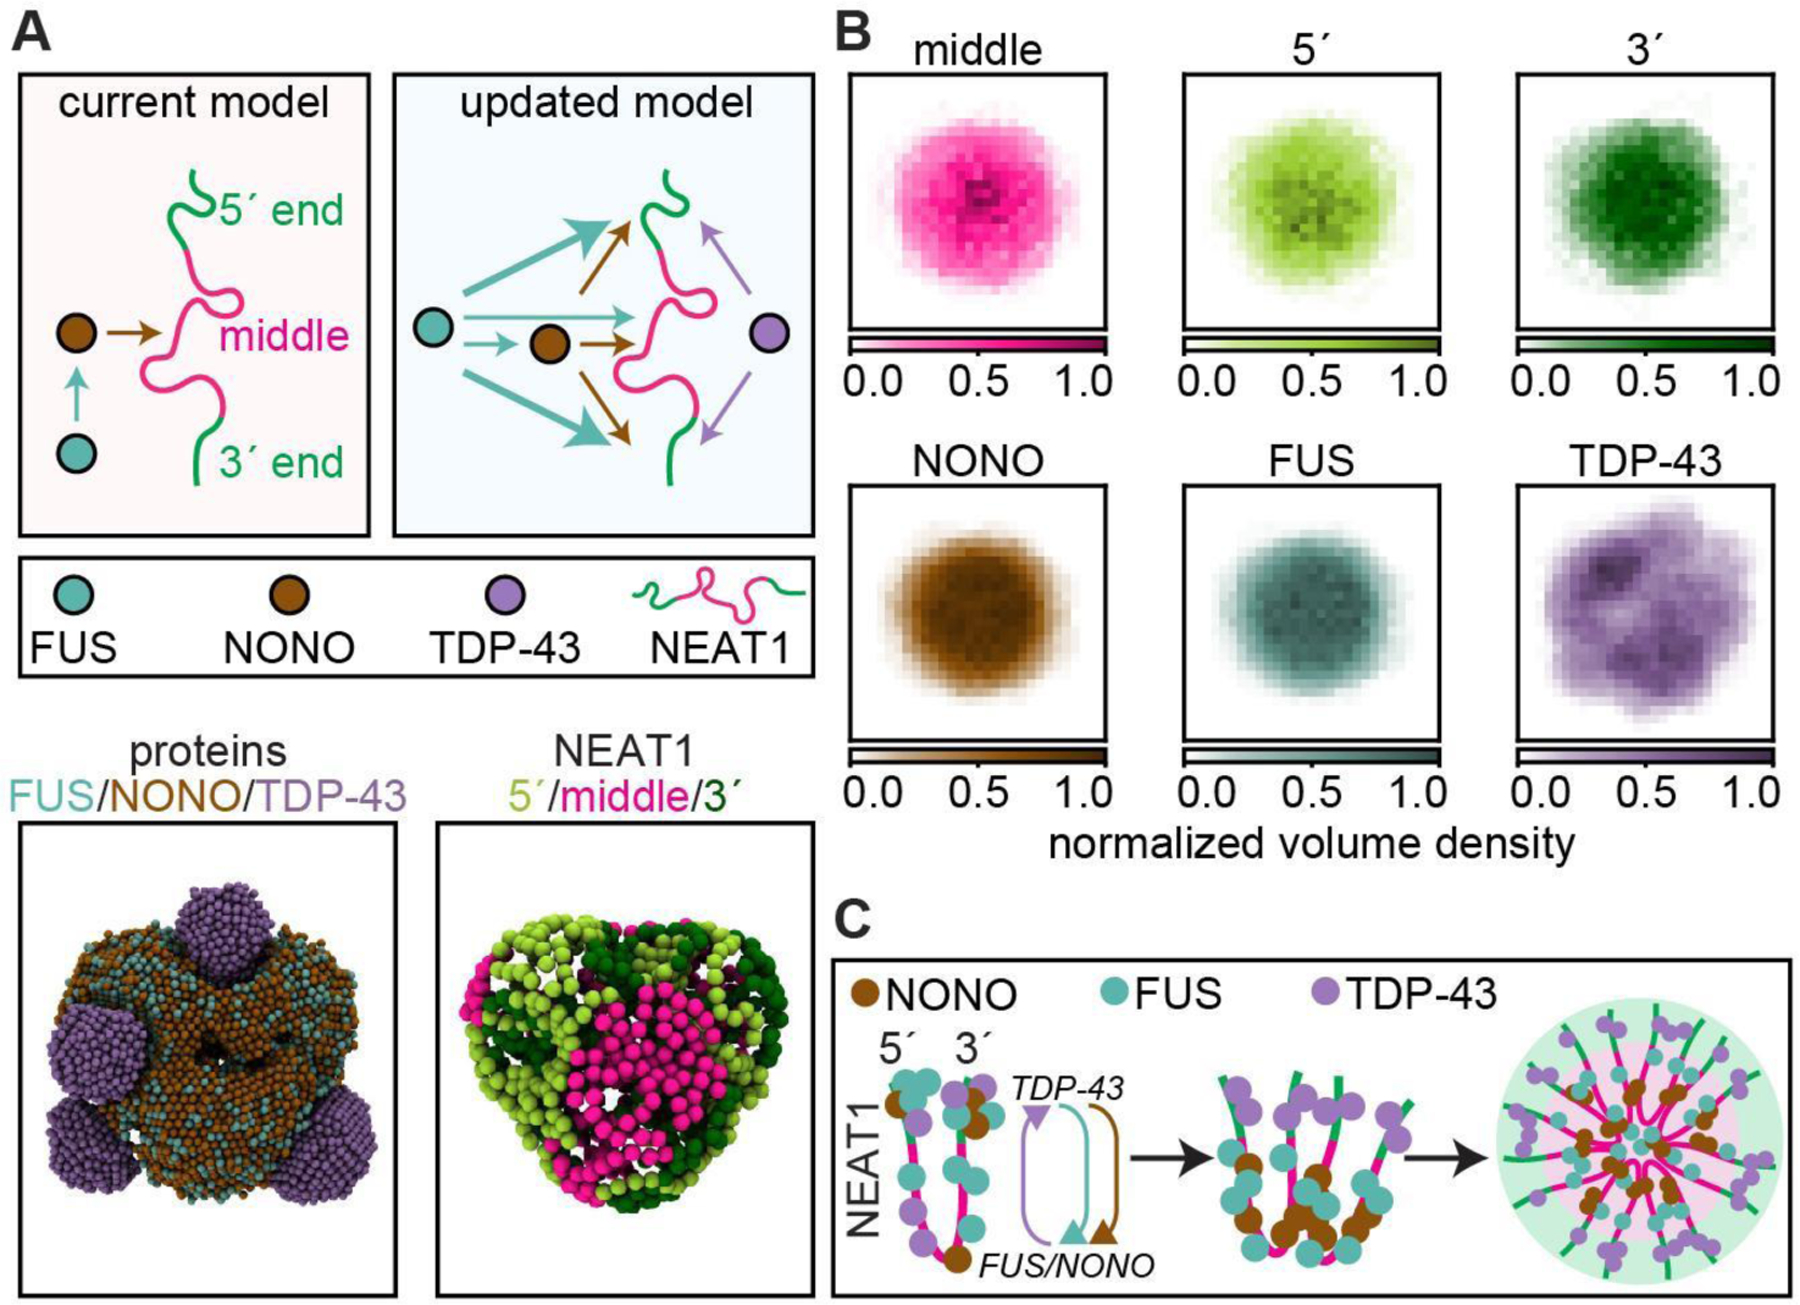
Biomolecular condensates mediate diverse and essential cellular functions by compartmentalizing biochemical pathways. Many condensates have internal subdomains with distinct compositional identities. A major challenge lies in dissecting the multicomponent logic that relates biomolecular features to emergent condensate organization. Nuclear paraspeckles are paradigmatic examples of multidomain condensates, comprising core and shell layers with distinct compositions that are scaffolded by the lncRNA NEAT1, which spans both layers. A prevailing model of paraspeckle assembly proposes that core proteins bind directly and specifically to core-associated NEAT1 domains. Combining informatics and biochemistry, we unexpectedly find that the essential core proteins FUS and NONO bind and condense preferentially with shell-associated NEAT1 domains. The shell protein TDP-43 exhibits similar NEAT1 domain preferences on its own but forms surfactant-like shell layers around core protein-driven condensates when both are present. Together, experiments and physics-based simulations suggest that competitive RNA binding and immiscibility between core and shell proteins order paraspeckle layers. More generally, we propose that subcondensate organization can spontaneously arise from a balance of collaborative and competitive protein binding to the same domains of a lncRNA.

Keywords: RNA; RNA-binding proteins; biomolecular condensates; nuclear paraspeckles.


Conflict of interest statement

Competing interests statement:The authors declare no competing interest.

Figures

Fig. 1.
Fig. 1.
Probing the current model of paraspeckle assembly. (A) The current model suggests that the core proteins NONO and FUS localize selectively to the middle region of NEAT1, forming ribonucleoprotein units that adhere together to form paraspeckles. (B) Renderings of proteins (left) and NEAT1 chains (right) within the largest cluster at the end of a simulation. (C) Normalized maximum intensity projections (through z axis) of each component within clusters. Images represent average profiles of the largest clusters from n = 10 simulations. (D) Top: schematic of NEAT1 and the five in vitro transcribed 1 kb RNA fragments used in this study. Below: workflow of in vitro experiments. Plots depict hypothesized trends in RNA binding affinity and protein/RNA ratio within condensates for NONO and FUS.
Fig. 2.
Fig. 2.
Paraspeckle core proteins exhibit unexpected binding and condensation with NEAT1. (A) FUS, NONO, and SFPQ RNA-binding motifs. Plots show the number of motifs for each protein within 1000 nt windows of NEAT1, tiled every 100 nt from 5´ to 3´. Orange and blue vertical bars indicate the five NEAT1 fragments used in this study, and the blue boxed region indicates the assembly domain identified in ref (8–16.6 kb). (B) Background-subtracted image of unbound RNA in FUS EMSA gel with E1 and C2 fragments. Plot: Apparent FUS-RNA dissociation constant (Kd) estimates from EMSAs. Points and x’s represent fits to individual replicates and pooled data, respectively. (C) Apparent Kd as a function of the number of cognate RBP motifs per RNA. FUS: n = 6, 5, 5, 3, 8 replicates for E1, C1, C2, C3, E2. NONO: n = 3 replicates each for E1, C2. SFPQ: n = 3 replicates each for E1, C1, C2, C3. (D) Confocal slices of condensates assembled with 2 µM FUS-Atto 488 (green) and 30 nM RNA-Cy5 (magenta) after 3 h at 25 °C. FUS channel is contrasted identically in all images, while RNA channel is contrasted unequally to facilitate visual comparison of dense phase RNA concentrations after accounting for differences in RNA labeling density (Methods). (E) FUS/RNA intensity ratio at condensate centroids. Points: individual droplets; white circles: replicate means. (F) Condensate area as a function of FUS/RNA intensity ratio at condensate centroids. (G) Schematic of FUS motifs in E1WT and shuffled E1 sequence, E1shuf. (H) Confocal slices of condensates assembled with 2 µM FUS (green) and 30 nM RNA (magenta) after 3 h at 25 °C. FUS and RNA contrasted equally. (I) Condensate area as a function of apparent FUS-RNA Kd. Data for E1, C1, C2, C3, E2 repeated from (C, F). Data in (E, F, I) represent the 50 largest condensates from each replicate (Methods). n = 3 replicates per RNA (150 condensates total per RNA). Boxes in (B, E) indicate interquartile range (IQR) with medians as bisecting lines and whiskers as 1.5*IQR. Points and error bars in (C, F, I) indicate mean ± one standard deviation. Tukey’s HSD test: E1, E2 significantly different (p<0.05) from C1, C2, C3 in (B); E1 significantly different from C1, C2, C3 in (E). Exact p-values from Tukey’s HSD test for all pairwise comparisons in (B, E) provided in Fig. S2C and S3G.
Fig. 3.
Fig. 3.
NONO/FUS stoichiometry modulates condensation. (A) Confocal slices of condensates assembled with 2 µM NONO (magenta) and 15 nM RNA (green) after 3 h at 25 °C. NONO and RNA channels are contrasted equally in all images. (B) Condensate area from experiments corresponding to (A). Data represent the 50 largest condensates from each experimental replicate (Methods). n = 3 replicates per RNA (150 condensates total per RNA). Points: individual condensates; white circles: replicate means; boxes: IQR with medians as bisecting lines and whiskers as 1.5*IQR. p-values from Tukey’s HSD test; non-significant pairwise p-values not shown. Core RNAs were not included in analysis owing to variable z positions of NONO condensates trapped within RNA networks. (C) Heat map of the abundance of the indicated paraspeckle proteins relative to FUS in human tissues, quantified using data from ref. (D) Confocal slices of condensates assembled with 1 µM FUS (green) + 15 nM C2 RNA (magenta) + NONO at the indicated concentrations after 3 h at 25 °C. FUS and RNA channels are contrasted equally in all images. (E) FUS/RNA intensity ratio at condensate centroids as a function of NONO/FUS stoichiometry with the indicated RNAs. Data points and error bars indicate mean ± one standard deviation for the 50 largest condensates from each experimental replicate. n = 3 replicates per RNA (150 condensates total per RNA). (F) Top: confocal slices of FUS (green) photobleaching recovery within droplets assembled with 1 µM FUS + 15 nM E2 RNA + NONO at the indicated stoichiometry. Lower left: normalized FUS intensity recovery profiles as a function of time for droplets with the indicated NONO stoichiometry. Curves and shaded error bars indicate average ± 95% CI, dashed lines indicate fits to single component FRAP recovery model. Lower right: FUS recovery time constant (τ) estimates from FRAP fits. Circles and x’s indicate τ from fits to individual droplets and average data, respectively. Boxes indicate IQR with medians as bisecting lines and whiskers as 1.5*IQR. n = 24 and 25 condensates for NONO/FUS stoichiometries of 0 and 3, respectively, each pooled from 3 replicates per condition. p-value from two-tailed Student’s t-test.
Fig. 4.
Fig. 4.
TDP-43 opposes core protein condensation by competing for RNA binding. (A) TDP-43 RNA binding motif and plot of the number of FUS and TDP-43 motifs within 1000 nt windows of NEAT1, tiled every 100 nt. FUS motif distribution repeated from Fig. 2A. Purple vertical bar indicates E3 fragment. (B) Confocal slices of condensates assembled with 2 µM FUS (green) + 0.2 µM TDP-43 (magenta) + 15 nM of the indicated, unlabeled RNA after 3 h at 25 °C. (C) FUS intensity as a function of TDP-43 intensity at condensate centroids. Data are from experiments in which TDP-43 was added at concentrations of 0, 0.2, and 0.5 µM, with fixed FUS and RNA concentrations indicated in (B). Data points and error bars indicate mean ± one standard deviation for the 50 largest condensates from each experimental replicate (Methods). n = 3 replicates per data point (150 condensates per data point). (D) Confocal slices of condensates assembled with 2 µM NONO (magenta) + 0.2 µM TDP-43 (green) + 15 nM of the indicated, unlabeled RNA after 3 h at 25 °C.
Fig. 5.
Fig. 5.
An updated model of paraspeckle assembly. (A) Summary of key interactions in the updated model. Thicker arrows correspond to stronger interactions. Below: renderings show proteins (left) and NEAT1 chains (right) within the largest cluster at the end of a simulation. (B) Normalized maximum intensity projections (through z axis) of each component within clusters. Images represent average profiles of the largest clusters from n = 10 simulations. (C) Conceptual schematic of the updated model.

Update of

Similar articles

References

    1. Henninger JE, Oksuz O, Shrinivas K, Sagi I, LeRoy G, Zheng MM, Andrews JO, Zamudio AV, Lazaris C, Hannett NM, et al. (2021). RNA-Mediated Feedback Control of Transcriptional Condensates. Cell 184, 207–225 e24. 10.1016/j.cell.2020.11.030. - DOI - PMC - PubMed
    1. Guo YE, Manteiga JC, Henninger JE, Sabari BR, Dall’Agnese A, Hannett NM, Spille J-H, Afeyan LK, Zamudio AV, Shrinivas K, et al. (2019). Pol II phosphorylation regulates a switch between transcriptional and splicing condensates. Nature 572, 543–548. 10.1038/s41586-019-1464-0. - DOI - PMC - PubMed
    1. Bhat P, Chow A, Emert B, Ettlin O, Quinodoz SA, Strehle M, Takei Y, Burr A, Goronzy IN, Chen AW, et al. (2024). Genome organization around nuclear speckles drives mRNA splicing efficiency. Nature 629, 1165–1173. 10.1038/s41586-024-07429-6. - DOI - PMC - PubMed
    1. Larson AG, Elnatan D, Keenen MM, Trnka MJ, Johnston JB, Burlingame AL, Agard DA, Redding S, and Narlikar GJ (2017). Liquid droplet formation by HP1alpha suggests a role for phase separation in heterochromatin. Nature 547, 236–240. 10.1038/nature22822. - DOI - PMC - PubMed
    1. Gibson BA, Doolittle LK, Schneider MWG, Jensen LE, Gamarra N, Henry L, Gerlich DW, Redding S, and Rosen MK (2019). Organization of Chromatin by Intrinsic and Regulated Phase Separation. Cell 179, 470–484 e21. 10.1016/j.cell.2019.08.037. - DOI - PMC - PubMed

MeSH terms

LinkOut - more resources