

Comparison of HIV-1 A6 dispersal dynamics in Poland before and after the war in Ukraine
- PMID: 40768555
- PMCID: PMC12342253
- DOI: 10.1371/journal.ppat.1013369
Comparison of HIV-1 A6 dispersal dynamics in Poland before and after the war in Ukraine
Abstract
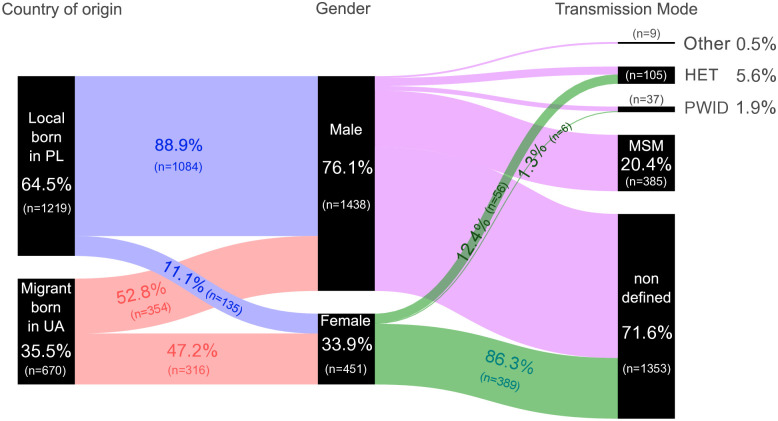
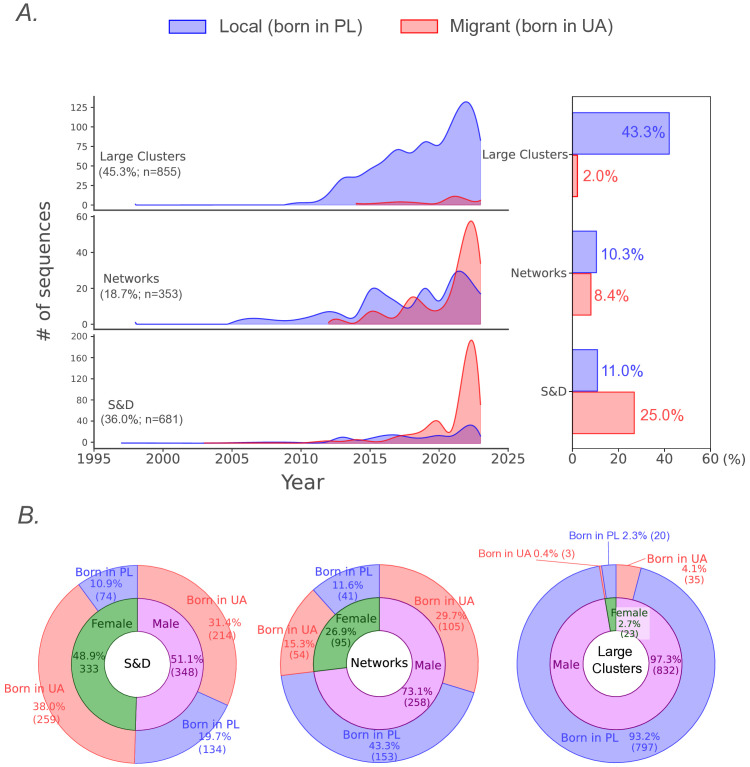
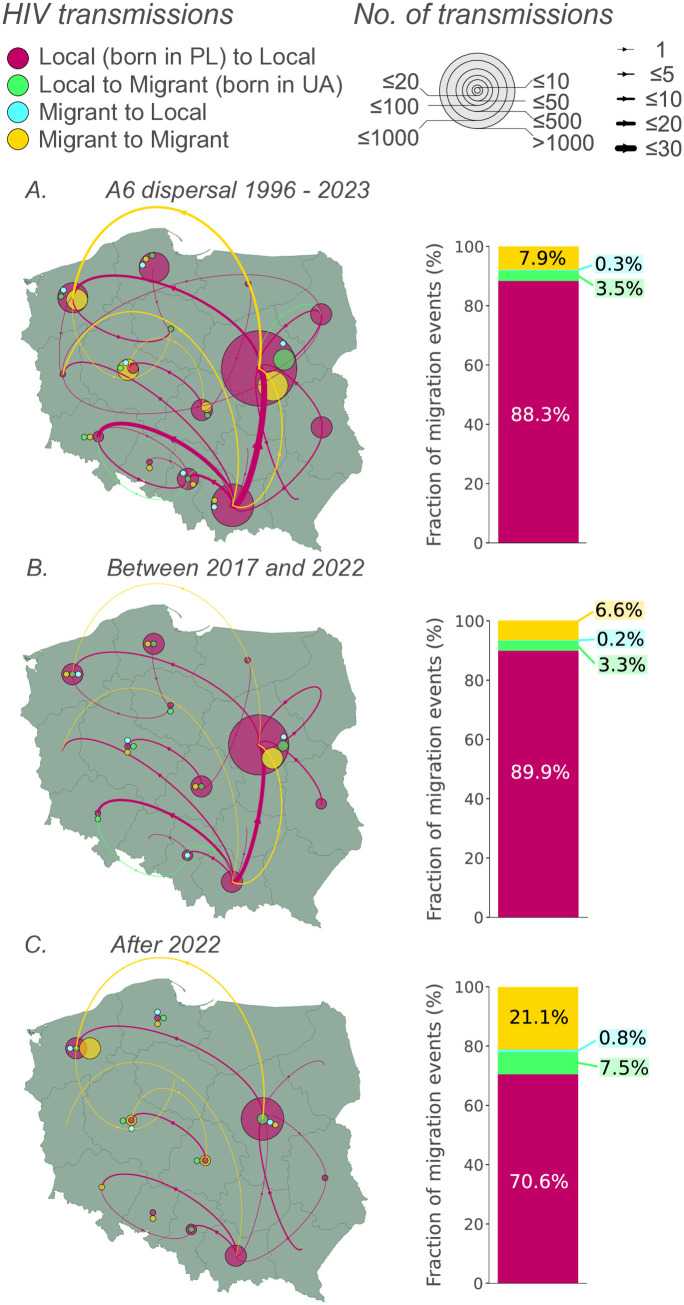
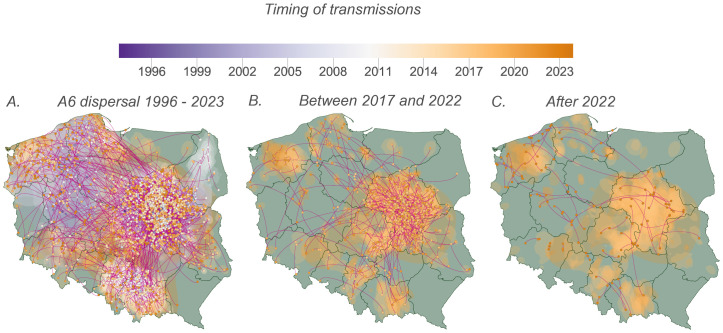
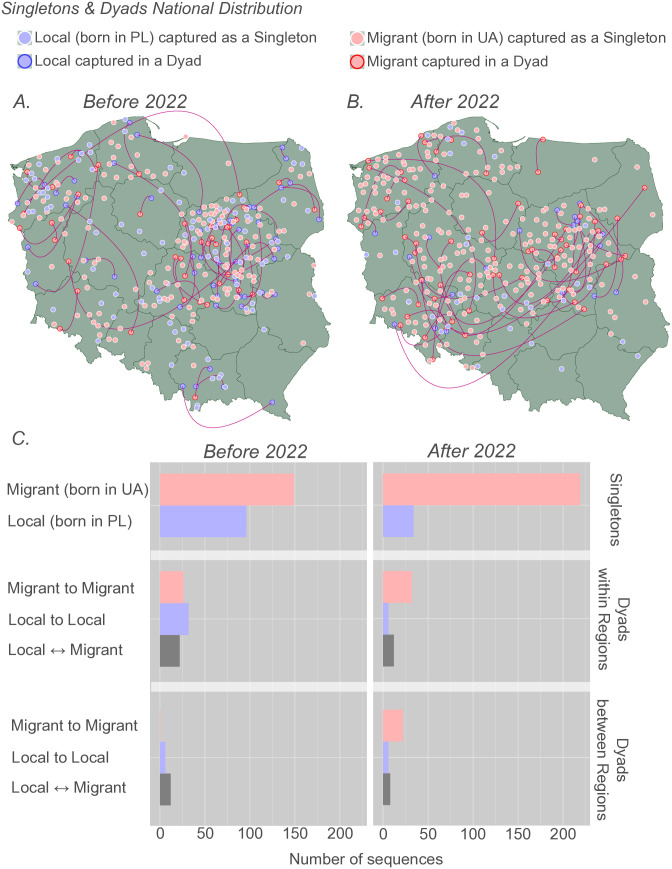
The war-related migrations from Ukraine to Poland have resulted in an increased prevalence of individuals diagnosed with human immunodeficiency virus type 1 (HIV-1) A6 variant. We examined the impact of the influx of people living with HIV (PLWH) displaced from Ukraine on the emergence of transmission events and evolving patterns in the A6 epidemic in Poland. We created a dataset of 13,696 unique HIV-1 pol gene fragments of sub-subtype A6 including 1,889 sequences from Poland. To evaluate the import of distinct clusters and estimate dispersal dynamics, we performed time calibration of the maximum-likelihood phylogenetic trees and phylogeographic inferences using the software package BEAST with discrete and continuous diffusion models. Our results indicated that A6 infections among males predominated within the domestic population (76.1%, n = 1,437), primarily within large clusters. Among Ukrainian migrants, 69.5% of the cases occurred as singletons or dyads (n = 473; p < 0.0001) with a balanced male-to-female ratio of 1.1. Since the war, the contribution of HIV-acquired individuals born in Ukraine to the virus circulation in Poland has increased to 30.2%, with an additional 334 distinct A6 introductions, inferred as internal nodes and descendant clusters that likely entered Poland from other countries. These migration events were concentrated in the central regions with a higher HIV prevalence. After the war outbreak in 2022, the number and complexity of A6 transmission chains in Poland expanded, driven by male-dominated domestic clusters and war-related migration. Understanding the existence of two distinct transmission dynamics is critical for designing targeted public health interventions. Halting national sub-subtype A6 circulation requires a combined approach that harmonizes the existing strategy focused on the men who have sex with men population with enhanced efforts to link migrants to care.
Copyright: © 2025 Serwin et al. This is an open access article distributed under the terms of the Creative Commons Attribution License, which permits unrestricted use, distribution, and reproduction in any medium, provided the original author and source are credited.
Conflict of interest statement
The authors have declared that no competing interests exist.
Figures
Similar articles
-
Circulation of Human Immunodeficiency Virus 1 A6 Variant in the Eastern Border of the European Union-Dynamics of the Virus Transmissions Between Poland and Ukraine.Clin Infect Dis. 2023 May 24;76(10):1716-1724. doi: 10.1093/cid/ciad058. Clin Infect Dis. 2023. PMID: 36857116
-
Behavioral interventions to reduce risk for sexual transmission of HIV among men who have sex with men.Cochrane Database Syst Rev. 2008 Jul 16;(3):CD001230. doi: 10.1002/14651858.CD001230.pub2. Cochrane Database Syst Rev. 2008. PMID: 18646068
-
Phylodynamic evolution of HIV-1 A6 sub-subtype epidemics in Poland.J Med Virol. 2024 Feb;96(2):e29482. doi: 10.1002/jmv.29482. J Med Virol. 2024. PMID: 38381668
-
A systematic review of post-migration acquisition of HIV among migrants from countries with generalised HIV epidemics living in Europe: mplications for effectively managing HIV prevention programmes and policy.BMC Public Health. 2015 Jun 19;15:561. doi: 10.1186/s12889-015-1852-9. BMC Public Health. 2015. PMID: 26085030 Free PMC article.
-
Population-based interventions for reducing sexually transmitted infections, including HIV infection.Cochrane Database Syst Rev. 2004;(2):CD001220. doi: 10.1002/14651858.CD001220.pub2. Cochrane Database Syst Rev. 2004. Update in: Cochrane Database Syst Rev. 2011 Mar 16;(3):CD001220. doi: 10.1002/14651858.CD001220.pub3. PMID: 15106156 Updated.
References
-
- Los Alamos National Laboratory. HIV sequence database. 2024. [cited 2024 May 15]. Available from:https://www.hiv.lanl.gov
-
- Catchpole M, Ekdahl K, Kissling E, Lefevre V, Mozalevskis A, Nielsen S, et al. European Centre for Disease Prevention and Control/WHO Regional Office for Europe. HIV/AIDS surveillance in Europe 2023 – 2022 data. Stockholm: ECDC; 2023.
Publication types
MeSH terms
LinkOut - more resources
Full Text Sources
Medical
