. 2025 Aug 6;23(8):e3003292.
doi: 10.1371/journal.pbio.3003292. eCollection 2025 Aug.

Streptomyces venezuelae uses secreted chitinases and a designated ABC transporter to support the competitive saprophytic catabolism of chitin

Affiliations

Streptomyces venezuelae uses secreted chitinases and a designated ABC transporter to support the competitive saprophytic catabolism of chitin

Anne van der Meij et al. PLoS Biol. .

Abstract

More than a billion tons of chitin are produced on earth each year. Chitin is rich in nitrogen and carbon, making it a valuable resource in competitive microbial ecosystems. However, almost all chitin is found in large, insoluble structures like insect and crustacean exoskeletons. For this material to enter a microorganism's primary metabolism, it must be degraded extracellularly through a saprophytic process. The extracellular nature of this process means that liberated oligomers may also become accessible to other microorganisms. How microbes navigate this challenge in terrestrial ecosystems remains largely unclear. Here, we show that Streptomyces venezuelae thrives on raw, insoluble chitin as its sole carbon and nitrogen source, outperforming glucose in metabolic activity and sporulation. This was facilitated by a chitinolytic system encompassing up to 10 chitinases and the DasABC chitobiose importer. While deleting some chitinases affected growth on chitin, others did not, implying some degree of functional redundancy. A dasBC null mutation conferred a severe growth defect suggesting that chitobiose is a key breakdown product during chitin-based metabolism in S. venezuelae. The DasABC transporter also played a crucial role in preventing the built-up of chitobiose extracellularly, thereby restricting its access to Bacillus subtilis in co-cultures. Given the global ubiquity of Streptomyces in soil, this pathway likely plays a significant role in soil ecology as well as carbon and nitrogen turnover on a global scale.


Conflict of interest statement

I have read the journal's policy and the authors of this manuscript have the following competing interests: The authors disclose that a patent application related to chitobiose production by the dasBC deletion mutant has been planned.

Figures

Fig 1
Fig 1. Streptomyces venezuelae growth on insect (-exoskeleton) and chitin.
A) S. venezuelae overgrowing a grasshopper, visualized by an extensive hyphal mat covering the exoskeleton of the insect. B) Growth of S. venezuelae (S. vnz) lead to a 27% loss of grasshopper biomass after an incubation period of 6 weeks. Bars represent the averages of eight biological replicates and the error bars show standard deviations. C) S. venezuelae hyphal mass coating a piece of insect exoskeleton D) S. venezuelae growing on a piece of chitin. E) Growth on chitin supports sporulation by S. venezuelae, illustrated by the green spore pellet (bottom panel—arrow) and the observation of spores by microscopy (top panel). F) Growth of S. venezuelae (S. vnz) on chitin results in biomass loss of over 50% after an incubation period of six weeks. Bars represent the averages of five biological replicates and the error bars show standard deviations. G) The metabolic marker resazurin reaches its peak in fluorescence earlier for cultures grown on chitin compared with glucose. Insert: bar graph showing CFUs per milliliter after 6 days of growth on either chitin medium or glucose medium. Scalebars: C and D: 50 microns. E: 5 microns. The data underlying this figure can be found in S2 Data.
Fig 2
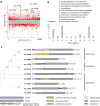
Fig 2. Transcriptional response of Streptomyces venezuelae during growth on chitin.
A) Manhattan plot of S. venezuelae on glucose vs. chitin after 24 h of growth. Each dot represents a gene. Red dots are significantly differentially expressed with an FDR cutoff of 0.05. Genes with a positive Log2 fold change are upregulated during growth on chitin. Orange dots represent the 40 genes that are most significantly upregulated (lowest False Discovery Rate) during growth on chitin (Table D in S1 Text). Genes that were further investigated in this study are labeled. B) The 40 genes that are most significantly upregulated during growth on chitin (orange dots) have been assigned a Cluster of Orthologues Genes (COG) group. C) Phylogeny, domain architecture, and expression of S. venezuelae chitinases. The genome encodes one GH19 and nine GH18 chitinases with various chitin-binding domains. Subfamily assignments are shown. The first number indicates log₂ fold change (chitin vs. glucose); the second shows log₂ counts per million. The data underlying this Figure can be found in S1 and S2 Data. Please open S3 Data to view the tree-file.
Fig 3
Fig 3. Colony-forming units (CFUs) of wild-type and mutant strains grown on chitin.
A) Bar graph: Wild-type (WT) Streptomyces venezuelae strains typically produce an average of 108 CFUs per mL in chitin cultures, whereas the vnz_24855 knock-out (KO), vnz_12765 KO and vnz_26400 KO reach around 106 CFUs per mL within the same time frame. Complemented strains (CP) for the vnz_24855 and 12765 chitinases reach comparable CFU’s as wild-type cultures. KO’s of vnz_02735 and 16685 maintain similar amounts of spores compared to WT. Bars represent the averages of three biological replicates and their respective error bars show standard deviations. B) After 6 days of growth on chitin, wild-type S. venezuelae bacteria formed large pellets around the chitin flakes and are sporulating (green pellet indicated by the arrow). In contrast, only few hyphae are visible for the dasBC KO. Inserts: pellets from 0.5 mL culture samples. Scale bar: 50 micrometer. The data underlying this figure can be found in S2 Data.
Fig 4
Fig 4. Chitobiose accumulation in the dasBC deletion mutant enhances Bacillus subtilis growth in co-culture.
A) Extracted ion chromatogram for chitobiose (N,N″-diacetylglucosamine dimer—structure inserted; M + Na: 447.16). Shown are representative peaks for S. venezuelae wild-type (WT) and the deletion mutant (ΔdasBC). B) Chitobiose spectrum (MS1). Besides the M + Na adduct and its isotopes, the M + H ion (425.18) and its isotopes are detected too. C) MS/MS spectrum of ion 447.16. Amongst the fragments detected are the ions 244.08 and 226.07, which represent the Na adduct of GlcNAc with and without H2O, respectively. Insert: Area under the curve (AUC) of the 226.07 ion in spent media of wild-type vs. mutant bacteria. D) B. subtilis growth curves. B. subtilis expressing the red fluorophore mCherry does not exhibit growth on chitin medium, as indicated by the absence of fluorescence. When co-cultured with the Streptomyces venezuelae dasBC deletion mutant (dasBC KO), there is a marked increase in fluorescence output compared to B. subtilis grown alone on chitin medium or when co-cultured with wild-type S. venezuelae (WT). Datapoints are the averages of three biological replicates and the error bars show standard deviations. E) Colony-forming units (CFU’s) per milliliter of culture for B. subtilis. The number of B. subtilis cells is higher in a co-culture with the S. venezuelae dasBC deletion mutant compared to B. subtilis grown alone or in co-culture with wild-type S. venezuelae. Bars represent the averages of three biological replicates and their respective error bars show standard deviations. The data underlying this figure can be found in S2 Data.

References

    1. Clegg CJM, D G. Advanced biology: principles and applications. 2nd ed. John Murray. 2006.
    1. Kögel-Knabner I, Rumpel C. Advances in molecular approaches for understanding soil organic matter composition, origin, and turnover: a historical overview. Adv Agron. Elsevier. 2018. p. 1–48. doi: 10.1016/bs.agron.2018.01.003 - DOI
    1. Poirier N, Sohi SP, Gaunt JL, Mahieu N, Randall EW, Powlson DS, et al. The chemical composition of measurable soil organic matter pools. Organ Geochem. 2005;36(8):1174–89. doi: 10.1016/j.orggeochem.2005.03.005 - DOI
    1. Leger RJS, Joshi L, Roberts DW. Adaptation of proteases and carbohydrates of saprophytic, phytopathogenic and entomopathogenic fungi to the requirements of their ecological niches. Microbiology (Reading). 1997;143(Pt 6):1983–92. doi: 10.1099/00221287-143-6-1983 - DOI - PubMed
    1. Setälä H, McLean MA. Decomposition rate of organic substrates in relation to the species diversity of soil saprophytic fungi. Oecologia. 2004;139(1):98–107. doi: 10.1007/s00442-003-1478-y - DOI - PubMed

MeSH terms

Supplementary concepts

LinkOut - more resources