. 2025 Aug 8;11(32):eadv2453.
doi: 10.1126/sciadv.adv2453. Epub 2025 Aug 8.

AND-1 is a critical regulator of R-loop dynamics and a target to overcome endocrine resistance

Affiliations

AND-1 is a critical regulator of R-loop dynamics and a target to overcome endocrine resistance

Zhuqing Li et al. Sci Adv. .

Abstract

R-loops are three-stranded DNA/RNA hybrids that are essential for various cellular pathways. However, when dysregulated, they lead to genomic instability and numerous human diseases. R-loops are tightly regulated, with RNase H1 acting as a key enzyme responsible for resolving DNA/RNA hybrids. Here, we identify the DNA-binding protein AND-1 as an essential factor in R-loop regulation through directly binding to R-loop structures, where it enhances the recruitment of RNase H1 and stimulates its endonuclease activity. We also provide in vivo evidence that R-loop accumulation occurs in the mammary gland tissue of AND-1-deficient mice. Furthermore, we demonstrate that inhibition of AND-1 decreases ESR1 expression by disrupting R-loop regulation at the enhancer region of the ESR1 gene in estrogen receptor-positive (ER+) breast cancer cells, thereby overcoming resistance to aromatase inhibitors. Collectively, our findings reveal a mechanism by which AND-1 modulates R-loop dynamics and present a promising therapeutic strategy to combat endocrine resistance in breast cancer.


Figures
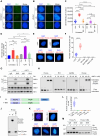
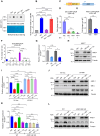
Fig. 1.
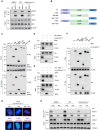
Fig. 1.. AND-1 interacts with R-loops and its depletion leads to R:D hybrid accumulation.
(A to C) Images [(A) and (B)] and quantification (C) of S9.6 immunostaining in U2OS cells treated with control siRNA (Ctrl), AND-1 siRNA (siA), or siA with plasmid-mediated expression of WT AND-1 (siA + WT). Cells were also transfected with or without V5-tagged RNase H1 (V5-RH1). Scale bars, 10 μm. n = 50. (D) Quantification of S9.6 dot blot signals shown in fig. S1E. U2OS cells were treated with Ctrl, siA, or siA + WT as in (A), with or without 1 μM camptothecin (CPT) for 4 hours. n = 3. (E) Proximity ligation assay (PLA) to assess the association of AND-1 with FLAG-RNase H1D210N. U2OS cells expressing FLAG-RNase H1D210N were treated with or without 1 μM CPT for 4 hours. Anti–AND-1 and anti-FLAG antibodies were used. Scale bars, 10 μm. (F) Quantification of PLA signals from (E). n = 50. (G) S9.6 co-immunoprecipitation (co-IP) assay to show the interaction between R-loops and endogenous AND-1 and RNase H1 (RH1). Cells were treated with or without 1 μM CPT for 4 hours. (H) Electrophoretic mobility shift assay (EMSA) to show that AND-1 binds to different substrates including R-loop, R:D, dsDNA, and D-loop. (I) Schematic representation of AND-1 (FL) and its mutant (1-984). (J) EMSA to show that AND-1 (FL), but not AND-1 (1-984), binds to R-loop molecules. (K and L) PLA image (K) and quantification (L) in U2OS cells cotransfected with V5-tagged RNase H1D210N (V5-RH1) and FLAG tagged AND-1 (FL or 1-984). Anti-FLAG and anti-V5 antibodies were used. Scale bars, 10 μm. n = 50. (M) S9.6 co-IP assay to examine the interactions between R-loops and FLAG-tagged AND-1 (FL or 1-984) in U2OS cells. Data are shown as means ± SD. *P < 0.05; **P < 0.01; ***P < 0.001; ****P < 0.0001; n.s., not significant, based on unpaired two-tailed Student’s t tests. IgG, immunoglobulin G.
Fig. 2.
Fig. 2.. AND-1 interacts with RNase H1 and promotes its recruitment to R-loops.
(A) Co-immunoprecipitation (co-IP) assay to show the interaction between endogenous AND-1 and RNase H1 (RH1) in U2OS cells. Cell lysates were immunoprecipitated with anti–AND-1 or control immunoglobulin G (IgG) antibodies, followed by immunoblotting for indicated proteins. Cells were treated with 1 μM CPT for 4 hours to induce R-loop formation or treated with RNA polymerase inhibitor (5 μg/ml; actinomycin D) for 6 hours to attenuate R-loop generation. Dimethyl sulfoxide (DMSO) treatment was used as control. (B) Schematic representation of AND-1 (FL) and its truncated mutants. (C) Co-IP assay using lysates of HEK293T cells expressing indicated FLAG-tagged AND-1 or its mutants. Lysates were immunoprecipitated with anti-FLAG antibody, followed by immunoblotting for indicated proteins. (D and E) In vitro co-IP assay to show the interaction between purified His–AND-1 and purified FLAG-RNase H1WT (FLAG-RH1WT) (D) or FLAG-RNase H1D210N (FLAG-RH1D210N) (E). (F) In vitro co-IP assay to show the interaction between purified FLAG-RH1WT proteins and purified His–AND-1 (FL) or its mutants. (G) PLA to show the colocalization of RH1 with R-loops in U2OS cells costained with anti-RH1 and S9.6 antibodies. Red foci indicate PLA signals. Scale bars, 10 μm. Cells were treated with control siRNA (Ctrl), AND-1 siRNA (siA), or siA followed by transfection with WT AND-1 plasmid. (H) S9.6 co-IP assay to detect the interaction between endogenous RH1 and R-loops in U2OS cells. Cells were treated with Ctrl or siA, followed by the treatment with 1 μM CPT for 4 hours or actinomycin D (5 μg/ml) for 6 hours, as in (A).
Fig. 3.
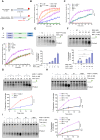
Fig. 3.. AND-1 stimulates the endonuclease activity of RNase H1.
(A) Schematic representation of the fluorescence-based RNase H1 (RH1) activity assay. (B) Relative fluorescence intensity of R:D substrates incubated with indicated amounts of WT RH1 or RH1D210N. (C) Relative fluorescence intensity of R:D substrates incubated with 2 nM RH1 alone or premixed with 40 nM BSA or AND-1. (D) Top: Schematic representation of AND-1 (FL) and its truncated mutants. Bottom: Relative fluorescence intensity of R:D substrates incubated with 2 nM RH1 alone or premixed with 40 nM AND-1 (FL) or two mutants (1-984 and S1). (E) Gel-based assay to detect RH1 activity. FAM-labeled R:D substrates were incubated with RH1D210N or with increasing concentrations of RH1 for 20 min. The cleavage of substrates was analyzed on a 12% denaturing PAGE. Bottom: Quantification of cleaved substrates. (F) FAM-labeled R:D substrates were incubated with RH1 and either BSA or increasing concentrations of AND-1 for 20 min, followed by gel analysis as in (E). Bottom: Quantification of cleaved products. (G) Time-course analysis of RH1 activity. FAM-labeled R:D substrates were incubated with RH1 in the presence or absence of AND-1. The reactions were analyzed at indicated time points. Bottom: Quantification of cleaved products. (H) FAM-labeled R:D substrates were incubated with RH1 alone or with AND-1 (FL, 1-984, or S1) for the indicated time points. Bottom: Quantification of cleaved products shown in top panel. (I) FAM-labeled R-loop substrates (1 μM) were incubated with RH1 alone or with AND-1 (FL, 1-984, or S1) for the indicated time points. Right: The cleaved products were quantified. n = 3. Data are shown as means ± SD. *P < 0.05; ***P < 0.001; ****P < 0.0001; n.s., not significant, compared to RH1-alone group, based on unpaired two-tailed Student’s t tests.
Fig. 4.
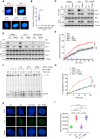
Fig. 4.. Phosphorylation of AND-1 at T826 is crucial for its role in R-loop regulation.
(A and B) PLA (A) and quantification (B) of U2OS cells cotransfected with V5-RNase H1D210N and FLAG–AND-1 (WT) or mutant (T826A). Anti-FLAG and anti-V5 antibodies were used. Scale bars, 10 μm. n = 50. Data are shown as means ± SD. ****P < 0.0001, based on unpaired two-tailed Student’s t tests. (C) Co-IP assay in AND-1 KO U2OS cells transfected with FLAG-empty vector (Ctrl) and FLAG- AND-1 (WT or T826A). Cells were treated with 1 μM CPT for 4 hours or with ATR inhibitor (VE-821, 2.5 μM for 12 hours) and CPT. Cell lysates were immunoprecipitated with anti-FLAG antibody. (D) S9.6 co-IP to show the interaction between RH1 and R-loops under the treatment as (C). (E) Fluorescence-based RNase H1 (RH1) activity assay. FAM-labeled R:D substrates (1 μM) were incubated with 2 nM RNase H1 alone or in the presence of 40 nM AND-1 (RH1 + WT), phosphatase-treated AND-1 (RH1 + WT-P), or T826A AND-1 (RH1 + T826A). n = 3. Data are shown as means ± SD. ****P < 0.0001; n.s., not significant, when compared with the RH1 group, based on unpaired two-tailed Student’s t tests. (F and G) Gel-based RH1 activity assay (F) and quantification of cleaved products (G). FAM-labeled R-loop substrates (1 μM) were incubated with RH1 in the presence or absence of 40 nM WT AND-1, WT-P, or T826A. n = 3. Data are shown as means ± SD. ****P < 0.0001; n.s., not significant, based on unpaired two-tailed Student’s t tests. (H and I) S9.6 Immunostaining (H) and quantification (I) in U2OS cells treated with control siRNA (Ctrl), AND-1 siRNA (siA), or siA with plasmid expressing WT or T826A AND-1. Scale bars, 5 μm. n = 50. Data are shown as means ± SD. ***P < 0.001; ****P < 0.0001; n.s., not significant, based on unpaired two-tailed Student’s t tests.
Fig. 5.
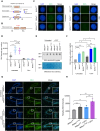
Fig. 5.. AND-1 is required for R-loop regulation in AND-1–deficient mice.
(A) Schematic illustration of the CRISPR-Cas9–mediated generation of the Wdhd1-floxed allele. Guide RNAs (gRNAs) were designed to target sites upstream and downstream of the eighth coding exon of Wdhd1, guiding Cas9 to create double-strand breaks (green vertical arrows). These breaks are then mended by homology-directed repair (HDR) using a donor template, which contains the two loxP sites and homology arms. Two pairs of screening primers as indicated are designed and used to screen the founders. (B) Schematic illustration of CRISPR-Cas9–mediated generation of the Wdhd1 T819A allele within the exon 18, along with the locations of PCR primers (F3a and R3a) used for screening. Wdhd1 T819 was mutated from ACC (T) to GCA (A). (C and D) Immunostaining (C) and quantification (D) of S9.6 nuclear fluorescence signal in indicated MEF cells pretreated with or without RH. All cells were pretreated with a combination of RNases A, T1, and III. Scale bars, 10 μm. n = 50. Data are shown as means ± SD. ****P < 0.0001; n.s., not significant, based on unpaired two-tailed Student’s t tests. (E and F) S9.6 dot blot (E) and quantification (F) using genomic DNA extracted from indicated MEF cells treated with or without 1 μM CPT for 4 hours before harvest. n = 3. Data are shown as means ± SD. *P < 0.05; ***P < 0.001, based on unpaired two-tailed Student’s t tests. (G and H) R-loop IF images (G) and quantification of the relative R-loop intensity (H) in mouse mammary gland from 17- to 18-week-old virgin Wdhd1 WT and Wdhd1T819A mice. Scale bars, 50 μm and 10 μm (inset). Five animals were used in each group. Data are shown as means ± SD. **P < 0.01; ***P < 0.001, based on unpaired two-tailed Student’s t tests.
Fig. 6.
Fig. 6.. AND-1 regulates ESR1 expression by suppressing R-loops located within the ESR1-RE region.
(A and B) S9.6 dot blot (A) and quantification (B) using genomic DNA extracted from MCF7 cells treated with control siRNA (Ctrl), AND-1 siRNA (siA), or siA with plasmid-mediated expression of the indicated AND-1 variants. (C) Schematic representation of the ESR1 genomic locus, including ESR1 gene (blue), ESR1 super-enhancer region (yellow), and ESR1 regulatory element (ESR1-RE; red). (D) DNA-RNA immunoprecipitation (DRIP) combined with qPCR (DRIP-qPCR) to detect R-loop enrichment at ESR1-RE region in MCF7 cells. Cells were transfected with V5-empty vector (Vec) or V5-RNase H1 (RH1). (E) ChIP-qPCR to detect AND-1 enrichment at ESR1-RE region in MCF7 cells transfected with V5-Vec or V5-RH1. (F) DRIP-qPCR to detect R-loop enrichment at ESR1-RE region in MCF7 cells expressing V5-Vec or V5-RH1 and treated with Ctrl or siA. (G and H) qPCR (G) and Western blot (H) to detect ESR1 mRNA or protein levels in MCF7 cells treated with Ctrl, siA, or siA with plasmid-mediated expression of the WT AND-1 (WT) or T816A mutant (TA). (I and J) mRNA (I) and protein (J) levels of ESR1 in MCF7 cells transfected with V5-Vec or V5-RH1 plasmid and treated with Con, siA, or siA and AND-1 (WT) or T816A mutant (TA) as in (H). (K and L) mRNA (K) and protein (L) levels of ESR1 in MCF7 cells (WT) and MCF7 cells with depletion of ESR1-RE (ESR1-RE KO). Cells were treated as in (H). Statistical analysis for (B), (D) to (G), (I), and (K). n = 3. Data are shown as means ± SD. *P < 0.05; **P < 0.01; ***P < 0.001; ****P < 0.0001; n.s., not significant, based on unpaired two-tailed Student’s t tests.
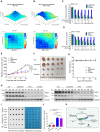
Fig. 7.
Fig. 7.. Inhibition of AND-1 overcomes resistance to AI (letrozole).
(A and B) Surface plots (top) and synergy matrix (bottom) showing the synergistic effect of AND-1 inhibitor (CH3) with AI (letrozole) in breast cancer cells, including WT (MCF7 WT) (A) and letrozole resistant cells (MCF7 Y537S) (B). (C and D) Synergetic effect of CH3 and Letrozole in MCF7 WT (C) and MCF7 Y537S (D) cells. Cells treated with indicated concentration of inhibitors were harvested 72 hours posttreatment. The combination index (CI) values were presented below the bars. (E and F) Tumor growth of MCF7 Y537S xenograft tumor-bearing mice intraperitoneally treated with control, letrozole (20 mg/kg), CH3 (20 mg/kg), or combination of letrozole and CH3 for 20 days, administered once every 2 days. n = 5. Data are shown as means ± SD. **P < 0.01; ****P < 0.0001; n.s., not significant. All the data were analyzed on the basis of unpaired two-tailed Student’s t tests. (G) Body weights of MCF7 Y537S xenograft tumor-bearing mice during treatment as in (E) and (F). (H) Immunoblot analysis of AND-1 and ER-α protein levels of tumor samples in each experiment group. Five animals were used in each group. GAPDH, glyceraldehyde-3-phosphate dehydrogenase. (I and J) S9.6 dot blot (I) and quantification (J) using genomic DNA extracted from tumor samples from mice bearing MCF7 Y537S xenograft tumors intraperitoneally treated with indicated drugs as in (E) and (F). Five animals were used in each group. Data are shown as means ± SD. ****P < 0.0001; n.s., not significant, based on unpaired two-tailed Student’s t tests. (K) Schematic representation of the mechanism. AND-1 directly binds to R-loop structures, where it promotes RNase H1 recruitment to R-loops and stimulates endonuclease activity of RNase H1.

References

    1. Carles-Kinch K., Kreuzer K. N., RNA-DNA hybrid formation at a bacteriophage T4 replication origin. J. Mol. Biol. 266, 915–926 (1997). - PubMed
    1. Lee D. Y., Clayton D. A., Properties of a primer RNA-DNA hybrid at the mouse mitochondrial DNA leading-strand origin of replication. J. Biol. Chem. 271, 24262–24269 (1996). - PubMed
    1. Xu B., Clayton D. A., RNA-DNA hybrid formation at the human mitochondrial heavy-strand origin ceases at replication start sites: An implication for RNA-DNA hybrids serving as primers. EMBO J. 15, 3135–3143 (1996). - PMC - PubMed
    1. Yu K., Chedin F., Hsieh C. L., Wilson T. E., Lieber M. R., R-loops at immunoglobulin class switch regions in the chromosomes of stimulated B cells. Nat. Immunol. 4, 442–451 (2003). - PubMed
    1. Skourti-Stathaki K., Kamieniarz-Gdula K., Proudfoot N. J., R-loops induce repressive chromatin marks over mammalian gene terminators. Nature 516, 436–439 (2014). - PMC - PubMed

MeSH terms