. 2025 Aug 8;11(32):eadw2232.
doi: 10.1126/sciadv.adw2232. Epub 2025 Aug 6.

Life in the slowest lane: Feeding allometry lowers metabolic rate scaling in the largest whales

Affiliations

Life in the slowest lane: Feeding allometry lowers metabolic rate scaling in the largest whales

Ashley M Blawas et al. Sci Adv. .

Abstract

The hypothesized impacts of whale foraging on ocean productivity are ultimately defined by their metabolic rate, but determining energy expenditure for ocean giants remains challenging. The largest baleen whales use a high-drag lunge-feeding strategy that is hypothesized to come at a high energetic cost, thus requiring exceptional calorie intake. We used biologging tags to measure respiratory rates in foraging rorquals and demonstrate that their field metabolic rates are less than half that predicted by prey consumption estimates and by scaling predictions from smaller marine mammals. The relative cost of rorqual foraging decreases with increasing size as larger whales spend disproportionately longer time filtering prey from engulfed water. By decoupling active swimming and filtration, the largest rorquals forage with limited movement costs. The evolution of lunge feeding confers an energetic advantage that is unique among filter feeders and may have provided an evolutionary pathway to the largest body sizes.


Figures

Fig. 1.
Fig. 1.. A comparison of feeding dives across three baleen whale species.
Relative body lengths (A) of blue whales (B. musculus), humpback whales (M. novaeangliae), and Antarctic minke whales (B. bonaerensis) and corresponding (B) dive profiles with lunges marked by red circles and breaths for 2 min following each dive marked by blue circles, (C) speed profiles with mean speed indicated by a dashed black line, (D) accumulated turning, (E) accumulated filtering time, and (F) diagrams showing increasing mass-specific engulfment capacity with increasing size in rorqual whales. Mass-specific engulfment capacities are estimated using species-specific regressions published in (113) using approximate species total lengths of 23, 11, and 6 m for blue, humpback, and Antarctic minke whales, respectively. Image credit: Duke Marine Robotics and Remote Sensing, Duke University.
Fig. 2.
Fig. 2.. Metabolic scope of three baleen whale species.
FMR scaling during foraging (F) and non-foraging (NF) bouts (A), (B) the ratio of FMR during foraging and non-foraging bouts, (C) mean speed during foraging and non-foraging bouts, and (D) mean angular velocity during foraging and non-foraging bouts. Each point represents a tagged individual, and outliers of the distribution are designated with x’s. Asterisks indicate the significance of a Wilcoxon rank sum test.
Fig. 3.
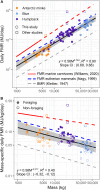
Fig. 3.. Scaling of FMRs and mass-specific FMRs of baleen whales on the foraging grounds.
Each point represents the body mass and FMR of a tagged individual. Circles indicate data from this study, and squares indicate data from other studies (12, 15). The solid black line in both plots represents the fixed-effect models represented by the provided regression equation of FMRs (A) and mass-specific FMRs (B) across all tag records (n = 83) with the marginal coefficient of determination (R2) value and 95% confidence intervals (95% CIs) for the regression slope. CIs (95%) are shaded in gray. The red, blue, and dashed gray lines represent previously published regressions for metabolic rate scaling relationships (14, 64, 114). For these previously published regressions, a solid line indicates the body mass range that was included in the data collected and a dashed line indicates the regression plotted into an extrapolated body mass range. In (A), each whale (n = 83) is represented by one point, which includes foraging and non-foraging periods. In (B), only whales included in the bout analysis are plotted as points with each whale (n = 44) represented by two points, one for foraging bout FMR (closed circles) and one for non-foraging bout FMR (open circles).

References

    1. Kleiber M., Body size and metabolism. Hilgardia 6, 316–352 (1932).
    1. M. Kleiber, The Fire of Life. An Introduction to Animal Energetics. (John Wiley & Sons, Inc., New York; 1961).
    1. R. H. Peters, The Ecological Implications of Body Size (Cambridge Univ. Press, 1983) Cambridge Studies in Ecology.
    1. K. Schmidt-Nielsen, Scaling: Why Is Animal Size so Important? (Cambridge Univ. Press, 1984).
    1. Brown J. H., Burger J. R., Hou C., Hall C. A. S., The pace of life: Metabolic energy, biological time, and life history. Integr. Comp. Biol., icac058 (2022). - PubMed

LinkOut - more resources