. 2025 Aug 6;17(810):eadt1452.
doi: 10.1126/scitranslmed.adt1452. Epub 2025 Aug 6.

Nasal and systemic immune responses correlate with viral shedding after influenza challenge in people with complex preexisting immunity

Affiliations

Nasal and systemic immune responses correlate with viral shedding after influenza challenge in people with complex preexisting immunity

Kathie-Anne Walters et al. Sci Transl Med. .

Abstract

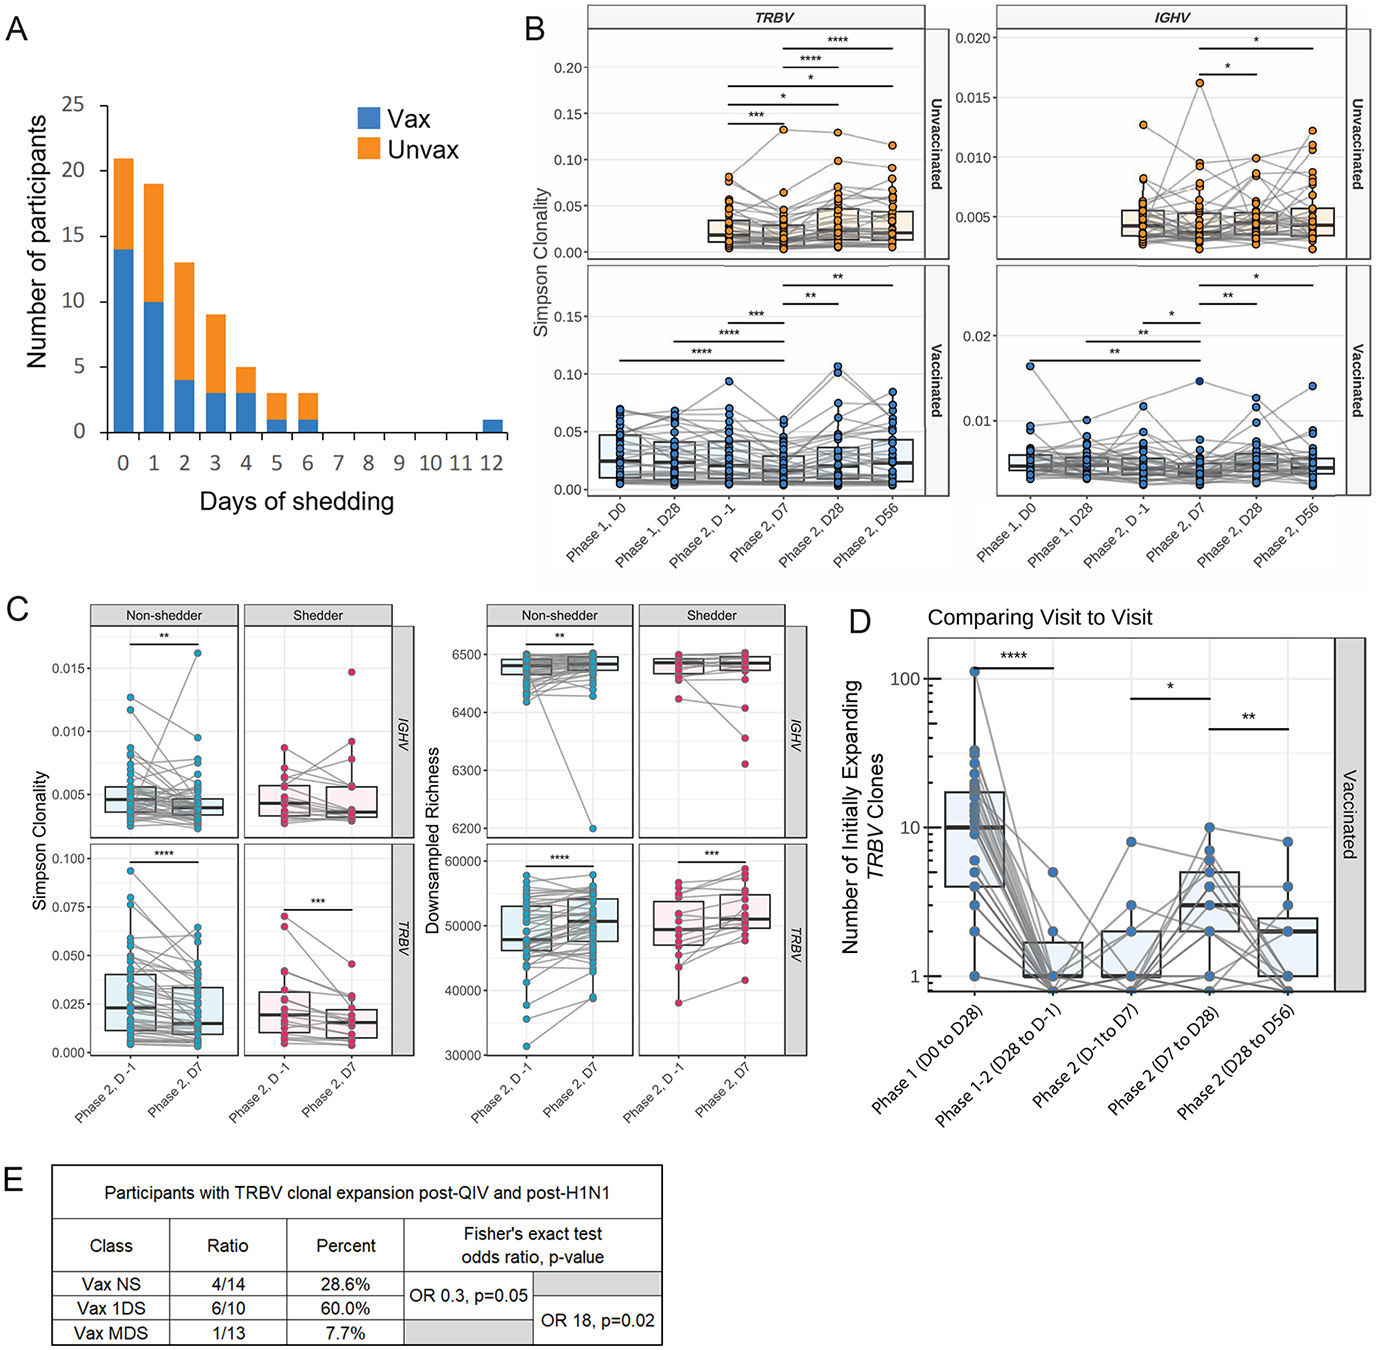
Each year in the United States, ~50% of adults ≥18 years old are vaccinated against influenza viruses, with protective efficacy averaging 40.5% over the past 20 years. To model annual seasonal influenza, a cohort of 74 adults, who were unscreened for preexisting A/H1N1 immunity and half of whom were recently immunized with licensed QIV (mean of 64 days), were challenged with A/H1N1 influenza virus. Transcriptomic, proteomic, and VDJ repertoire analyses were performed on nasal and peripheral blood samples from participants to identify nasal mucosal and systemic immune responses that correlated with viral shedding and immune correlates of protection. Viral-shedding participants showed increased T cell, but not B cell, VDJ diversity with expansion of low-frequency B cell clones postchallenge, including broadly neutralizing motifs. Nonshedding participants demonstrated decreased clonality and increased richness of B and T cell VDJ clones, increased preinoculation nasal mucosal immune gene and serum protein expression, and increased ex vivo peripheral blood mononuclear cell responses. Nasal mucosal responses in participants shedding virus for 2 or more days showed higher early viral loads and exhibited stronger induction of antiviral responses compared with those in participants who shed virus for 1 day. Last, participants with a single day of viral shedding were three times more likely to be female. These data shed light on the complex immune responses in the nasal mucosa and the periphery after influenza vaccination and infection, which will be critical for next-generation vaccine development.


Figures

Fig. 1:
Fig. 1:. Study design with viral shedding outcomes and Poisson regression of baseline nasal SIgA and serum HAI titers.
(A) Healthy participants 18 to 45 years of age were enrolled independent of pre-existing immunity against challenge virus. Half the participants were previously vaccinated prior to challenge using licensed 2018 quadrivalent influenza vaccine (QIV) at the NIH Clinical Center (11). Nasal wash positivity for H1N1 challenge virus was determined by Biofire Respiratory Pathogens Panel (RPP). The p-values were calculated for the enrichment of the two compared classes using the corresponding one-sided Fisher exact test. (B) Poisson regression model of baseline (D-1) serum HAI and nasal mucosal SIgA titers. The models treat length of shedding as outcome, considers age, sex, vaccination status, and antibody titer as variables. For all models, antibody titers on D-1 were used. Reported estimated coefficients and p-values are shown; *p<0.05.
Fig. 2:
Fig. 2:. Vaccination and H1N1 challenge affected shedding outcome and B and T cell VDJ repertoire diversity.
(A) Shown are the number of participants shedding virus each day post-challenge. Numbers of vaccinated and unvaccinated participants in each group are indicated by blue and orange bars, respectively. (B) T and B cell VDJ repertoire immunosequencing showing changes in Simpson’s clonality on D0 and D28 post-vaccination (Phase 1) and on D-1, D7, D28, and D56 post-challenge (Phase 2) in unvaccinated (orange) and vaccinated participants (11). (C) B and T cell VDJ analysis of D7 post-challenge clonality and down-sampled richness in viral non-shedders (teal) versus shedders (pink). (D) Shown are the number of initially expanding vaccine-associated T cell clones over time following vaccination and challenge. Data in (B to D) are presented as box plots, which show the minimum, the first quartile (Q1), the median, the third quartile (Q3), and the maximum Simpson’s clonality or number of initially expanding TRBV clones, respectively, with lines connecting individual participants values. All unadjusted Wilcoxon signed rank p-values <0.10 are shown in (B to D). (E) Association of post-QIV and post-H1N1 challenge T cell TRBV clonal expansion and shedding outcomes, as determined by Fisher’s exact test. *p<0.05, **p<0.01, ***p<0.001, ****p<0.0001
Fig. 3:
Fig. 3:. Nasal mucosal gene and protein expression correlate with viral shedding.
(A) Plot of IAV M gene RNA in nasal mucosal samples collected on D1 and D3 post-challenge; asterisks denote differences with p<0.05 by t-test. n=69 participants. (B) Heatmap showing kinetics of expression of shedding-associated genes on D-1, D1, D3, and D7 post-challenge and relationship to viral load and FluPro symptom scores (11) in a subset of vaccinated (blue) and unvaccinated (orange) RPP(+) and RPP(−) participants. Genes shown in yellow and blue are increased or decreased, respectively, relative to each participant’s D-1 baseline. n=15 participants. Increasing blue color indicates increasing FluPro score and increasing pink color indicates increasing IAV M gene expression. (C) Plots of proteins with increased expression in RPP(+) compared with RPP(−) on D3 or D5 post-challenge. (D) Plots of proteins with higher expression in RPP(−) compared with RPP(+) participants. Values in (C and D) were statistically significant (p<0.05) between the groups using standard t-test with Benjamini Hochberg correction. Scale of Olink Normalized Protein eXpression (NPX) is log(2). Box plots show the minimum, the first quartile (Q1), the median, the third quartile (Q3), and the maximum expression values. For (C and D), +p<0.05 D3 only, ++p<0.05 D5 only, +++p<0.05 D3 and D5, n=66 participants. (E) Kinetics of nasal mucosal protein expression. The intensity of the red color indicates the number of times the protein's NPX values are significantly differentially expressed (t-test p<0.01) at that timepoint in up to twelve pairwise comparisons of shedding and vaccination classes. n=66 participants. Cell type expression was determined using proteinatlas.org. MAIT, mucosal-associated invariant T cell.
Fig. 4:
Fig. 4:. Distinct nasal mucosal and peripheral blood responses correlate with viral shedding outcomes.
(A) Venn diagram of shedding-associated genes identified by t-test (p< 0.05) with Benjamini Hochberg correction) in expression microarray D3 post-challenge in nasal mucosal (n=74 participants) and PBMC samples (n=74 participants). Gene ontology shows pathway enrichment of shedding-associated sequences in either nasal mucosal or PBMC compartments. (B) Venn diagram of shedding-associated proteins identified by t-test (p< 0.05 with Benjamini Hochberg correction) in nasal (n=66 participants) and serum (n=74 participants) samples collected on D3 or D5 post-challenge. *Protein that is increased in mucosal samples and decreased in serum samples from shedders; **Protein decreased in mucosal samples and increased in serum samples from shedders. (C) Plots represent NPX expression values (log(2) of shedding-associated proteins in NS (teal) and shedders (pink) that are common to serum and nasal mucosal samples. Box plots show the minimum, the first quartile (Q1), the median, the third quartile (Q3), and the maximum expression values. +p<0.05 D3 only, ++p<0.05 D5 only, +++p<0.05 D3 and D5, n=66 participants. Scale of Olink NPX is log(2).
Fig. 5:
Fig. 5:. Changes in nasal mucosal gene and protein expression associated with shedding in vaccinated and unvaccinated participants.
(A) Principal component analysis of shedding-associated sequences on D3 identified by ANOVA with Tukey’s Honest Significant Difference (HSD; p<0.05) comparing vaccinated and unvaccinated (orange) shedders (n=23 participants). PC1, principal component 1; PC2, principal component 2. (B) Pathway analysis comparing D3 shedding-associated sequences in vaccinated and unvaccinated participants (n=23 participants). (C) Plots of nasal mucosal proteins with different expression in vaccinated compared to unvaccinated shedders (n=23 participants) on D3. NPX values (log(2)) were statistically significant (p<0.05) between vaccinated and unvaccinated shedders, but not between non-shedders using standard t-test with Benjamini Hochberg correction. Plots show data in NS (teal) and shedders (pink). Box plots show the minimum, the first quartile (Q1), the median, the third quartile (Q3), and the maximum expression values. (D) Two-dimensional clustering of Kolmogorov-Smirnov (KS) test values showing related KEGG pathways that were differentially regulated between vaccinated and unvaccinated shedders on D3. Pathways shown had minimum significance proportion of 0.05. (E) KEGG pathways identified in clusters A, B, and C.
Fig. 6:
Fig. 6:. Differential PBMC ex vivo responsiveness in multimodal shedding and vaccination groups.
PBMCs collected from participants at D1 and D3 post-challenge were stimulated ex vivo with infectious A/Bethesda/MM2/H1N1 virus (n=44 participants). Supernatant proteins were quantified by Olink proteomics. (A) Plots show expression of proteins from PBMCs collected D1 post-challenge associated with T cell activation and recruitment, oxidative stress, or antiviral responses. Values were statistically significant between the NS, 1DS or MDS groups using one-way ANOVA (p<0.05). *p<0.05. (B) Plots showing expression of proteins from PBMCs collected D3 post-challenge. Values were statistically significant between the NS, 1DS or MDS groups using one-way ANOVA (p<0.05). *p<0.05. (C) Plots showing expression of proteins collected D1 post-challenge that showed significant differences between vaccinated (vax) and unvaccinated (unvax) MDS shedders by standard t-test (p<0.05). Data are presented as box plots, which show the minimum, the first quartile (Q1), the median, the third quartile (Q3), and the maximum. Scale of Olink NPX is log(2).

Similar articles

References

    1. C. f. D. Control. (Center for Disease Control, https://www.cdc.gov/flu-burden/php/about/index.html, 2024), vol. 2024.
    1. Iuliano AD, Roguski KM, Chang HH, Muscatello DJ, Palekar R, Tempia S, Cohen C, Gran JM, Schanzer D, Cowling BJ, Wu P, Kyncl J, Ang LW, Park M, Redlberger-Fritz M, Yu H, Espenhain L, Krishnan A, Emukule G, van Asten L, Pereira da Silva S, Aungkulanon S, Buchholz U, Widdowson MA, Bresee JS, Estimates of global seasonal influenza-associated respiratory mortality: a modelling study. Lancet 391, 1285–1300 (2018). - PMC - PubMed
    1. Honigsbaum M, Revisiting the 1957 and 1968 influenza pandemics. Lancet 395, 1824–1826 (2020). - PMC - PubMed
    1. Taubenberger JK, Kash JC, Morens DM, The 1918 influenza pandemic: 100 years of questions answered and unanswered. Sci Transl Med 11, (2019). - PMC - PubMed
    1. Verschoor CP, Andrew MK, Loeb M, Pawelec G, Haynes L, Kuchel GA, McElhaney JE, Antibody and Cell-Mediated Immune Responses Are Correlates of Protection against Influenza Infection in Vaccinated Older Adults. Vaccines (Basel) 9, (2021). - PMC - PubMed

Substances