. 2025 Aug 14;22(4):046045.
doi: 10.1088/1741-2552/adf887.

Group optimization methods for dose planning in tES

Affiliations

Group optimization methods for dose planning in tES

R Salvador et al. J Neural Eng. .

Abstract

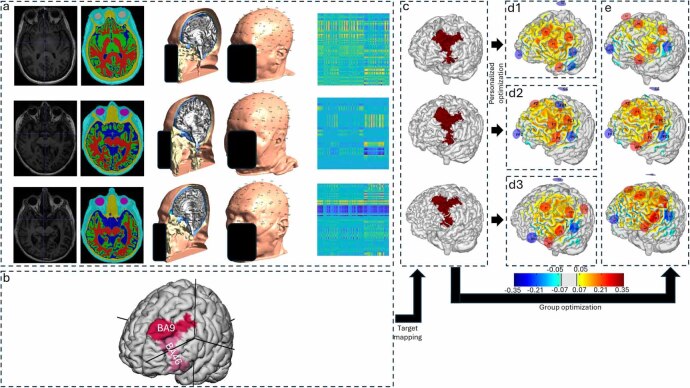
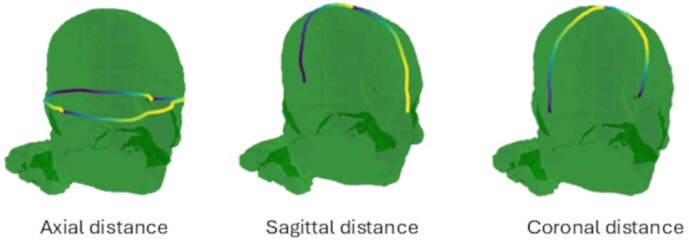
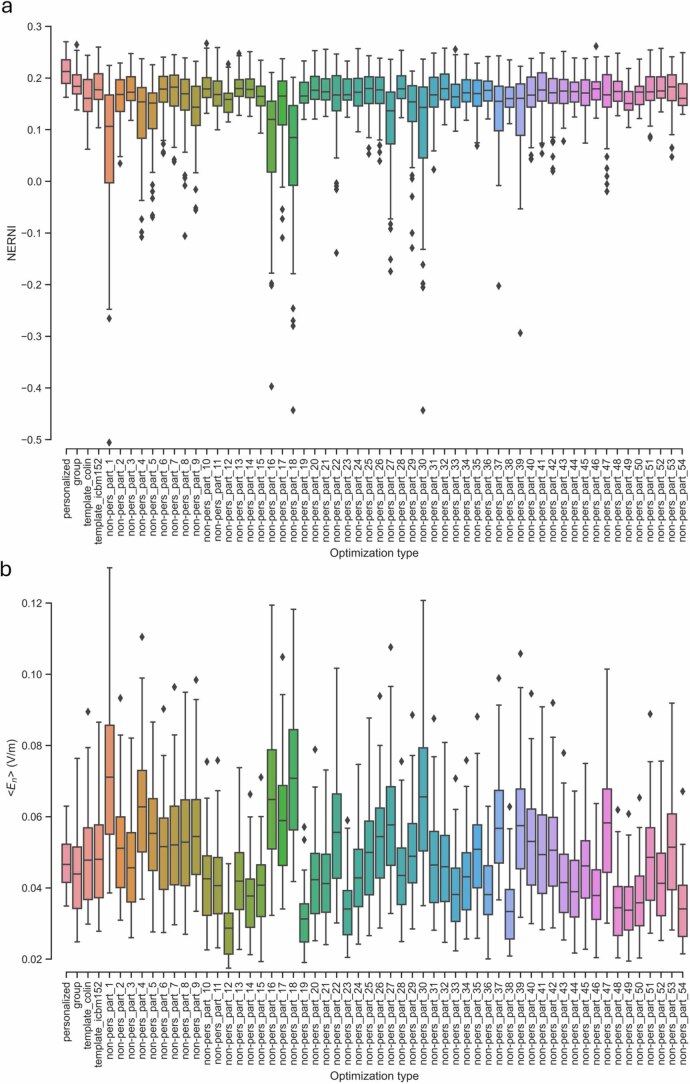
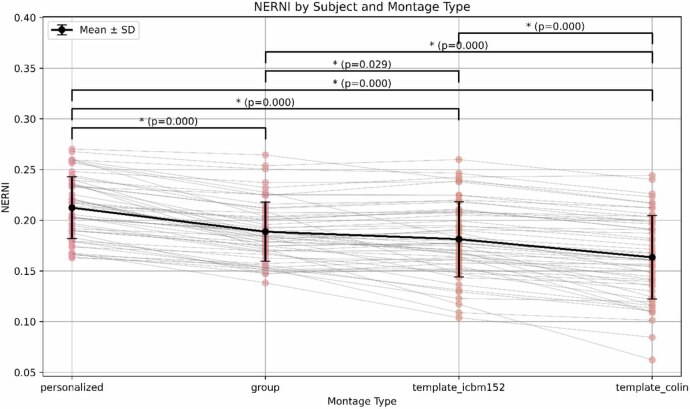
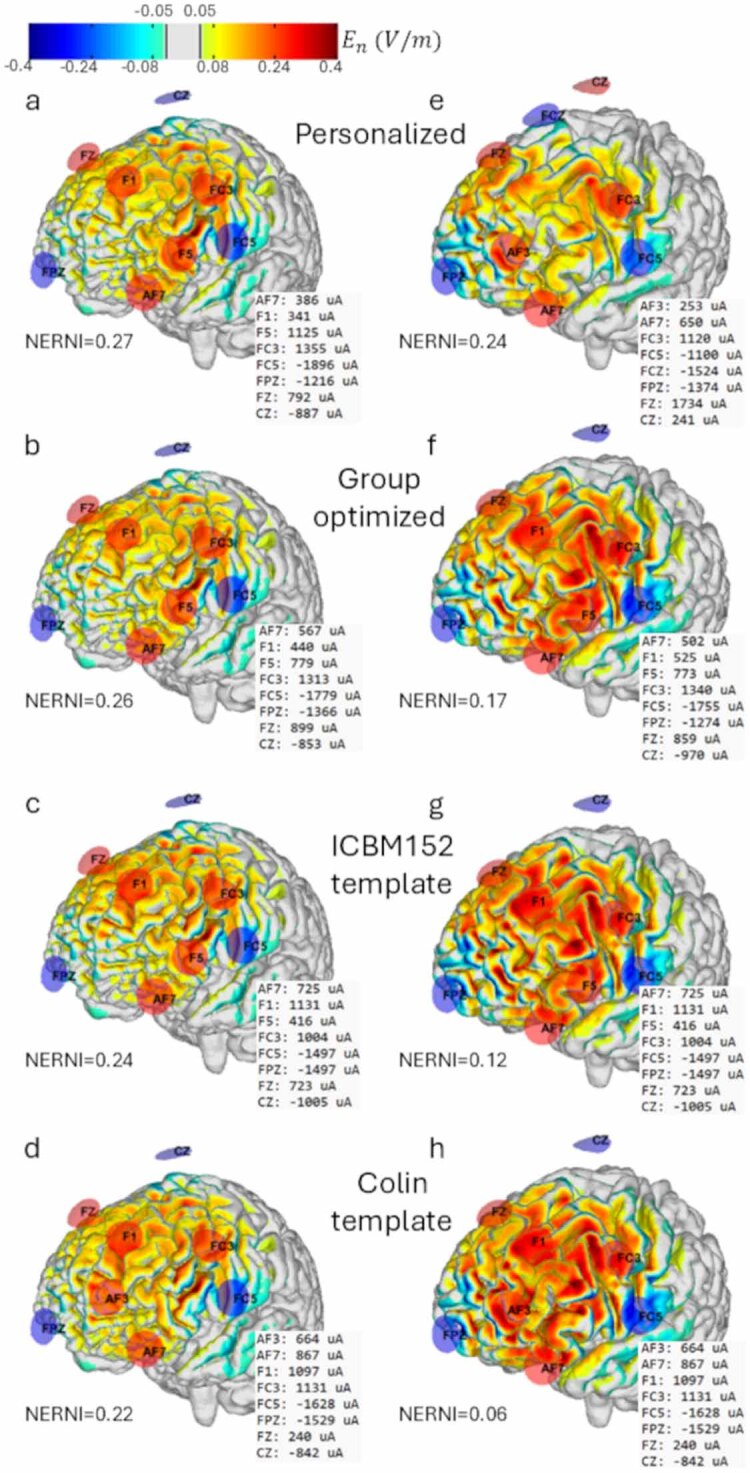
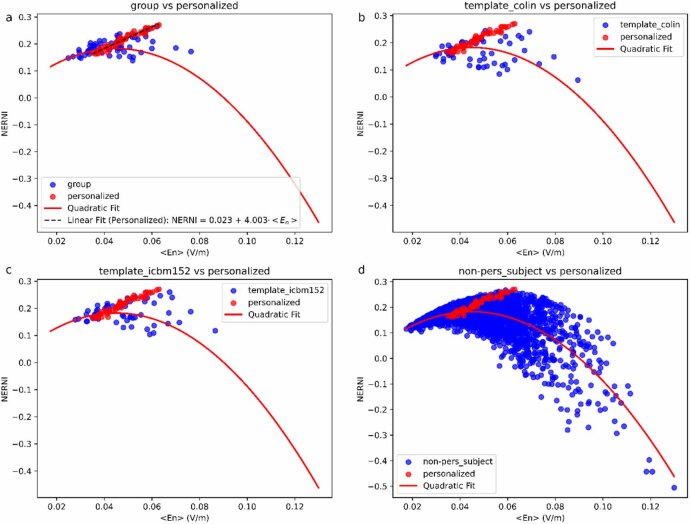
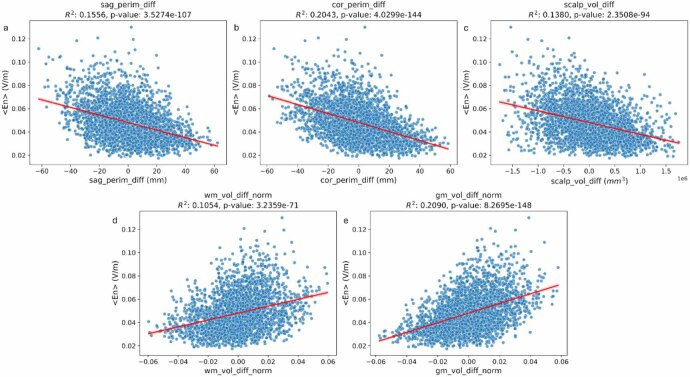
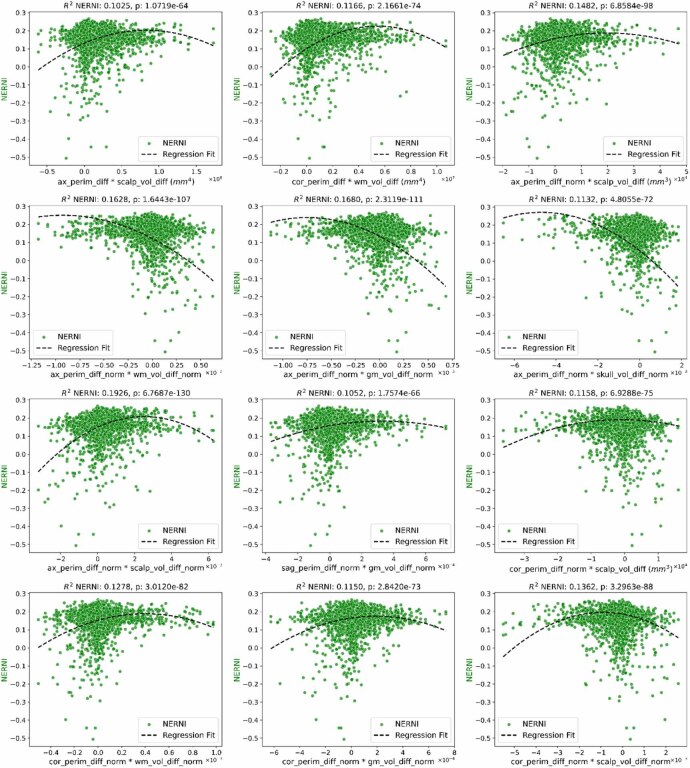
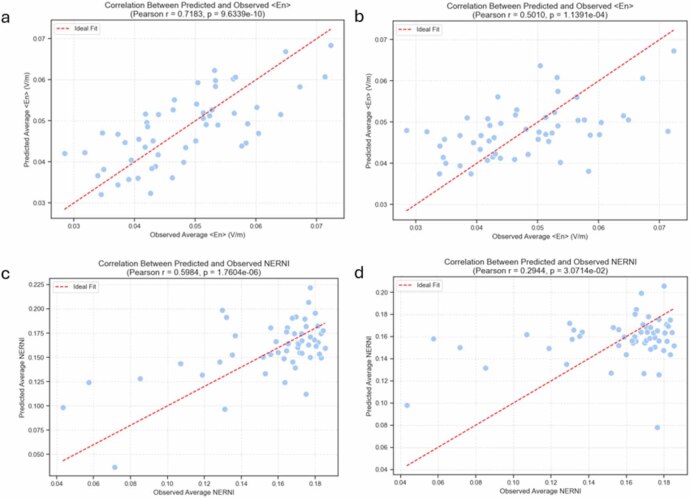
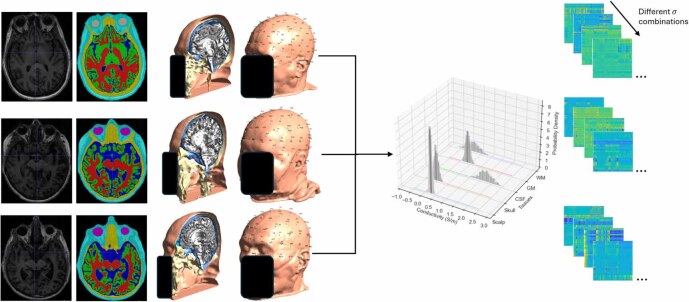
Objective.Optimizing transcranial electrical stimulation (tES) parameters-including stimulator settings and electrode placements, using magnetic resonance imaging-derived head models is essential for achieving precise electric field (E-field) distributions, enhancing therapeutic efficacy, and reducing inter-individual variability. However, the dependence on individually personalized MRI-based models limits their scalability in some clinical and research contexts. To overcome this limitation, we propose a novel group-level optimization framework employing multiple representative head models.Approach.The proposed optimization approach utilizes computational modeling based on multiple representative head models, selected to minimize group-level error compared to baseline (no stimulation). This method effectively balances focal stimulation intensity within targeted brain regions while minimizing off-target effects. We evaluated our method through computational modeling and leave-one-out cross-validation using data from 54 subjects, and analyzed the effectiveness, generalizability, and predictive utility of anatomical characteristics.Main results.Group-optimized protocols significantly outperformed standard template-based approaches when within-subject variability was accounted for using paired analyzes. Although average performance differences appeared modest in aggregate comparisons, paired statistical tests revealed that group-based solutions yielded systematically better targeting across participants. Additionally, group protocols consistently reduced the occurrence of poor outcomes observed with some templates. Correlations between anatomical features (e.g. head perimeter and tissue volumes) and E-field parameters revealed predictive relationships. This insight enables further optimization improvements through the strategic selection of representative head models that are electro-anatomically similar to the target subjects. Importantly, this approach eliminates the need fora prioriselection of a single representative template, offering a scalable and more flexible alternative when individualized MRI-based models are not available.Significance.The proposed group optimization framework provides a scalable and robust alternative to personalized approaches, substantially enhancing the feasibility and accessibility of model-driven tES protocols in diverse clinical and research environments.

Keywords: computational models; dose parameter; transcranial electrical stimulation.


Conflict of interest statement

Dr Ricardo Salvador works for Neuroelectrics Barcelona SLU, a company developing computationally-driven brain stimulation solutions. Dr Giulio Ruffini works for and is a co-founder of Neuroelectrics and holds several patents in model-driven non-invasive brain stimulation.

Figures

Figure 1.
Figure 1.
Overview of the modeling and optimization pipeline used in this study. (a) Left to right: structural head MRIs were segmented into major tissue types (skin, skull, cerebrospinal fluid, gray matter, and white matter); a tetrahedral finite element mesh was generated for electric field computation; 10–10 electroencephalography (EEG) system electrode positions were mapped to the surface of the scalp; and the lead-field matrix for the normal component of the electric field (En) was calculated. Each column of the matrix represents the cortical En-field induced by injecting 1 mA at a single electrode with Cz held as the fixed cathode. A 64 × 64 cropped section of the full matrix is shown for visualization clarity. The matrix visualization is provided as a qualitative illustration of the modeling process. (b) The stimulation target-the left dorsolateral prefrontal cortex (lDLPFC)- was defined in the head surface of the Montreal Neurological Institute (MNI) template as the union of Brodmann areas 9 and 46. (c) The lDLPFC target was then mapped to the gray-matter (GM) surface of each individual’s native head model. (d) For each participant, a personalized optimization was performed to maximize the electric field alignment with the target, using the normalized error with respect to no intervention (NERNI) as the cost function. The resulting En field distribution is shown on each participant’s GM surface. (e) Same as in panel (d), but using a group-optimized protocol obtained by maximizing the average NERNI across all participants (leave-one-out approach). All En maps are shown using a common color scale (in units of V m−1). All scalp surface reconstructions are anonymized.
Figure 2.
Figure 2.
Scalp reference distances measured along the scalp of one participant. The different curved lines represent geodesic distances between standard anatomical landmarks commonly used in the electroencephalography (EEG) 10–10 system: nasion (Nz), inion (Iz), left and right preauricular points (LPA and RPA). These paths were used to compute reference measurements such as head perimeters in the axial, sagittal, and coronal planes for subsequent anatomical feature analyzes.
Figure 3.
Figure 3.
Distributions of targeting outcomes across 64 participants, grouped by optimization type. (a) Distribution of the normalized error with respect to no intervention (NERNI), a measure of how closely the induced normal component of the electric field (En) matches the target map. (b) Distribution of the surface average of En in the target region (En). Each distribution corresponds to a different optimization approach: personalized (subject-specific), group-optimized, Colin-based template, ICBM152-based template, and templates derived from individual biophysical head models within the cohort (labeled as non-pers_part_<id>).
Figure 4.
Figure 4.
Normalized error with respect to no intervention (NERNI) values across 54 participants for each optimization approach. Gray lines show within-subject changes across montage types, while black circles with error bars indicate the group mean ± standard deviation. Statistical comparisons were conducted using two approaches: (1) a nonparametric Kruskal–Wallis test followed by post-hoc Dunn tests with Bonferroni correction, and (2) paired t-tests accounting for the repeated-measures design, also corrected for multiple comparisons. Annotated p-values reflect results from the paired t-tests. Asterisks denote statistically significant differences (p < 0.05, Bonferroni-corrected).
Figure 5.
Figure 5.
Distribution of the normal component of the electric field (En) on the cortical surface for two participants: one in whom the group-optimized protocol achieved the best fit (left column) and one in whom it performed the worst (right column), based on the normalized error with respect to no intervention (NERNI). For each participant, the panels (top to bottom) show the results from: the personalized protocol, the group-optimized protocol (leave-one-out approach), the protocol obtained with the ICBM152-based template, and the protocol obtained with the Colin-based template. All En distributions are visualized using a common color scale (in V m−1).
Figure 6.
Figure 6.
Relationship between the normalized error with respect to no intervention (NERNI) and the surface average of the normal component of the electric field En in the left dorsolateral prefrontal cortex (lDLPFC) across 64 participants. Each subplot compares one optimization approach (blue) with the personalized approach (red): (a) group-optimized, (b) Colin-based template, (c) ICBM152-based template, and (d) templates derived from individual biophysical head models within the cohort. The solid red line shows a quadratic fit to the combined dataset across all conditions, given by: NERNI = 0.003 + 7.999·En −89.125·<En>2. In panel (a), a dashed black line indicates the linear fit for the personalized data: this illustrates the tighter and more linear relationship observed in the personalized optimizations.
Figure 7.
Figure 7.
Linear regressions between the surface average of the normal component of the electric field on target (En) and differences in anatomical features between each participant and the template used to evaluate the protocol (i.e. a non-personalized template, based on the biophysical head model of one of the other participants). From left to right, the regressors are: (i) difference in head perimeter along the sagittal and coronal planes (sag/cor_perim_diff, a/b), (ii) difference in scalp volume (scalp_vol_diff, c), and (iii) difference in normalized gray and white matter volumes computed by dividing by the total head tissue volume (WM/GM _vol_diff_norm, d/e).
Figure 8.
Figure 8.
Linear regression results predicting the normalized error with respect to no intervention (NERNI) using anatomical features between participants and the non-personalized templates used to evaluate each protocol. The regressors include all first- and second-order interaction terms derived from combinations of anatomical features. Only models with R2 values larger than 0.1 are shown. Relevant features include: ax/cor_perim_diff (difference in scalp perimeter measured along the axial and coronal planes), ax/cor/sag_perim_diff (combined perimeter differences in axial, coronal and sagittal planes, normalized by the sum of all 3 perimeters), scalp/wm_vol_diff (difference in scalp and white matter volume), and scalp/wm/gm/skull_vol_diff_norm (differences in scalp, white matter, gray matter, and skull volume normalized by total tissue volume).
Figure 9.
Figure 9.
Predicted versus observed values of the surface average of the normal component of the electric field on the target region (En, top row) and the normalized error with respect to no intervention (NERNI, bottom row), obtained through leave-one-subject-out cross-validation. For each participant, a regression model was trained using the anatomical features and NERNI/En values from the remaining N−1 participants and used to predict that participant’s value. (a/c) Models include all anatomical features (scalp perimeters and tissue volumes); (b/d) models include only perimeter-derived features. Each point represents one participant. The diagonal line indicates perfect prediction.
Figure 10.
Figure 10.
Extension of the group optimization framework to account for variability in tissue conductivity. In this approach, each participant’s head model is repeated multiple times with different combinations of tissue conductivities, sampled from known or assumed population distributions. This enables the optimization to incorporate uncertainty in conductivity values and better reflect inter-subject variability in biophysical properties. This extension can be used to build more robust protocols when individual tissue conductivities are not precisely known.

Update of

Similar articles

References

    1. Antonakakis M, Schrader S, Aydin Ü, Khan A, Gross J, Zervakis M, Rampp S, Wolters C H. Inter-subject variability of skull conductivity and thickness in calibrated realistic head models. NeuroImage. 2020;223:117353. doi: 10.1016/j.neuroimage.2020.117353. - DOI - PubMed
    1. Aydin Ü, Rampp S, Wollbrink A, Kugel H, Cho J, Knosche T R, Grova C, Wellmer J, Wolters C H. Zoomed MRI guided by combined EEG/MEG source analysis: a multimodal approach for optimizing presurgical epilepsy work-up and its application in a multi-focal epilepsy patient case study. Brain Topogr. 2017;30:417–33. doi: 10.1007/s10548-017-0568-9. - DOI - PMC - PubMed
    1. Daoud M, et al. Stereo-EEG based personalized multichannel transcranial direct current stimulation in drug-resistant epilepsy. Clin. Neurophysiol. 2022;137:142–51. doi: 10.1016/J.CLINPH.2022.02.023. - DOI - PubMed
    1. Datta A, Bansal V, Diaz J, Patel J, Reato D, Bikson M. Gyri-precise head model of transcranial direct current stimulation: improved spatial focality using a ring electrode versus conventional rectangular pad. Brain Stimul. 2009;2:201–7. doi: 10.1016/j.brs.2009.03.005. - DOI - PMC - PubMed
    1. Dmochowski J P, Datta A, Bikson M, Su Y Z, Parra L C. Optimized multi-electrode stimulation increases focality and intensity at target. J. Neural Eng. 2011;8:046011. doi: 10.1088/1741-2560/8/4/046011. - DOI - PubMed

LinkOut - more resources