. 2025 Oct;646(8086):913-924.
doi: 10.1038/s41586-025-09477-y. Epub 2025 Aug 6.

Microglia-neuron crosstalk through Hex-GM2-MGL2 maintains brain homeostasis

Affiliations

Microglia-neuron crosstalk through Hex-GM2-MGL2 maintains brain homeostasis

Maximilian Frosch et al. Nature. 2025 Oct.

Abstract

As tissue-resident macrophages of the central nervous system parenchyma, microglia perform diverse essential functions during homeostasis and perturbations1. They primarily interact with neurons by means of synaptic engulfment and through the rapid elimination of apoptotic cells and non-functional synapses2. Here, by combining unbiased lipidomics and high-resolution spatial lipid imaging, deep single-cell transcriptome analysis and novel cell-type-specific mutants, we identified a previously unknown mode of microglial interaction with neurons. During homeostasis, microglia deliver the lysosomal enzyme β-hexosaminidase to neurons for the degradation of the ganglioside GM2 that is integral to maintaining cell membrane organization and function. Absence of Hexb, encoding the β subunit of β-hexosaminidase, in both mice and patients with neurodegenerative Sandhoff disease leads to a massive accumulation of GM2 derivatives in a characteristic spatiotemporal manner3. In mice, neuronal GM2 gangliosides subsequently engage the macrophage galactose-type lectin 2 receptor on microglia through N-acetylgalactosamine residues, leading to lethal neurodegeneration. Notably, replacement of microglia with peripherally derived microglia-like cells is able to break this degenerative cycle and fully restore central nervous system homeostasis. Our results reveal a mode of bidirectional microglia-neuron communication centred around GM2 ganglioside turnover, identify a microgliopathy and offer therapeutic avenues for these maladies.


Conflict of interest statement

Competing interests: The authors declare no competing interests.

Figures

Fig. 1
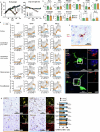
Fig. 1. Hexb expression in the mouse brain is highly microglia-enriched throughout CNS conditions, brain regions and development.
a, Uniform manifold approximation and projection (UMAP) of individual microglia from different conditions. 5xFAD and APP23 mice were used as models for Alzheimer’s disease, SOD1 mice for amyotrophic lateral sclerosis, R6/2 mice for Huntington’s disease and cuprizone-treated mice (Cup) to model demyelination. Each dot represents a single cell. Colours correspond to the condition investigated. Specific disease-associated microglia populations are detectable during demyelination and neurodegeneration. b, Violin plot depicting different microglial core genes and their expression during demyelination and neurodegeneration. c, Schematic overview of HexbtdT gene locus. A T2A–tdTomato cassette was inserted after exon 14 before the stop codon, allowing the expression of tdT and Hexb under the control of the endogenous Hexb gene locus. The self-cleaving peptide T2A ensures the separation of HEXB and tdT proteins. d, Representative immunofluorescence images of P56 HexbtdT/tdT mice showing high tdT positivity in P2RY12+ microglia (yellow) but not NeuN+ neurons (green) in the cortex. Triangles point to tdT+ microglia. e, Quantification of tdT+ CNS cells. Each symbol represents one individual mouse (n = 4), mean + s.e.m. is shown. At least 1,000 cells per individual were counted. mMϕ, leptomeningeal macrophage; pvMϕ, perivascular macrophage. f, Quantification of tdT+ microglia (IBA1+P2RY12+) in different brain regions at 56 days of age. Symbols represent individual mice (n = 4), mean + s.e.m. is shown. At least 1,000 cells per individual were counted. g, Quantification of tdT+ cortical microglia (IBA1+, green) at different ages (embryonic day 14.5 (E14.5), P1 and P56). Symbols represent individual mice (n = 4), mean + s.e.m. is shown. At least 1,000 cells per individual were counted. Scale bars, 25 μm. Illustration in c was created using BioRender. Frosch, M. (2025) https://BioRender.com/v74v524. Source data
Fig. 2
Fig. 2. Widespread and pronounced early-onset lysosomal activation of microglia is a key feature of Hexb-mediated pathology.
a, Latency to fall in the rotarod assay for Hexb−/− (n = 15), Hexb+/− (n = 15) and Hexb+/+ (n = 15) mice. b, Kaplan–Meier survival curve of Hexb−/− (n = 15), Hexb+/− (n = 15) and Hexb+/+ (n = 15) animals. c, Immunohistochemical pictures of sagittal brain sections from P120 Hexb−/− and Hexb+/− mice showing IBA1+ microglia (brown). Microglial density (colour-based) and APP+ deposits (black dots) are indicated (n = 4 per group). d, Top, immunofluorescence images of IBA1+ microglia (red), highlighting CD68+ lysosomes (green) from the thalamus at P120. Bottom, 3D reconstruction of IBA1+ microglia (red) and CD68+ lysosomes (green). e, Quantitative analysis of microglial morphologies. At least three cells per mouse were measured. f, Quantification of IBA1+ microglia in the thalamus over disease course. g, Representative immunohistochemical pictures of Mac-3+ microglia from the thalamus at P120 (left) and quantification thereof (right). At least 500 cells per mouse were measured. h, Immunohistochemical images from the thalamus at P120 (left) and quantification (right) of GFAP+ astrocytes. At least 300 cells per mouse were measured. i, Typical immunohistochemical pictures from the thalamus at P120 (left) and quantification (right) of APP+ deposits in the thalamus. At least 300 deposits per mouse were measured. nd, not detected. Data are shown as mean ± s.e.m. Statistical analyses: one-way analysis of variance (ANOVA) with Tukey’s post hoc test (a); log-rank test (b); two-tailed Student’s t-test (e); two-way ANOVA with Sidak’s test (fi); each symbol in ei represents an individual mouse. The colour code represents the genotype (orange, Hexb−/−; blue, Hexb+/−). Scale bars, 1 mm (c (main images)), 25 μm (c (magnified images),d,g,h,i). Source data
Fig. 3
Fig. 3. Molecular census of Hexb-deficient mouse brains.
a, UMAP visualization of 103,201 individual nuclei from the thalamus of P7 and P120 Hexb−/− and Hexb+/− mice captured by snRNA-seq. COP, committed oligodendrocyte precursor cell; NFO, newly formed oligodendrocyte; OPC, oligodendrocyte precursor cell; VLMC, vascular leptomeningeal cell. b, UMAP visualization of the immune cell subset. c, UMAP visualization of the microglia subset, coloured by cluster identity (top), genotype (bottom left), age (bottom middle), and pseudotime (bottom right). d, Heat map of genes (rows) and dot plots for GO terms associated with each cluster of microglia shown in c. Key genes are highlighted. Dot plots show selected and enriched GO terms of the respective cluster. Colours in the heat map correspond to normalized scaled expression. Dot colour reflects the adjusted P value from a hypergeometric over-representation test with Benjamini–Hochberg correction applied for multiple comparisons. e, Volcano plots show the differentially expressed genes (DEGs) between the indicated microglial clusters shown in c. MAST test was used for statistical testing. FC, fold change; NS, not significant. f, Heat maps showing the levels (log2(FC)) of lysosome (left) and autophagy (right) pathway-related genes, comparing the clusters shown in c. g, Feature plots depicting most significant DEGs in disease clusters.
Fig. 4
Fig. 4. Absence of Hexb results in characteristic temporospatial GM2 accumulation, which induces microglial production of proinflammatory cytokines through MGL2.
a, Volcano plot indicating the differentially regulated lipids between Hexb−/− (n = 6) and Hexb+/− (n = 3) mice measured by untargeted lipidomics (liquid chromatography–mass spectrometry) at P120. Two-tailed Welch’s t-test was used for statistical testing. b, Spatial MALDI MSI on Hexb−/− and Hexb+/− brains at P0 (upper row), P7 (middle row) and P120 (bottom row). For each indicated ganglioside, ion images representative for three biological replicates are shown. Colour scale represents a visual map of the intensities (in arbitrary units) of the ion images. c, MALDI MSI on the thalamus of Hexb−/− and Hexb+/− mice at P120. For each indicated ganglioside, ion images representative for three biological replicates are shown. Colour scale represents a visual map of the intensities (in arbitrary units) of the ion images. Triangles points to the centromedian and the parafascicular nucleus. d, Hierarchical clustering of selected gangliosides in the indicated CNS specimen. Colour scale indicates the Z-score. e, Experimental scheme. fh, Left, absolute cytokine and chemokine levels in the supernatant after culturing primary microglia upon overnight ganglioside stimulation. Data are shown as mean ± s.e.m. from four independent replicates. Two-way ANOVA followed by Sidak’s multiple comparison test was used for statistical testing. Right, log2[FC] values (colour scale) are shown relative to the unstimulated condition within each genotype. Statistical significance was assessed using one-way ANOVA with Dunnett’s correction. –log10[P] is encoded in colour intensity (heat map), and cells marked with # indicate P < 0.05. fh, A comparison of Hexb−/− and Hexb+/+ microglia (f), the effect of MGL blockade (g) (MGL antibody versus isotype control (ctrl)) and responses to different gangliosides (h) (GM1, GM2, GM3). Scale bars, 9 mm (b), 2 mm (c). Illustrations in e were created using BioRender. Frosch, M. (2025) https://BioRender.com/kdrwxwm. Source data
Fig. 5
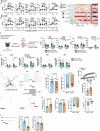
Fig. 5. Joint microglial secretion and neuronal uptake of Hex sustains CNS homeostasis and prevents Sandhoff disease.
a,b, Kaplan–Meier survival curves (a) and rotarod performance (b) of Hexbfl/fl (n = 15), Cx3cr1cre/+:Hexbfl/fl (n = 15), Nescre/+:Hexbfl/fl (n = 15) and Cx3cr1cre/+:Nescre/+:Hexbfl/fl (n = 14). c, Hex activity in whole-brain homogenates at indicated times (n = 4). a.u., arbitrary units. d,e, Activity in microglia (d) and neurons (e): Hexbfl/fl (n = 4), Cx3cr1cre/+:Hexbfl/fl (n = 5/6), Nescre/+:Hexbfl/fl (n = 6), Cx3cr1cre/+:Nescre/+:Hexbfl/fl (n = 4), Hexb−/− (n = 4). f, Quantification of HEXB+ cortical neurons: Hexbfl/fl (n = 4), Cx3cr1cre/+:Hexbfl/fl (n = 4), Nescre/+:Hexbfl/fl (n = 4) and Cx3cr1cre/+:Nescre/+:Hexbfl/fl (n = 3). g, IBA1+ microglia in the thalamus at P245: Hexbfl/fl (n = 4), Cx3cr1cre/+:Hexbfl/fl (n = 5), Nescre/+:Hexbfl/fl (n = 4) and Cx3cr1cre/+:Nescre/+:Hexbfl/fl (n = 4). h, Hex activity in primary wild-type microglial supernatants after 4 h (n = 4). i, The same, after golgicide A pretreatment: 0 µM: n = 12; 1 µM: n = 6; 3.5 µM: n = 3; 5 µM: n = 6; 10 µM: n = 9. j, Experimental scheme. k, Activity in Hexb−/− NPCs treated with conditioned media (CM), heat-inactivated CM (hiCM), unconditioned media (non-CM) or CM-only wells (n = 4 each). l, Immunocytochemistry of Hexb+/− NPCs (TuJ1+) shows lysosomal (LAMP1+) localization of His-tagged Hex. m, GM2 levels in CM-treated NPCs (n = 4). n, Activity in Hexb−/− NPCs co-treated with His-tagged Hex and endocytosis inhibitors. Recombinant HEXB (rHEXB) only: n = 38; EIPA: n = 9; Wortmannin: n = 16; M6P: n = 20; EIPA + M6P: n = 11; untreated: n = 8. Data are shown as mean ± s.e.m. Statistical analyses: log-rank test (a); one-way ANOVA with Tukey’s post hoc test (b,di,k,m,n); two-way ANOVA with Dunnett’s test (c); each symbol in h, i, k, m and n represents a technical replicate. Scale bars, 20 µm (g), 10 µm (l, top panels), 2.5 µm (l, bottom panels). Illustrations in j were created using BioRender. Frosch, M. (2025) https://BioRender.com/cedrdxp. Source data
Fig. 6
Fig. 6. Expression of Hexb by bone-marrow-derived MLCs rescues lethal CNS phenotype and restores brain homeostasis.
a, Representative immunofluorescence images at P245 showing IBA1 (red), GFP and DAPI (4,6-diamidino-2-phenylindole; blue). Triangles indicate IBA1+GFP+-replaced microglia. b–e, Microglia GFP expression by flow cytometry (b), Kaplan–Meier survival analysis (c), rotarod performance (d) and body weight monitoring (e). BLZ + Het → KO (dark green, n = 12), BLZ + Het → Het (blue, n = 10), BLZ + KO → KO (red, n = 7), vehicle + Het → KO (grey, n = 10) and KO (orange, n = 7) were analysed. Het, Hexb+/−; KO, knockout, Hexb−/−; Tx, transplantation. f, Correlation between motor function and microglia replacement efficiency. Spearman’s r and two-tailed t-test P values are indicated. g, Bar graphs depicting GM2 ganglioside deposition in brain homogenates at P120 (n = 6 per group). h, Volcano plots of differentially regulated lipids at P120 (n = 6 per group). i, Hex activity in whole-brain homogenates (n = 4 per group) measured at indicated times. j, Hex activity in neurons at P120 (BLZ + Het → KO (n = 5), BLZ + KO → KO (n = 4), BLZ + Het → Het (n = 3), vehicle + Het → KO (n = 4) and KO (n = 3)). k, Left, HEXB immunohistochemistry in the cortex at P120. Arrowheads mark neuronal (black) and microglial (green) HEXB+ cells. Right, quantification of HEXB+ neurons (BLZ + Het → KO (n = 5), BLZ + KO → KO (n = 4), BLZ + Het → Het (n = 3) and vehicle + Het → KO (n = 4)). l, Relative Hexb gene expression and Hex activity in microglia from wild-type mice, Cx3cr1GFP/+ mice and microglia-replaced mice, separated by GFP status. Data are shown as mean ± s.e.m. Statistical analyses: one-way ANOVA with Tukey’s post hoc test (b,d,e,h,jl); log-rank test (c); two-tailed Welch’s t-test (g); two-way ANOVA with Tukey’s post hoc test (i). Scale bars, 500 µm (a, top panels), 25 µm (a, bottom panels, k). Source data
Fig. 7
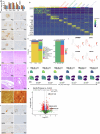
Fig. 7. Microglial phenotypes from patients with Sandhoff disease mirror the disease hallmarks observed in Hexb−/− mice.
a, Typical immunohistochemical images of thalamic brain sections showing IBA1+ (brown) microglia of one postmortem patient with Sandhoff disease. Representative haematoxylin and eosin combined with luxol fast blue (H&E-LFB) stain shows lipid accumulations in thalamic neurons (black arrowheads) and microglial cells (green arrowheads). APP immunohistochemistry displays extracellular deposits in the Sandhoff disease-affected thalamus. Bielschowsky (Biel) stain highlights swollen axons (arrowheads). Orange colour indicates patient with Sandhoff disease, blue unaffected controls. b, UMAP visualization of 14,657 individual nuclei from the thalamus of two patients with Sandhoff disease and unaffected controls captured by snRNA-seq. c, UMAP visualization of the immune cell subset (without T cells). d, Heat map of genes (rows) and dot plots for GO terms associated with each cluster of microglia shown in c. Key genes are highlighted. Colours in the heat map correspond to normalized scaled expression. Dot colour indicates adjusted P values from over-representation tests with Benjamini–Hochberg correction. e, Volcano plots show the DEGs between the indicated microglial clusters. MAST test was used for statistical testing. f, Scatter plot depicting the DEGs in mouse and man with selected genes highlighted. Axes indicate expression changes in mouse (x) and human (y); genes with adjusted P < 0.05 are shown. g, MALDI MSI on cortex and thalamus of a patient with Sandhoff disease and control shows spatial distribution of gangliosides. Ion images reflect signal intensities (arbitrary units). Scale bars, 20 µm (a, IBA1 panels), 50 µm (a, other panels), 9 mm (g). Illustrations in f were created using BioRender. Frosch, M. (2025) https://BioRender.com/4a40uoi.
Extended Data Fig. 1
Extended Data Fig. 1. Hexb expression in the mouse brain is highly microglia-restricted throughout brain regions and development.
A) Representative immunofluorescence images of P56 HexbtdT/tdT mice showing no tdT positivity in CD206+ perivascular and leptomeningeal macrophages (green), SOX9+ astrocytes (green) or OLIG2+ oligodendrocytes (green) in the cortex. Triangles point to tdT+ microglia. pvMΦ: perivascular macrophage, mMΦ: leptomeningeal macrophage. B) Typical immunofluorescence images of tdT+ microglia (IBA1+P2RY12+) in different brain regions at 56 days of age. C) Immunofluorescence images of tdT+ cortical microglia (IBA1+, green) at different ages (embyronic (E) day 14.5, postnatal (P) days 1 and 56. D) Expression of tdT by microglia in HexbtdT/tdT mice measured by flow cytometry. Histograms show the expression levels of tdT at different ages. Hexb+/+ mice are used as controls. Each histogram displays all individual data derived from the indicated number of mice. E) Immunofluorescence images of P56 HexbtdT/tdT:Cx3cr1GFP/+ mice showing tdT and GFP overlap in IBA1+ microglia but not CD206+ perivascular or meningeal macrophages. Triangles point to tdT+ microglia or tdT CAMs. F) Immunofluorescence images of P56 HexbtdT/tdT:Thy1GFP/+ mice showing tdT expression only in IBA1+ microglia but not GFP+ neurons.
Extended Data Fig. 2
Extended Data Fig. 2. Hexb deficiency leads to microglial activation, astrogliosis, and axonal damage throughout the mouse brain with regional differences.
A) Development of body weight over disease course (left) and strength in the Grip Strength Test (right) for Hexb−/− (n = 15), Hexb+/− (n = 15), and Hexb+/+ (n = 15) controls. B) Measurement of blood marker for liver and kidney damage in Hexb+/− and Hexb−/− mice. One symbol indicates one biological replicate. C) TNF and IL-6 levels in the blood of Hexb+/− and Hexb−/− mice measured by ELISA. Paired t-test comparison was used for statistical testing. D) Quantification of APP (axonal damage), GFAP (astrocytosis), IBA1 (microgliosis), and Mac-3 (lysosomal microglia activation) in different brain regions (cortex, cerebellum grey and white matter, hippocampus, thalamus, and pons/medulla) at different time points (P0, P7, P28, P56, P85, P120) for Hexb−/− (n = 4) and Hexb+/− (n = 4) controls. E) Representative immunohistochemical image of IBA1/Mac-3 double-positive cells in the thalamus of P120 Hexb−/− mice. F) Representative immunofluorescence images indicating lysosomal activation in P7 Hexb−/− (orange) and Hexb+/− (blue) microglia. G) Left: Representative immunohistochemical images of P2RY12+ and TMEM119+ cells in the thalamus at P120Right: Quantification Each dot represents one individual mouse. Th: thalamus, Cwm: Cerebellum – white matter, P/M: pons/medulla, Cgm: Cerebellum – grey matter, Ctx: cortex, H: hippocampus. Data shown as mean ± s.e.m. Statistical analyses: Two-tailed Student’s t-test was used for statistical testing (B-C); Two-way ANOVA followed by Sidak’s multiple comparison test was used for statistical testing (D,G). Source data
Extended Data Fig. 3
Extended Data Fig. 3. snRNA-seq reveals CNS cell-type composition and microglial heterogeneity across disease states.
A) Selected marker genes associated with each cell type highlighted in Fig. 3a. B) Typical marker genes associated with each immune cell type highlighted in Fig. 3b. C) Dotplot depicting common microglial homeostatic and disease-associated genes among clusters shown in Fig. 3c. D) Heat map featuring the top cell-type-specific marker genes across the major cell types. The color bar indicates gene expression. E) Marimekko plot depicting the different cell type compositions separated by age or genotype. F) UMAP and Marimekko chart of microglia and CAMs depicting the proportions of Hexb−/− and Hexb+/− microglia for each cluster. G) UMAP visualization of microglia cluster from different conditions shown in Fig. 1a. Here, microglia from P120 Hexb−/− microglia are integrated. H) Marimekko plot depicting the cluster proportions for the indicated conditions. I) Heat map featuring the top cluster marker genes. Shared Hexb−/− disease genes are highlighted. J) UMAP visualization of microglia shown in g. Color code indicates their belonging to the homeostatic or disease condition. K) UMAP visualization of microglia shown in g. Color code indicates the respective condition.
Extended Data Fig. 4
Extended Data Fig. 4. Analysis of ganglioside storage in a temporospatial manner.
A) Bar graphs depicting dysregulated ganglioside deposition in brain homogenates of Hexb−/− (n = 6) and Hexb+/− mice (n = 3) at 120 days of age measured by untargeted lipidomics (LC-MS). B) Spatial MALDI mass spectrometry imaging (MALDI-MSI) on Hexb−/− and Hexb+/− brains at P0 (upper row), P7 (mid row), and P120 (bottom row). For each indicated ganglioside, ion images representative for three biological replicates are shown. Color scale represents a visual map of the intensities (in arbitrary units) of the ion images. C) Heatmap showing all differentially regulated and annotated lipids in the brain of P0, P7, and P120 Hexb−/− (n = 3) and Hexb+/+ (n = 3) control mice. Color scale indicates the z-score. D) MALDI MSI on the thalamus of Hexb−/− and Hexb+/− mice at P120. For each indicated ganglioside, ion images representative for three biological replicates are shown. Color scale represents a visual map of the intensities (in arbitrary units) of the ion images. E) Representative immunofluorescence images of GM2 storage in neurons and microglia in Hexb−/− mice. Triangles point to GM2+IBA1+ microglia or GM2+NeuN+ neurons. F) Representative immunofluorescence images of GM2 storage (green) in lysosomes (LAMP1+, yellow) in microglia (IBA1+, red, top panel) or neurons (NeuN+, red, bottom panel), respectively. Orange color indicates Hexb−/− mice and blue color Hexb+/− mice. G) Quantification of lysosomal GM2, shown as the integrated fluorescence intensity of GM2 signal within LAMP1+ lysosomal areas, normalized to the cell area defined by IBA1+ (microglia) and NeuN+ (neurons) signals, respectively. Each symbol indicates one mouse. Data shown as mean ± s.e.m. Statistical analyses: Unpaired Student’s t-test comparisons were used for statistical testing (A); two-way ANOVA followed by Tukey’s test for correcting multiple comparisons was used for statistical testing (G). Source data
Extended Data Fig. 5
Extended Data Fig. 5. In vitro and in vivo microglial responses to gangliosides and cortical dysfunction in Hexb-deficient mice.
A-B) Cytokines and chemokine concentrations in supernatants from primary wildtype microglia cultured with the indicated amount of GM2, with/without EGTA or GalNAc. Data from 4 technical replicates. C) Fold changes of indicated cytokines normalized to the unstimulated condition (based on A and B) D) Schematic of in vivo experimental design. E-F) Cytokines/chemokine levels in brain lysates following ICV antibody injections. G) Quantitative PCR analysis of indicated target genes. H) Experimental setup. I) Representative traces (top) and current-clamp recording protocol (bottom). Note fewer action potentials (APs) and absence of voltage sag (arrow) in Hexb−/− compared to Hexb+/− mice. J) No difference in basic neuronal attributes between the genotypes (Hexb+/−: 4 animals, 11 neurons; Hexb−/−:4 animals, 11 neurons). K) Hexb−/− mice display reduced AP firing in response to depolarizing current injections across the entire range tested (left), along with an increase in rheobase, the amount of current required to elicit an AP (right, Hexb+/−-: 4 animals, 11 neurons; Hexb−/−: 4 animals, 11 neurons). L) Representative traces of individual APs. M) Hexb−/− mice show increased AP halfwidth, whereas AP amplitude and threshold are similar between the genotypes (Hexb+/−: 4 animals, 10 neurons; Hexb−/−:4 animals, 10/8/8 neurons respectively) N) Voltage sag during hyperpolarization (arrow in panel b) is reduced in Hexb−/− mice (Hexb+/−: 4 animals, 11 neurons; Hexb−/−:4 animals, 11 neurons). O) Voltage-clamp recordings of spontaneous excitatory postsynaptic currents (sEPSCs) show. robust reduction of sEPSC frequency in Hexb−/− mice. sEPSC amplitude is similar in both genotypes (right, Hexb+/−-: 4 animals, 9 neurons; Hexb−/−:4 animals, 8 neurons). Data shown as mean ± s.e.m. Statistical analyses: Two-way ANOVA followed by Sidak’s multiple comparison test (A-B,E-G); One-way ANOVA followed by Dunnett’s test (C); two-tailed Student’s t-test (I-K, M-O); two tailed Mann-Whitney (K). For I-O, dots correspond to individual neurons. Illustrations in d and h were created using BioRender (https://biorender.com). Source data
Extended Data Fig. 6
Extended Data Fig. 6. Microglial and neuronal Hexb jointly drive Sandhoff disease pathogenesis.
A) Schematic overview of genetic targeting. Hexbfl/fl were obtained by crossing the B6.Hexbtm1a(EUCOMM)Hmgu/H line with a FLP deleter. Newly generated Hexbfl/fl mice with LoxP sites (black triangles) around exon 2 were crossed to Cx3cr1Cre/+ and NesCre/+ mice. B) B)-C) Relative Hexb gene expression in FACS-sorted microglia (B) and bead-purified neurons (C) among different genotypes measured by qPCR. D) Relative Syt1 (neuronal marker gene), Gfap (astocytic marker gene), Itgam (microglia marker gene), and Plp1 (oligondendroglial marker gene) gene expression in bead-purified neurons among different genotypes measured by qPCR. E-F) Development of bodyweight (E) and muscle strength (F) for Hexbfl/fl (n = 15), Cx3cr1Cre/+:Hexbfl/fl (n = 15), NesCre/+:Hexbfl/fl (n = 15), and Cx3cr1Cre/+:NesCre/+:Hexbfl/fl (n = 14) mice. G) Representative immunohistochemical images of brain sections from the indicated genotypes. Top row: Microglia immunostained for P2RY12 (red), HEXB (brown), and counterstained with hematoxylin (Htx, blue). Bottom row: Neurons stained for NeuN (red), HEXB (brown), and Htx (blue). Insets show higher magnification views with yellow lines indicating the paths used for intensity profile quantification below. Triangles highlight intracellular HEXB-double positive structures. Graphs display greyscale intensity profiles of the deconvoluted staining signals along the yellow lines (red = P2RY12 or NeuN, brown = HEXB, blue = Htx). Data shown as mean ± s.e.m. Statistical analyses: one-way ANOVA with Tukey’s post hoc test (E-F). Illustrations in a were created using BioRender (https://biorender.com). Source data
Extended Data Fig. 7
Extended Data Fig. 7. Microglial Hex secretion and uptake by other cell types.
A) Experimental scheme of microglia culture and Hex activity measurement in cell culture supernatants. B) Immunoblot of culture supernatant and exosome isolates for TSG101 (exosomal marker). C) Diagram of major protein secretion pathways and their molecular inhibitors. ER: endoplasmic reticulum, EGTA: ethylene glycol-bis(β-aminoethyl ether)-N,N,N’,N’-tetraacetic acid, MVB: multivesicular body. D) D)-F) Hex activity in microglial supernatants treated with indicated concentrations of Brefeldin A (D), Vacuolin-1 and/or Ionomycin (E), or EGTA, Thapsigargin, and BAPTA-AM (F). G) Enzyme activity in conditioned media (CM), heat-inactivated CM (hiCM), and unconditioned media (non-CM). H) Hex activity in lysates of Hexb+/− NPCs treated with CM, hiCM, non-CM, or CM added to wells without cells (“no cells”) for 24 h. I) Top: Experimental setup using transwell inserts. Bottom: Ηεξ activity in lysates of Hexb−/− and Hexb+/− NPCs after co-culture with Hexb+/+ microglia ± Brefeldin A (BFA) J) Immunoblots of NPC lysates after 6 h treatment with recombinant Hex-His. K) GM2 levels in NPC lysates after CM treatment. L) Experimental scheme for primary Hexb−/− fibroblast culture. M) Immunoblots of fibroblast lysates after 6 h treatment with recombinant Hex-His. N-O) Enzyme activity in fibroblast lysates ± recombinant enzyme and following pretreatment with mannose-6-phosphate (M6P), M6P receptor (M6PR) antibody, wortmannin, or EIPA. P) Immunocytochemistry if His-tagged enzyme in Hexb−/− fibroblasts (vimentin+, His+). Triangles point to intracellular His+ inclusions. Q) Schematic of chimeric organotypic hippocampal slice cultures (OHSCs). R) Hex activity in OHSC supernatants, exosomes, and exosome-depleted fractions from Hexb+/− and Hexb−/− slices ± clodronate treatment and microglia transplantation. S) Correlation of enzyme activity with microglia density. (Spearman r, p values from two-tailed t-test). T) Immunohistochemistry for NeuN (red) and HEXB (brown) counterstained with hematoxylin (Htx) in microglia-transplanted Hexb−/− slices at d17. Graphs display greyscale intensity profiles. U) Immunohistochemistry and quantification of IBA1+ microglia in OHSCs at d17. Data shown as mean ± s.e.m. Statistical analyses: one-way ANOVA with Tukey’s post hoc test (D-I,K,O); two-way ANOVA with Sidak’s test (O,R). Illustrations in a, c, i, l and q were created using BioRender (https://biorender.com). Source data
Extended Data Fig. 8
Extended Data Fig. 8. Microglial Hexb expression ensures CNS homeostasis.
A) Experimental scheme for microglia replacement. WBI: whole body irradiation. BMT: bone marrow transplantation. B-C) Quantification and immunohistochemistry of cortical IBA1+ cells in BLZ945- and vehicle-treated Hexb+/− and Hexb−/− mice (n = 3 per group). D) FACS analysis of GFP+ Ly6Clo blood monocytes in the transplanted and microglia replaced mice measured by FACS. E) Quantification of %GFP+IBA1+ parenchymal cells in the cortex and thalamus (replacement efficiency) from Fig. 6a. F) Grip strength assessment in transplanted mice. G) Ganglioside levels in brain homogenates of transplanted Hexb−/− (n = 6) and Hexb+/− animals, and untreated Hexb−/− controls (n = 6). H-I) Bar graph highlighting the amount of GFP+Ly6Clo blood monocytes related to Fig. 6l (H) and of neonatally transplanted and microglia replaced mice (I). J) Flow cytometry of GFP expression in microglia of neonatally transplanted mice. K-L) Kaplan–Meier survival curve (K) and rotarod performance (L) of neonatally transplanted mice. BLZ + Het → KO (n = 12), BLZ + Het → Het (n = 10), and neonatally BLZ + Het → KO (n = 4). M-O) UMAP of 44,957 individual nuclei from the thalamus of transplanted and untransplanted Hexb−/− and Hexb+/− mice captured by snRNA-seq. P-Q) Marker genes identifying cell types and immune populations. R) Dotplot of homeostatic and disease-associated microglial genes by clusters. S) Heat map of key cluster-specific microglial genes. T) Volcano plot depicting DEGs between c0 and c1 in transplanted Hexb−/−mice. U) Marimekko chart of microglia depicting the proportions of transplanted and untransplanted Hexb−/− and Hexb+/− microglia for each cluster. V) Violin plot highlighting the expression of core microglial genes in transplanted and untransplanted Hexb−/− and Hexb+/− microglia (c1). Data shown as mean ± s.e.m. Statistical analyses: two-way ANOVA followed by Sidak’s test (B); one-way ANOVA with Tukey’s post hoc test (E,G,L). Illustrations in a were created using BioRender (https://biorender.com). Source data
Extended Data Fig. 9
Extended Data Fig. 9. Histological, transcriptional, and lipid changes in Sandhoff disease brains.
A) Quantification of IBA1+ microglia in postmortem brain tissue of Sandhoff disease patients and unaffected controls. Orange indicates Sandhoff disease, blue unaffected controls. Th: thalamus, Cwm: Cerebellum – white matter, Cgm: Cerebellum – grey matter, Ctx: cortex, WM: subcortical white matter. Each bar represents one patient. B) Immuohistochemistry for phagocytic and lysosomal markers: KIM1P, p22phox, lysozyme, and LAMP2. C) H&E staining thalamic sections of Sandhoff disease patients and healthy controls. D) H&E stains depicting cellular ganglioside deposition and an enlarged hypercellular perivascular space. E) Bielschowsky (Biel) stain highlighting the axonal network. F) Immunostaining for axonal- and neurofilament-associated proteins: SMI31 (phosphorylated neurofilaments), SMI35 (non-phosphorylated neurofilaments), and SMI312 (pan-axonalhighly phosphorlylated neurofilaments marker). Note the abnormal accumulation of SMI31 in perikarya of degenerationg neurons with ganglioside accumulation as well as axonal swellings. G) Heat map featuring the top cell-type-specific marker genes across the different cell types. H) Marimekko charts depicting the proportions of each cell type or cluster separated by disease condition. I) Feature Plots depicting cluster defining genes. J) MALDI MSI of cortex and thalamus from Sandhoff disease patients and unaffected controls. Ion images show spatial distribution of gangliosides; color scale indicates intensity (arbitrary units). K) Volcano plot indicating the differentially regulated lipids between Sandhoff disease patients and unaffected controls measured by untargeted lipidomics (liquid chromatography mass spectrometry (LC-MS)). Two-tailed Welch’s t-test was used for statistical testing. Source data
Extended Data Fig. 10
Extended Data Fig. 10. Graphical abstract of experimental findings.
Left panel (Homeostasis): In the healthy brain, microglia expressing high levels of Hexb secrete functional Hex, which is taken up by neurons and delivered to their lysosomes. Middle panel (Sandhoff disease/model): In the absence of Hexb, both microglia and neurons accumulate GM2 ganglioside in their lysosomes. Neuronal cell death leads to extracellular GM2 release, which is sensed by microglia via the receptor MGL2, recognizing terminal GalNAc residues. This triggers a pro-inflammatory response, including the upregulation and secretion of TNF, IL-6, CCL3, CCL4, and CCL17. Right panel (Microglia replacement therapy): Transplantation of wild-type microglia into Hexb-deficient brains restores enzymatic function in neurons via microglial enzyme supply. The replaced microglia secrete functional Hex, thereby reducing neuronal and CNS-wide GM2 accumulation and promoting restoration of CNS homeostasis. Illustrations created using BioRender (https://biorender.com).

References

    1. Prinz, M., Masuda, T., Wheeler, M. A. & Quintana, F. J. Microglia and central nervous system-associated macrophages—from origin to disease modulation. Annu. Rev. Immunol.39, 251–277 (2021). - PMC - PubMed
    1. Prinz, M., Jung, S. & Priller, J. Microglia biology: one century of evolving concepts. Cell179, 292–311 (2019). - PubMed
    1. Sango, K. et al. Mice lacking both subunits of lysosomal β–hexosaminidase display gangliosidosis and mucopolysaccharidosis. Nat. Genet.14, 348–352 (1996). - PubMed
    1. Kierdorf, K., Masuda, T., Jordão, M. J. C. & Prinz, M. Macrophages at CNS interfaces: ontogeny and function in health and disease. Nat. Rev. Neurosci.20, 547–562 (2019). - PubMed
    1. Mrdjen, D. et al. High-dimensional single-cell mapping of central nervous system immune cells reveals distinct myeloid subsets in health, aging, and disease. Immunity48, 380–395 (2018). - PubMed

MeSH terms

LinkOut - more resources