

Water Resource Recovery Facilities Meet Low-Level Mercury Limits by Controlling Effluent Suspended Solids
- PMID: 40769453
- PMCID: PMC12328045
- DOI: 10.1002/wer.70158
Water Resource Recovery Facilities Meet Low-Level Mercury Limits by Controlling Effluent Suspended Solids
Abstract
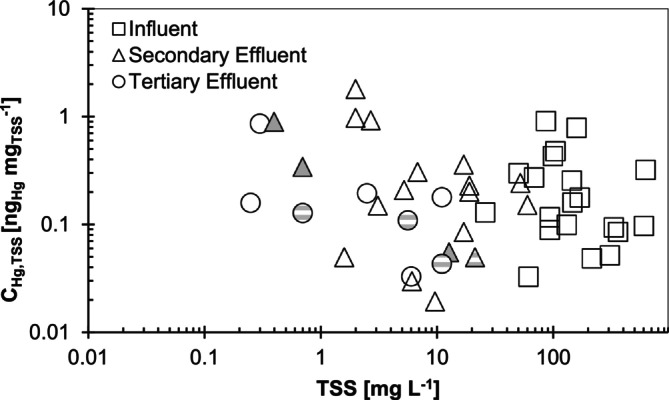
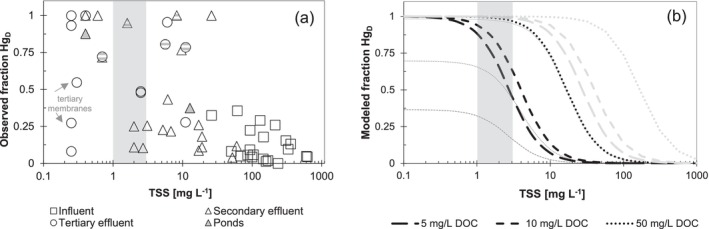
Hundreds of water resource recovery facilities (WRRFs) in North America have received low-level mercury effluent limits (< 2 ng/L). Although mercury binding to dissolved organic matter (DOM) and particulate matter in natural environments is well understood, guidance about low-level mercury removal at WRRFs is lacking. We collected samples of filter-passing and particulate mercury at 16 WRRFs with a variety of secondary and tertiary particle-control technologies. Particulate mercury in WRRF effluent was covariate with total suspended solids (TSS) at concentrations ranging from < 0.2 to 15 ng/L. Filter-passing (< 0.45 μm) mercury in WRRF effluent was mostly bound to DOM and was typically between 0.3 and 0.8 ng/L. Thermodynamic modeling and sulfur quantities in wastewater TSS and DOM point to a consistent quantity of filter-passing Hg that cannot be removed by typical wastewater technologies and necessitates effective particulate removal to meet low-level mercury limits.
Keywords: TSS removal; dissolved organic matter; low‐level limits; mercury; metals; municipal wastewater; particulate matter control; tertiary filtration.
© 2025 The Author(s). Water Environment Research published by Wiley Periodicals LLC on behalf of Water Environment Federation.
Conflict of interest statement
The statements, findings, conclusions, and recommendations are those of the authors and do not necessarily reflect the views of the Minnesota Pollution Control Agency.
The authors declare no conflicts of interest.
Figures


References
-
- Azevedo, L. , Pestana I., Rocha A., et al. 2018. “Drought Promotes Increases in Total Mercury and Methylmercury Concentrations in Fish From the Lower Paraíba do Sul River, Southeastern Brazil.” Chemosphere 202: 483–490. - PubMed
-
- Balogh, S. , and Liang L.. 1995. “Mercury Pathways in Municipal Wastewater Treatment Plants.” Water, Air, and Soil Pollution 80: 1181–1190.
-
- Bawiec, A. , and Pawęska K.. 2020. “Changes in the Granulometric Composition of Particles in Wastewater Flowing Through a Hydroponic Lagoon Used as the Third Stage in a Wastewater Treatment Plant.” Water Science and Technology 81: 1863–1869. - PubMed
-
- Beutel, M. W. , Dent S. R., Newcombe R. L., and Möller G.. 2019. “Mercury Removal From Municipal Secondary Effluent With Hydrous Ferric Oxide Reactive Filtration.” Water Environment Research 91: 132–143. - PubMed
-
- Bodaly, R. , Rudd W., and Flett R. J.. 1998. “Effect of Urban Sewage Treatment on Total and Methyl Mercury Concentrations in Effluents.” Biogeochemistry 40: 279–291.
MeSH terms
Substances
Grants and funding
LinkOut - more resources
Full Text Sources
Medical
Research Materials
Miscellaneous
