. 2025 Aug 6:10.1101/gad.352747.125.
doi: 10.1101/gad.352747.125. Online ahead of print.

A cell type-specific surveillance complex represses cryptic promoters during differentiation in an adult stem cell lineage

Affiliations

A cell type-specific surveillance complex represses cryptic promoters during differentiation in an adult stem cell lineage

Neuza R Matias et al. Genes Dev. .

Abstract

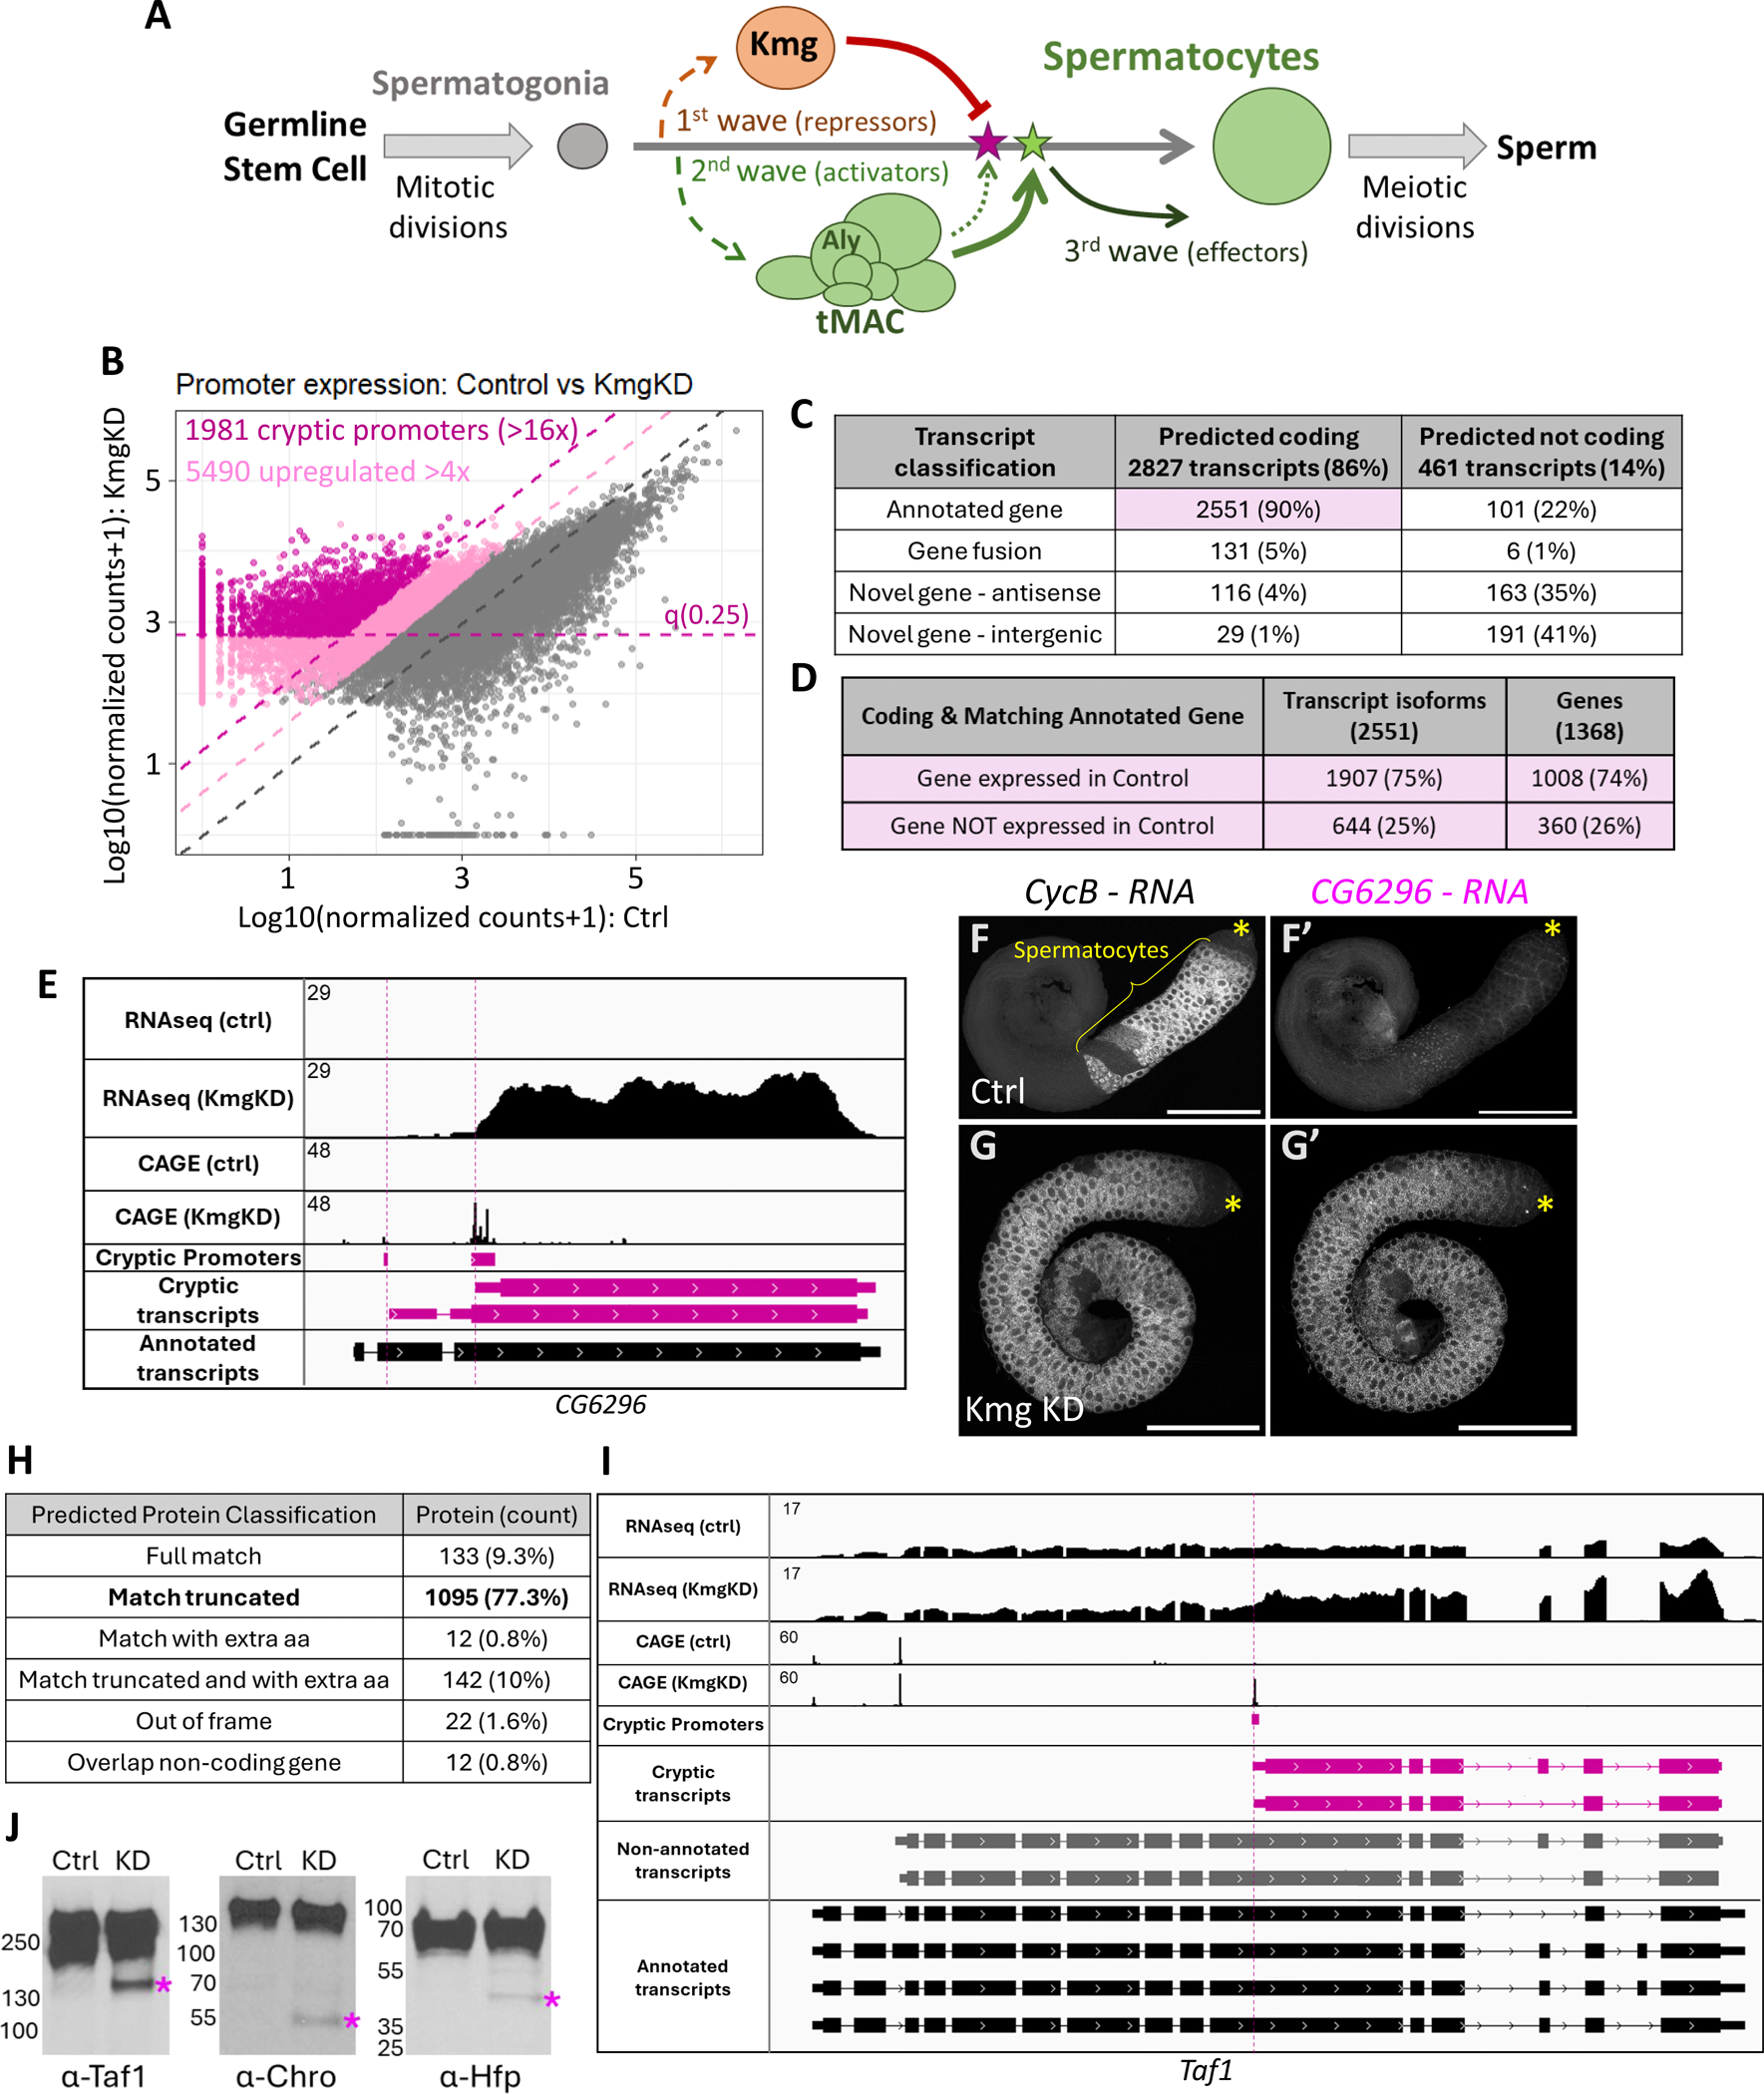
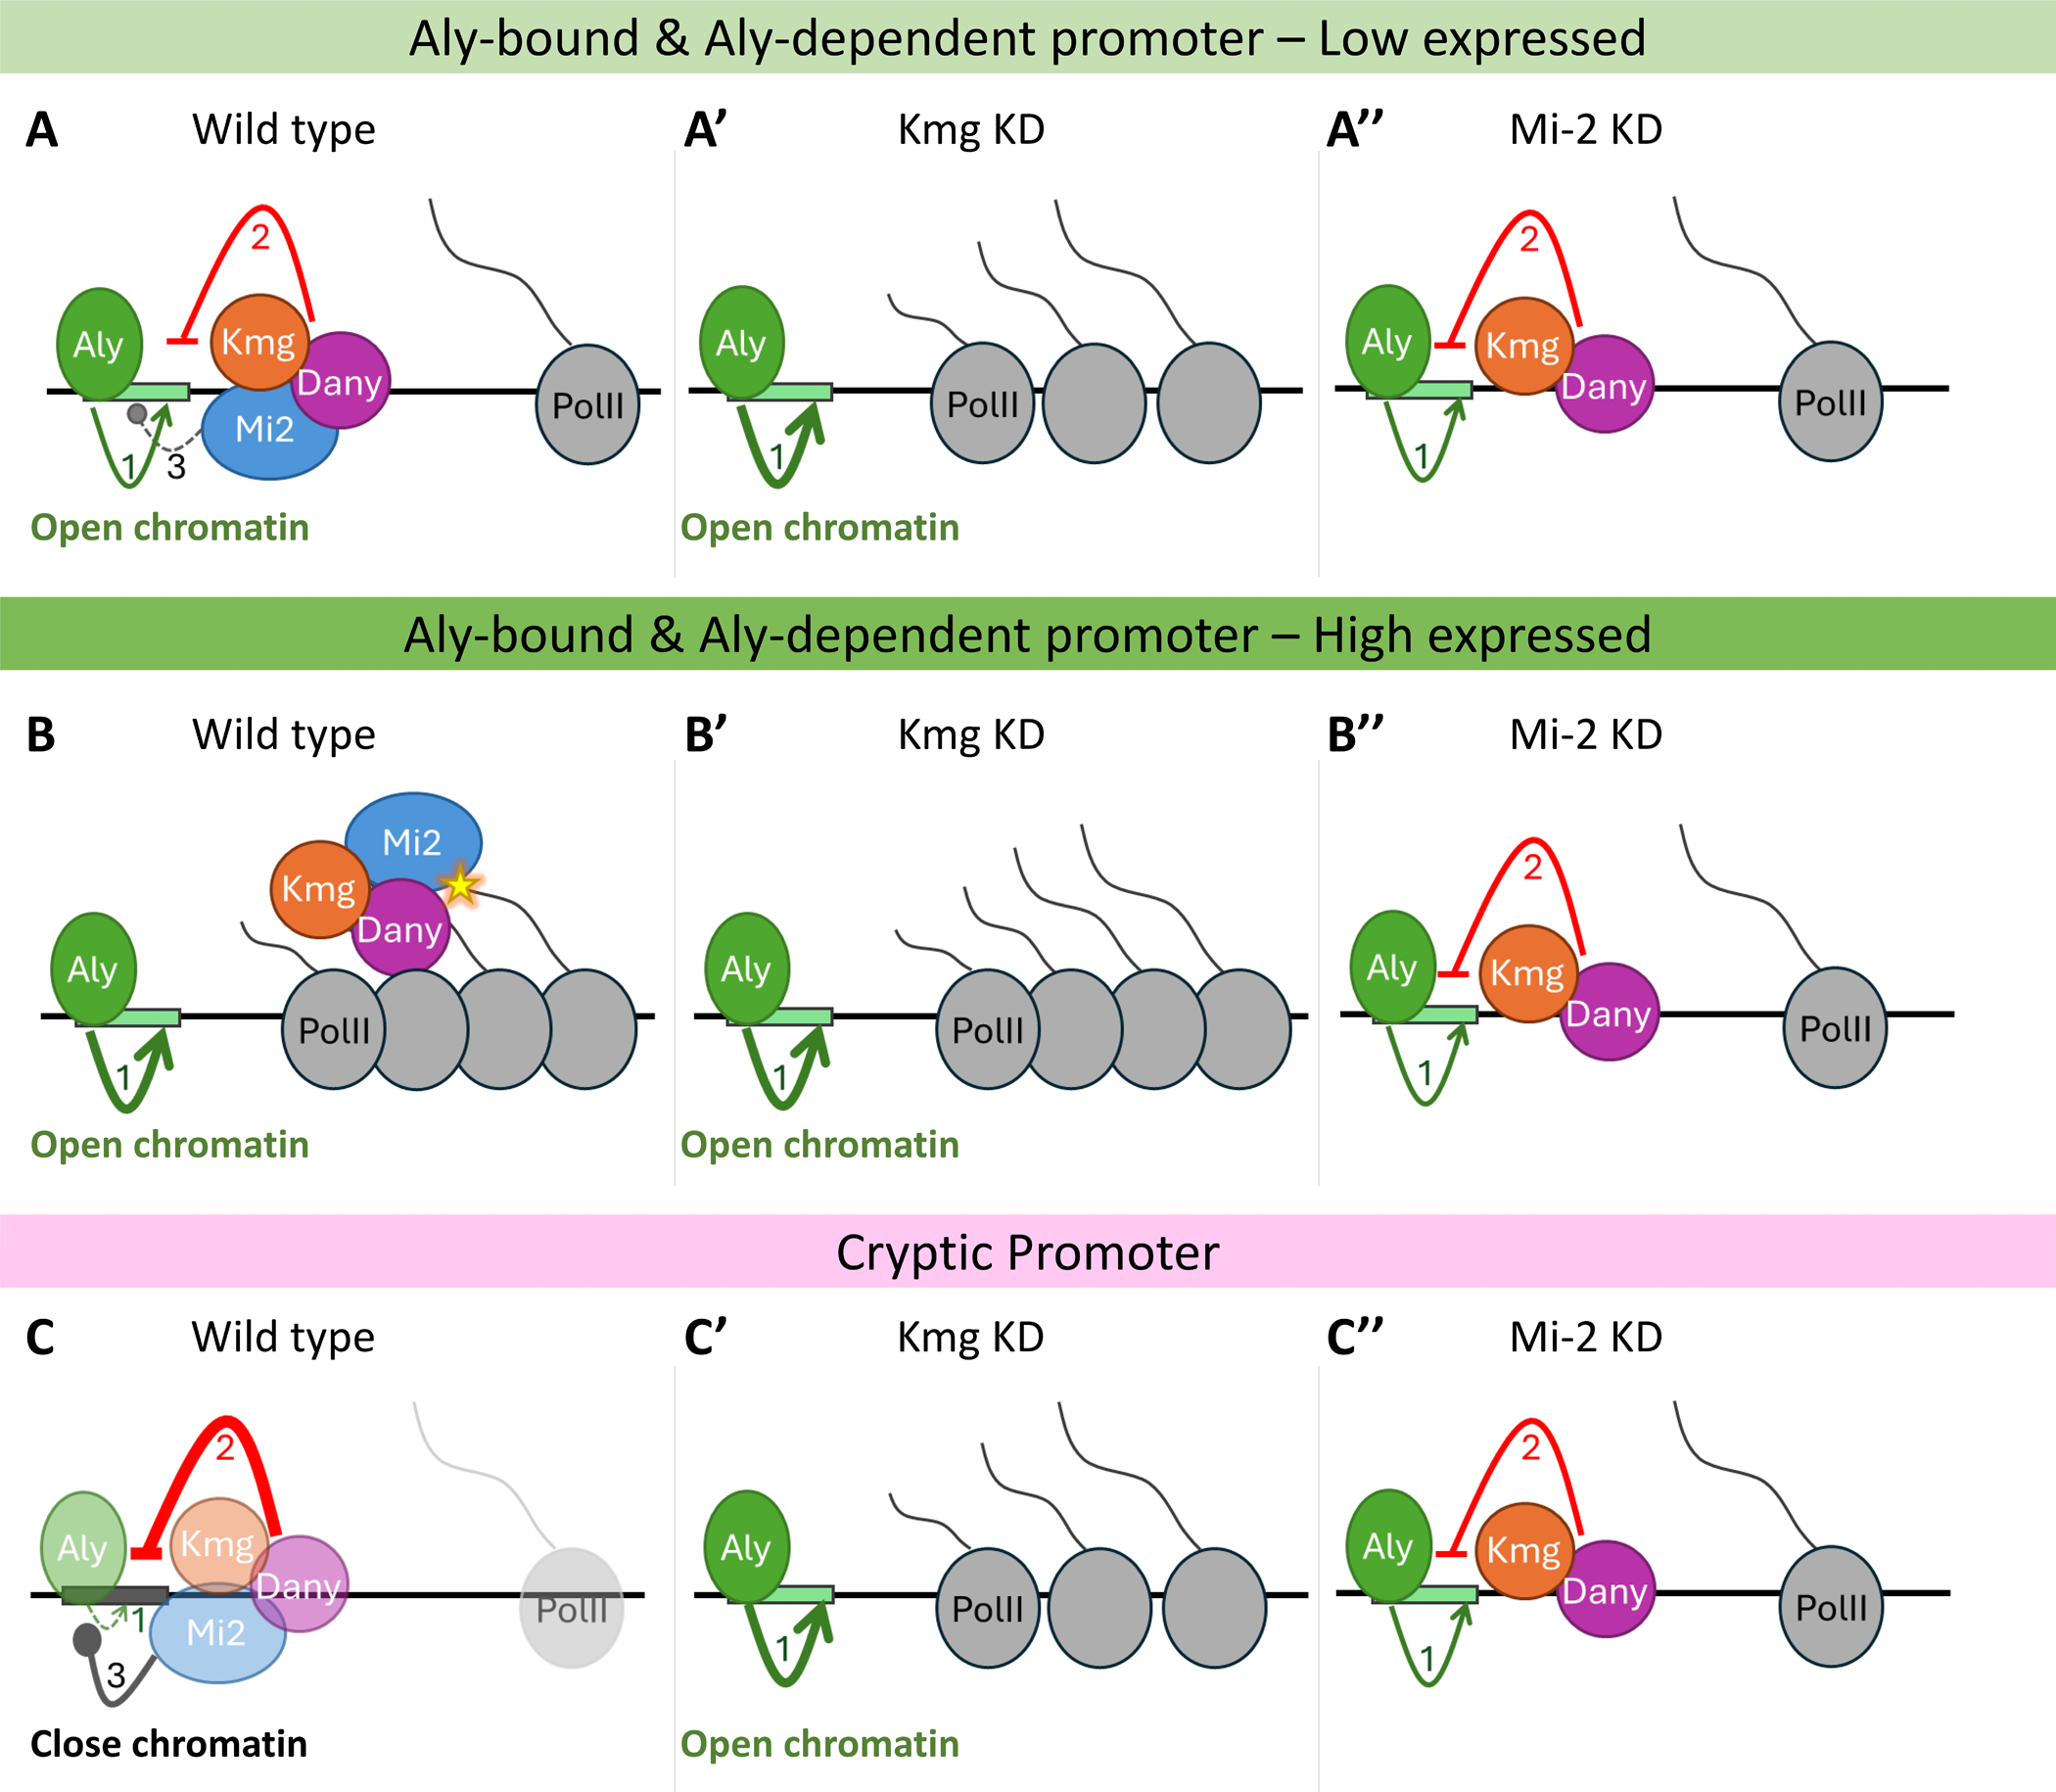
Regulators of chromatin accessibility play key roles in cell fate transitions, triggering the onset of novel transcription programs as cells differentiate. In the Drosophila male germline stem cell lineage, tMAC, a master regulator of spermatocyte differentiation that binds thousands of loci, is required for local opening of chromatin, allowing activation of spermatocyte-specific promoters. Here we show that a cell type-specific surveillance system involving the multiple zinc finger protein Kmg and the pipsqueak domain protein Dany dampens transcriptional output from weak tMAC-dependent promoters and counteracts tMAC binding at thousands of additional cryptic promoters, thus preventing massive expression of aberrant protein-coding transcripts. ChIP-seq showed Kmg enriched at the tMAC-bound promoters that it repressed, consistent with direct action. In contrast, Kmg and Dany did not repress highly expressed tMAC-dependent genes, where they colocalized with their binding partner, the chromatin remodeler Mi-2 (NuRD), along the transcribed regions rather than at the promoter. We discuss a model where Kmg, together with Dany and Mi-2, dampens expression from weak or ectopic promoters while allowing robust transcription from highly expressed Aly-dependent genes.

Keywords: Drosophila; NuRD complex; chromatin regulation; cryptic promoters; spermatogenesis; transcriptional repression.


Conflict of interest statement

Competing Interest Statement

The authors declare no competing interests.

Figures

Figure 1:
Figure 1:
Kmg represses thousands of cryptic promoters genome wide. (A) Diagram of Drosophila spermatogenesis featuring the transcriptional waves after spermatogonia differentiate into spermatocytes. (B) Expression profile for all promoters expressed in testes from control [X-axis] and Kmg knockdown (KD) [Y axis]. Axes: read counts normalized by DESeq2, with log10 transformation. Light pink: promoters expressed >4 fold in Kmg knockdown compared to control testes. Dark pink: cryptic promoters, see definition in methods session. (C) Classification of cryptic transcripts in relation to annotated transcripts, by SQANTI3. (D) Classification of cryptic transcripts that matched annotated genes and are predicted to code proteins in relation to whether the host gene is expressed higher than quantile 0.2 in control testes. (E) RNA-seq and CAGE profiles for CG6296 gene. Pink: cryptic promoters and resulting transcripts. (F-G) HCR-FISH using probes against CycB or cryptic CG6296 RNA, in control (F, F’) or Kmg knockdown (G,G’) testes. Asterisk: testis apical tip. Scale bars, 200 μm. (H) Classification of predicted cryptic proteins in relation to the most similar annotated isoform of the host gene. (I) RNA-seq and CAGE profiles for Taf1 gene. Pink: cryptic promoters and resulting transcripts. Grey: transcripts detected in control testes, but not previously annotated in Drosophila genome. (J) Western blots of control or Kmg knockdown testis lysates probed with antibodies against Taf1, Chro or Hfp. Due to similar size, the two Taf1 predicted cryptic proteins would not have been resolved.
Figure 2:
Figure 2:
Kmg interacts with Dany and Mi-2 (NuRD) to repress cryptic promoters. (A) Spectral counts by protein from immunoprecipitation of Kmg followed by Mass Spectrometry (IP-MS), from control or Kmg knockdown (KD) testes. Blue: NuRD complex components. (B) Immunofluorescence images showing apical tip of a testis expressing V5-Dany and Mi-2-GFP, stained with anti-Kmg, anti-V5, and anti-GFP. Asterisk: testis apical tip. (B, B”, B””) Scale bars: 100 μm. (B’, B”’, B””’) Scale bars: 30 μm. (C) Immunoprecipitation (IP) with anti GFP from testes expressing V5-Dany and either Mi-2-GFP (+), or not (−), followed by PAGE and Western blots probed with anti-GFP, anti-Kmg and anti-V5. Yellow arrow heads point to bands corresponding to the immunoglobulin heavy (around 50 kDa) and light (around 25 kDa) chains from anti-GFP, which was cross-linked to the IP beads. (D) Violin plot of log2 transformed fold change for the 1981 cryptic promoters in Kmg KD, Dany KD, Simj KD and Mi-2 KD, compared to control testes. Pink dot: mean value (value not log2 transformed is indicated at the bottom). Excluding 20 out of scale promoters. (E) Heatmap plot of RNA-seq signal for control, Kmg, Dany, Simj and Mi-2 knockdown testes, showing +/− 1Kb centered at the TSS of the highest expressed transcript starting at each cryptic promoter, aligned 5’ to 3’ relative to each transcript. Color intensity denotes score for coverage of normalized read counts (CPM). Loci sorted by RNA-seq signal in Kmg knockdown, highest on top. (F) RNA-seq and CAGE profiles for the Np gene. Pink: cryptic promoters and transcripts. (G-K) HCR-FISH using probes against CycB or cryptic Np RNA, in control (G,G’), Kmg (H,H’), Dany (I,I’), Simj (J,J’) and Mi-2 (K,K’) knockdown testes. Scale bars: 200 μm.
Figure 3:
Figure 3:
In absence of Kmg, cryptic promoters are enriched by Aly and depend on Aly for expression. (A) Heatmap plots of ChIP-seq for Aly-HA, ATAC-seq and CAGE in control and Kmg KD testes, showing +/− 1Kb centered at the TSS of the highest expressed transcript starting at each cryptic promoter, aligned 5’ to 3’ relative to each transcript. Color intensity denotes score for coverage of normalized read counts (CPM). Loci sorted by level of promoter expression, highest on top. (B-D) Summary plots with the mean of the coverage scores shown in (A) centered around the same regions, on profiles of (B) Aly-HA ChIP-seq (solid lines) and corresponding input (dotted lines), (C) ATAC-seq and (D) CAGE signals. (D) CAGE mean signal was smoothed by method = “gam”. (E) Bootstrapping analysis of CAGE data, with 1000x iterations. (E’) Control sample with zoomed in scale on Y axis. (F,G) Aly-HA ChIP-seq, ATAC-seq, RNA-seq and CAGE profiles for the CG10628 (F) and Kkv (G) genes. Pink: cryptic promoters and transcripts. (H) Violin plot of log2 transformed fold change compared to control, for the 1981 cryptic promoters in Kmg knockdown testes, Kmg knockdown in aly mutant testes, Kmg knockdown in sa mutant testes. Pink dot: fold change mean value (value not log2 transformed is indicated at the bottom). Excluding 14 out of scale promoters on H.
Figure 4:
Figure 4:
Kmg is enriched at cryptic promoters in Mi-2 and Dany knockdown testes. (A) Heatmap plots of ChIP-seq for Kmg in control, Mi-2 and Dany knockdown testes, showing +/− 1Kb centered at the TSS of the highest expressed transcript starting at each cryptic promoter, aligned 5’ to 3’ relative to each transcript. Color intensity denotes score for coverage of normalized read counts (CPM). Loci sorted by level of promoter expression, highest on top. (B) Summary plots with the mean of the coverage scores shown in (A) centered around the same regions, on profiles of Kmg ChIP-seq (solid lines) and corresponding input (dotted lines) signals. (C,D) Aly-HA ChIP-seq, Kmg ChIP-seq, RNA-seq and CAGE profiles for (C) the Np and (D) the CG6280 genes, in control, Kmg, Dany or Mi-2 knockdown testes.
Figure 5:
Figure 5:
Kmg is enriched at loci bound by Aly in control testes. (A) Heatmap plots of ChIP-seq for Aly-HA, ChIP-seq for Kmg and CAGE in control testes, ATAC-seq in control testes enriched for mid-stage spermatocytes (Ctrl72hrs) and aly mutant testes. Plots are centered around the summit of each Aly peak called in control testes (peak q value < 10−10), +/− 1Kb. Color intensity denotes score for coverage of normalized read counts (CPM). Loci sorted by the level of Aly-HA ChIP-seq signal in control testes. Aly peaks were divided into 3 groups: Aly-dependent promoters (1952 peaks), Aly-independent promoters (1079 peaks), Not promoters (9585 peaks). See Supplemental Fig. S9 for cutoffs, and methods for promoter assignment. (B,C) Summary plots with the mean of the coverage scores shown in (A) centered around the same regions, on profiles of ChIP-seq results for (B) Aly-HA and (C) Kmg (solid lines) and corresponding input (dotted lines). (D-F) Mean of the coverage scores on profiles of ATAC-seq signals centered as in (A). (G-I) Mean of the coverage scores smoothed by method = “gam”, on profiles of CAGE signals centered as in (A), +/− 200bp. (D-I) Note: Y axis scales differ between the Aly peak groups.
Figure 6:
Figure 6:
Location of the Kmg complex at Aly-bound, Aly-dependent promoters depends on expression level. (A) Heatmap plots of ChIP-seq for Aly-HA and Kmg, and RNA-seq in control testes, showing +/− 1Kb centered at the TSS of the highest expressed transcript starting at each Aly-dependent promoter (depicted in Figure 5), aligned 5’ to 3’ relative to each transcript. Color intensity denotes score for coverage of normalized read counts (CPM). Loci sorted by level of promoter expression, highest on top. (B) ChIP-seq data for Aly-HA, Kmg, V5-Dany and Mi-2, RNA-seq and CAGE profiles for CG4836 and S-Lap7 loci. (C) Summary plots with the mean of the coverage scores on profiles of ChIP-seq results for Aly-HA, Kmg, V5-Dany and Mi-2 (solid lines) and corresponding input (dotted lines) for the top 5% highest expressed promoters, centered on the TSS and aligned 5’ to 3’. (D) Mean of the coverage scores on profiles of Kmg ChIP-seq (solid lines) and corresponding input (dotted lines) results comparing the top 5% highest, Mid 5% and 5% lowest expressed promoters, centered on the TSS. (E,F) Mean profiles of Kmg ChIP-seq (solid lines) and corresponding input (dotted lines) results, in control, Mi-2 or Dany knockdown testes, for the (E) 5% highest or (F) 5% lowest expressed promoters, centered on the TSS. (G) Mean profiles of Mi-2 ChIP-seq (solid lines) and corresponding input (dotted lines) results, in control or Kmg knockdown testes, for the top 5% highest expressed promoters. (H,I) Expression profile for Aly-bound, Aly-dependent promoters (dark green: 5% highest, light green: 5% lowest, grey: others), cryptic promoters (pink) and Aly-bound, Aly-dependent promoters that are also classified as cryptic promoters (yellow). Axes: log10 transformation of read counts normalized by DESeq2 in testes from control [X-axis] compared to (H) Kmg knockdown [Y axis], or (I) Mi-2 knockdown [Y axis].
Figure 7:
Figure 7:
Proposed model. (A,A’,A”) Diagram of an Aly-bound, Aly-dependent promoter expressed at low levels in wild type. (A) In wild type testes, Aly (tMAC) binds to the promoter and opens chromatin allowing expression (1). The Kmg/Dany complex at the promoter site dampens transcription, keeping expression low (2). We propose that Mi-2, a chromatin remodeler, is not successful in closing chromatin at these sites (3). (A’) In Kmg knockdown testes, the Kmg complex is not recruited, or not functional, chromatin is open and the promoter upregulated (1). (A”) We propose that in Mi-2 knockdown testes, chromatin does not close, and expression level of the promoter stays low, as Kmg/Dany can still repress transcription (2). (B,B’,B”) Diagram of an Aly-bound, Aly-dependent promoter expressed at very high levels in wild type. (B) We speculate that in wild type testes, Mi-2 associates with nascent RNAs transcribed from the very active promoters. This (yellow star) antagonizes Mi-2 binding to chromatin and allows Kmg/Dany to be pulled away from the promoter, which is thus protected from repression and highly active (1). (B’) In Kmg knockdown testes, the Kmg complex is not recruited, or not functional, and the promoter is expressed at high levels (1). (B”) We propose that in Mi-2 knockdown testes, Kmg/Dany are not pulled away from the promoter where it can dampen transcription (2). (C,C’,C”) Diagram of a cryptic promoter. (C) We speculate that in wild type testes, Aly initially binds to chromatin (1), the Kmg/Dany complex represses transcription (2) and Mi-2 closes chromatin (3) evicting Aly (and the Kmg complex). The binding of these players at cryptic promoters is thus transient. (C’) In Kmg knockdown testes, the surveillance function is lacking, Aly binds and opens chromatin unopposed, and promoters are highly expressed (1). (C”) We propose that in Mi-2 knockdown testes chromatin does not close (due to loss of the chromatin remodeler), Aly is not evicted, and cryptic promoters are transcribed (1). However, Kmg binding at the promoter site keeps expression at lower levels (2) compared to loss of Kmg.

Update of

Similar articles

References

    1. Anderson James T, Steven Henikoff, and Kami Ahmad. 2023. “Chromosome-Specific Maturation of the Epigenome in the Drosophila Male Germline.” eLife 12 (November):RP89373. 10.7554/eLife.89373. - DOI - PMC - PubMed
    1. Baker Catherine C., Gallicchio Lorenzo, Matias Neuza R., Porter Douglas F., Parsanian Lucineh, Taing Emily, Tam Cheuk, and Fuller Margaret T.. 2023. “Cell-Type-Specific Interacting Proteins Collaborate to Regulate the Timing of Cyclin B Protein Expression in Male Meiotic Prophase.” Development (Cambridge) 150 (22). 10.1242/dev.201709. - DOI - PMC - PubMed
    1. Barral Amandine, and Zaret Kenneth S.. 2024. “Pioneer Factors: Roles and Their Regulation in Development.” Trends in Genetics 40 (2): 134–48. 10.1016/j.tig.2023.10.007. - DOI - PMC - PubMed
    1. Beall Eileen L., Lewis Peter W., Bell Maren, Rocha Michael, Leanne Jones D, and Botchan Michael R.. 2007. “Discovery of tMAC: A Drosophila Testis-Specific Meiotic Arrest Complex Paralogous to Myb-Muv B.” Genes and Development 21 (8): 904–19. 10.1101/gad.1516607. - DOI - PMC - PubMed
    1. Bedbrook Claire N., Nath Ravi D., Nagvekar Rahul, Deisseroth Karl, and Brunet Anne. 2023. “Rapid and Precise Genome Engineering in a Naturally Short-Lived Vertebrate.” eLife 12 (May). 10.7554/eLife.80639. - DOI - PMC - PubMed

LinkOut - more resources