. 2025 Aug 6;16(1):7248.
doi: 10.1038/s41467-025-62361-1.

IRX3 controls a SUMOylation-dependent differentiation switch in adipocyte precursor cells

Affiliations

IRX3 controls a SUMOylation-dependent differentiation switch in adipocyte precursor cells

Jan-Inge Bjune et al. Nat Commun. .

Abstract

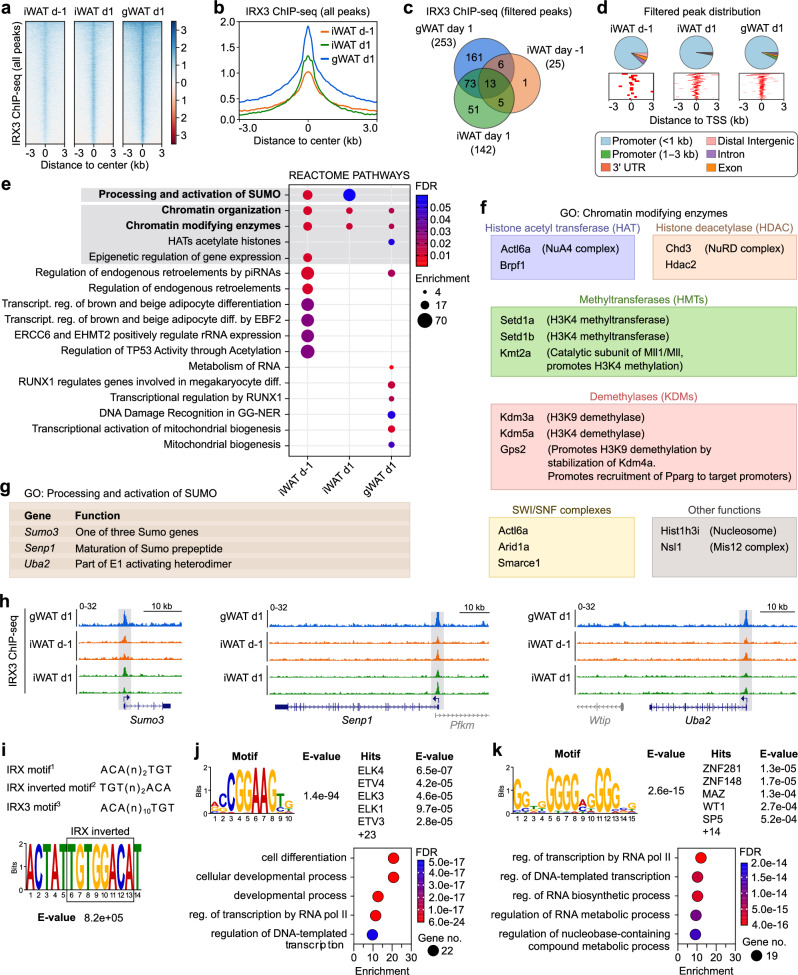
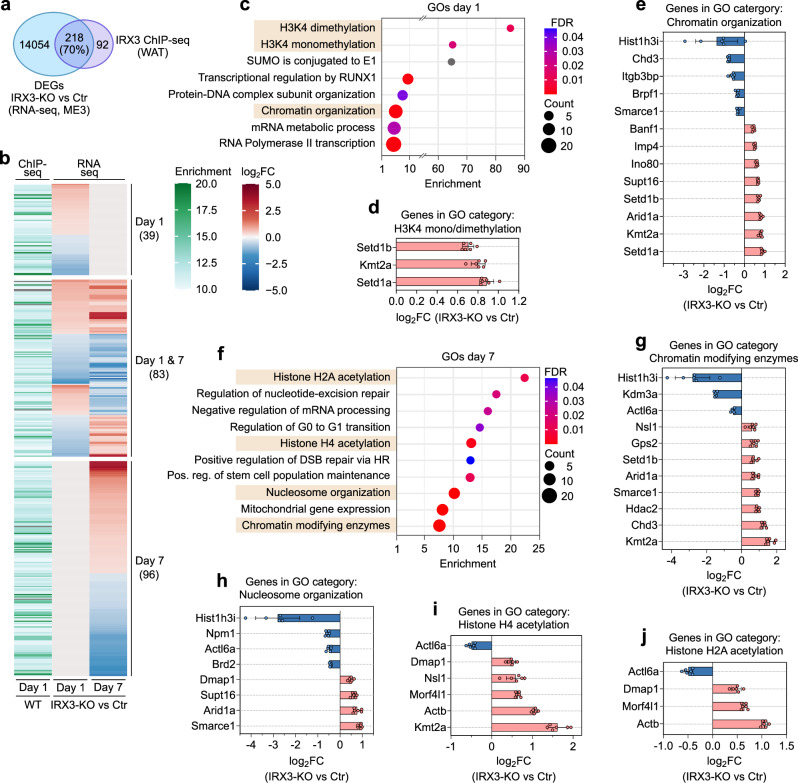
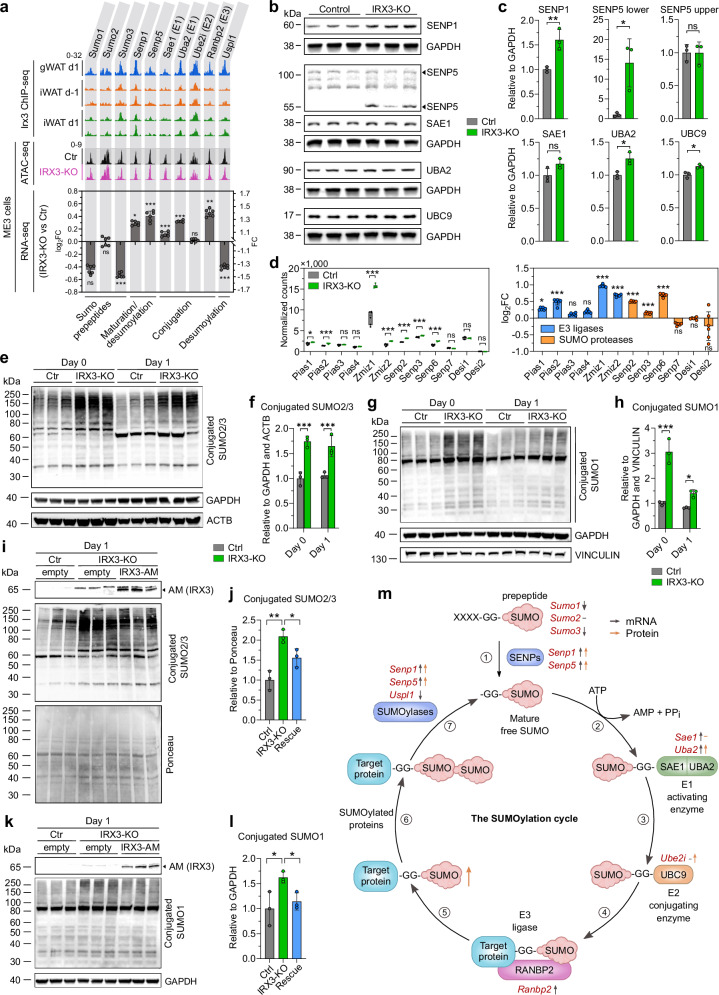
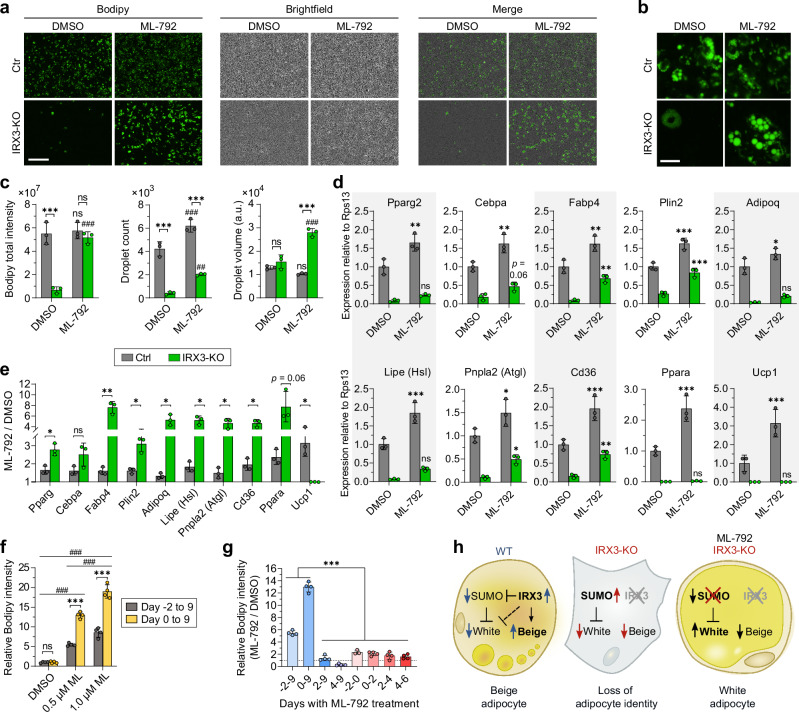
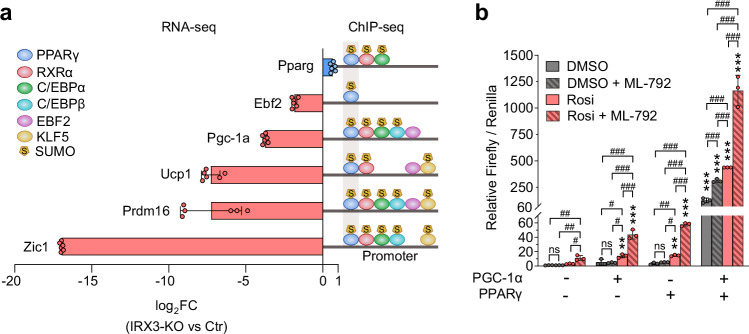
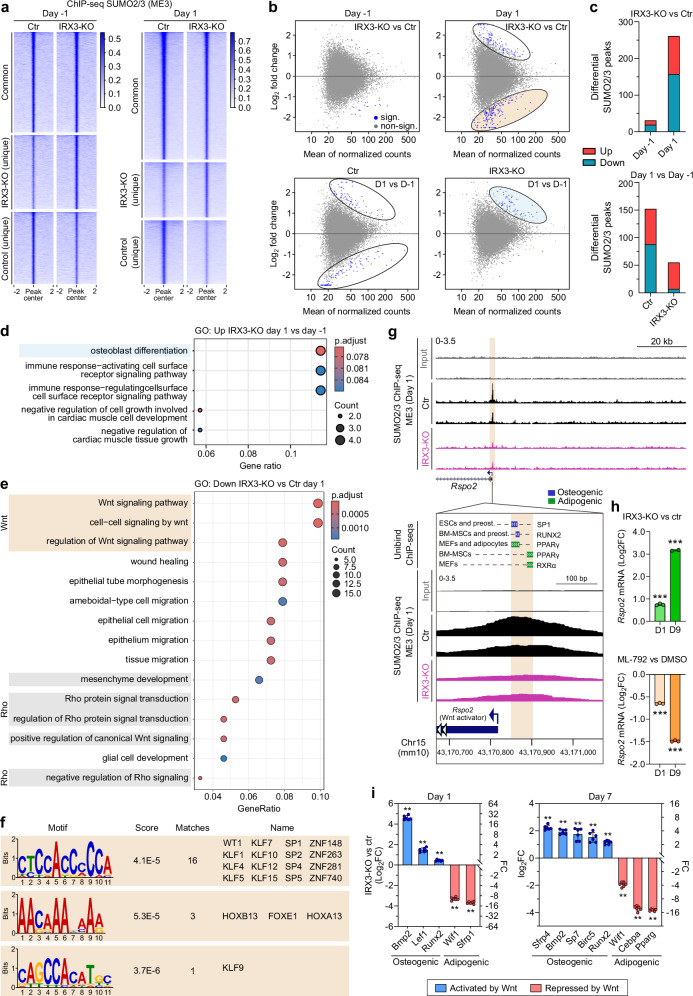
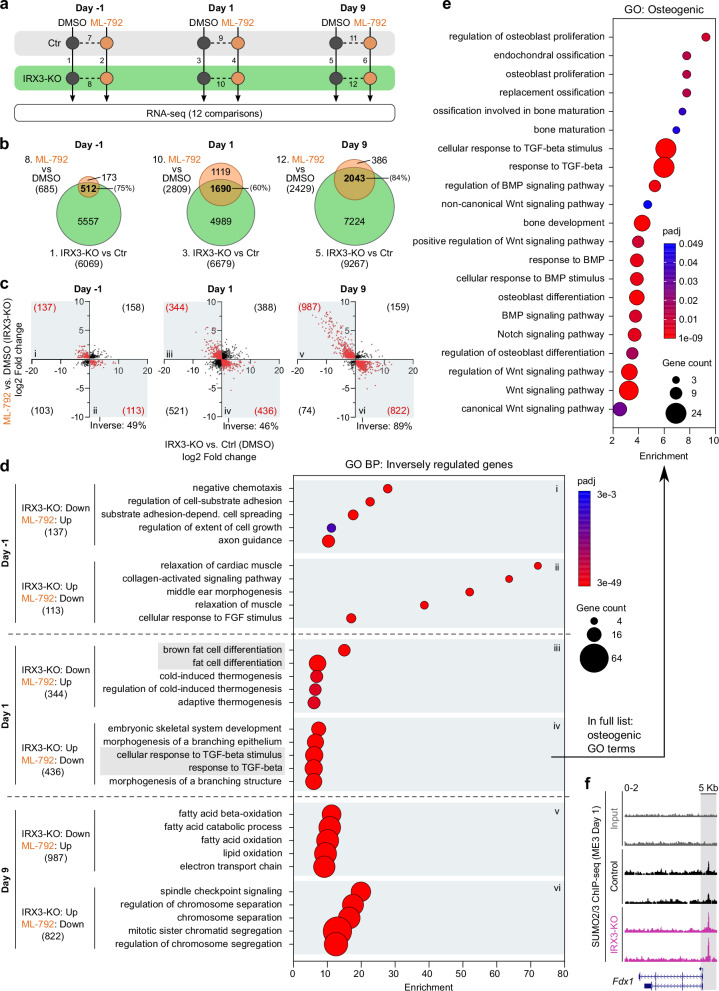
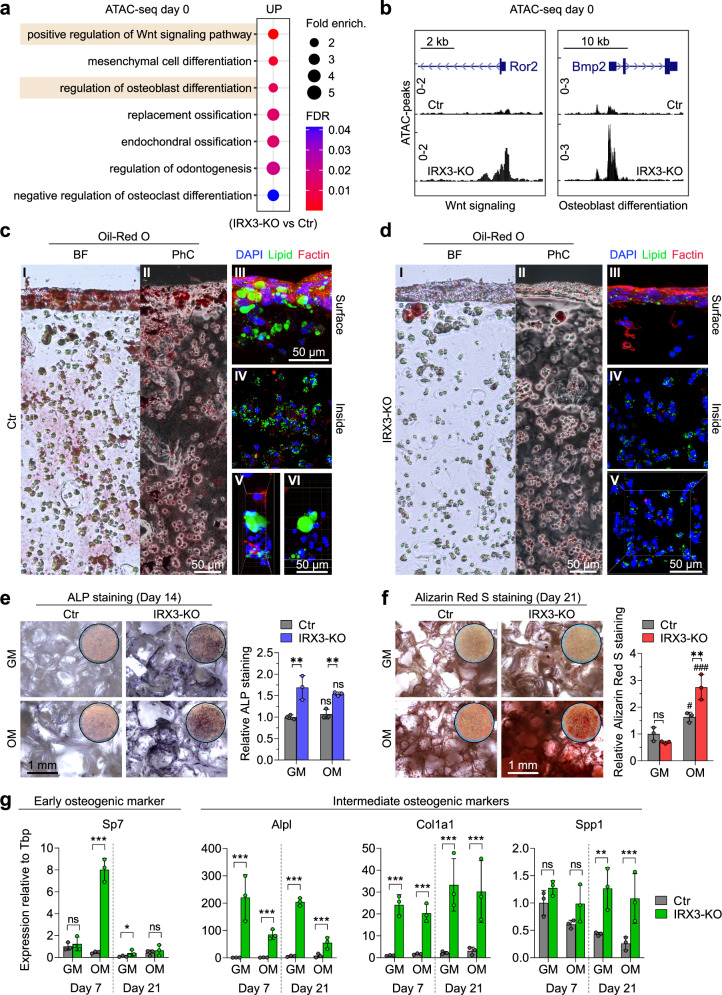
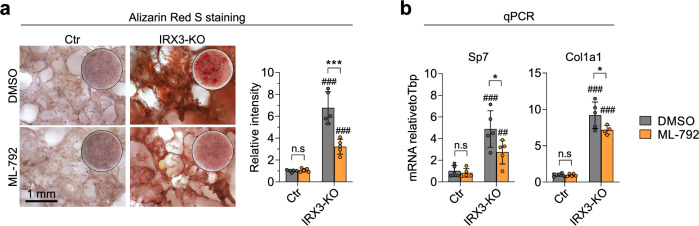
IRX3 is linked to predisposition to obesity through the FTO locus and is upregulated during early adipogenesis in risk-allele carriers, shifting adipocyte fate toward fat storage. However, how this elevated IRX3 expression influences later developmental stages remains unclear. Here we show that IRX3 regulates adipocyte fate by modulating epigenetic reprogramming. ChIP-sequencing in preadipocytes identifies over 300 IRX3 binding sites, predominantly at promoters of genes involved in SUMOylation and chromatin remodeling. IRX3 knockout alters expression of SUMO pathway genes, increases global SUMOylation, and inhibits PPARγ activity and adipogenesis. Pharmacological SUMOylation inhibition rescues these effects. IRX3 KO also reduces SUMO occupancy at Wnt-related genes, enhancing Wnt signaling and promoting osteogenic fate in 3D cultures. This fate switch is partially reversible by SUMOylation inhibition. We identify IRX3 as a key transcriptional regulator of epigenetic programs, acting upstream of SUMOylation to maintain mesenchymal identity and support adipogenesis while suppressing osteogenesis in mouse embryonic fibroblasts.


Conflict of interest statement

Competing interests: The authors declare no competing interests.

Figures

Fig. 1
Fig. 1. Genome-wide mapping of direct IRX3 target genes in preadipocytes.
Chromatin immunoprecipitation followed by sequencing (ChIP-seq) was performed for IRX3 in preadipocytes isolated from inguinal white adipose tissue (iWAT) one day before (day 1) and one day after (day 1) induction of differentiation (n = 2 per condition), and from gonadal WAT (gWAT) on day 1 (n = 1). a Heatmap showing normalized IRX3 peak intensities across all called peaks in iWAT and gWAT in preadipocytes. b Metaprofile plot of aggregate IRX3 binding across all peaks. c Venn diagram of high-confidence IRX3 peaks (q < 0.001, 10-fold enrichment). See also Supplementary Data 1. d Genomic distribution of filtered IRX3 peaks relative to gene features (top) and nearest transcription start sites (TSS) (bottom). e Top 10 significantly enriched REACTOME pathways among IRX3-bound genes per condition. Full list in Supplementary Data 1. f IRX3 target genes involved in chromatin modification. g IRX3 target genes involved in SUMOylation. h Genome browser tracks of IRX3 occupancy at loci encoding SUMO pathway components. Shaded boxes mark peak locations. i Schematic of known and proposed IRX-family DNA binding motifs: preferred minimal motif in Drosophila (1),, inverted (2), and predicted in humans (3) (JASPAR, unvalidated). MEME-ChIP motif analysis under filtered peaks reveals a low-significance match to motif 2. j Most significantly enriched motif identified by MEME-ChIP and its top five TOMTOM matches (top), with associated Panther GO terms for all significant (E < 0.05) matches (bottom). See also Supplementary Data 2–4. k Second most significant MEME-ChIP motif, top five TOMTOM matches, and corresponding Panther GOs for all matches (E < 0.05). See also Supplementary Data 2–4. Source data are provided in the Source Data file.
Fig. 2
Fig. 2. Differentially expressed IRX3 target genes relate to histone modifications and chromatin remodeling.
To identify functionally relevant IRX3 targets, we integrated IRX3 ChIP-seq data from iWAT (n = 2) and gWAT (n = 1) with transcriptomic profiles of IRX3-knockout (KO) ME3 cells during adipocyte differentiation (n = 6; padj 0.01; fold change 1.2; data from. a Venn diagram showing the overlap between IRX3-bound genes and merged differentially expressed genes (DEGs) on days 1 and 7 of differentiation. Circle sizes are not to scale. b Heatmap showing IRX3 binding enrichment at target loci alongside the direction and amplitude of gene expression changes in IRX3-KO cells on days 1 and 7. c Enriched Panther and Reactome ontology terms among the 122 IRX3 target genes that are differentially expressed on day 1. Bar graphs illustrating Log2 fold changes in gene expression for IRX3-KO versus control cells within the GO categories “H3K4 mono/demethylation” (d) and “Chromosome organization” (e) on day 1. f Enriched GO terms among the 179 IRX3 target genes with altered expression on day 7. Log2 fold changes in expression for genes within the GO categories “Chromatin modifying enzymes” (g), “Nucleosome organization” (h), “Histone H4 acetylation” (i), and “Histone H2A acetylation” (j) on day 7. Bars indicate mean expression changes (n = 6), with standard deviation shown as error bars. Upregulated genes are displayed in red; downregulated genes in blue. See Supplementary Fig. S3 for additional categories. Source data are provided in the Source Data file.
Fig. 3
Fig. 3. IRX3 represses SUMOylation.
IRX3 ChIP-seq, ATAC-seq, RNA-seq, and immunoblots were used to assess IRX3-dependent regulation of SUMOylation during adipocyte differentiation. a IRX3 ChIP-seq signal near TSS (±1.5 kb) of SUMO pathway genes in iWAT (n = 2) and gWAT (n = 1) preadipocytes before and after induction of differentiation (top); average ATAC-seq profiles at the same loci in ME3 control and IRX3-KO cells on day 1 (n = 3) (middle); log2 fold changes in IRX3-KO vs. control ME3 cells on day 1 (n = 6) (bottom). *padj =0.01, **padj =0.001, ***padj < 0.001; multiple unpaired, two-sided t-tests with Holm–Sidak correction. b Immunoblot of SUMO pathway proteins from a in ME3 control and IRX3-KO cells on day 1 (n = 3). Representative of two experiments. c Quantification of b, normalized to GAPDH. *p < 0.05, **p = 0.009; unpaired, two-sided t-test. d RNA-seq of SUMO ligases and proteases not bound by IRX3 in WAT (n = 6); expression (left) and log2 fold changes (right). *padj = 0.03, ***padj < 0.001; multiple unpaired, two-sided t-tests with Holm-Sidak correction. e–h Immunoblots and quantifications of global SUMO2/3 (e–f) and SUMO1 (g–h) conjugation in control and IRX3-KO ME3 cells on days 0 and 1 (n = 3). Representative of four (e-f) and two (g-h) experiments. *padj = 0.03, ***padj < 0.001; two-way ANOVA with Holm–Sidak correction.IRX3 rescue in IRX3-KO cells reduces SUMO2/3 and SUMO1 conjugation on day 1. Immunoblots (i, k) and quantifications (j, l) shown (n = 3). Representative of three (i, j) and two (k, l) experiments. *padj < 0.05, **padj = 0.002. m Schematic of the SUMOylation cycle. IRX3-bound genes in red; arrows indicate RNA (grey) and protein (orange) changes. Created in BioRender. Bjune, J. (2025) https://BioRender.com/1m0hzx6. Box plots show medians and interquartile ranges; bar graphs show means ±SD. Source data are provided in the Source Data file.
Fig. 4
Fig. 4. Pharmacological inhibition of SUMOylation restores adipogenesis in IRX3-KO cells.
To assess whether hyperactive SUMOylation contributes to impaired adipogenesis in IRX3-KO cells, ME3 control and IRX3-KO cells were treated with the SUMO E1 inhibitor ML-792 (0.5 µM) from days 2 to 9 of adipocyte differentiation. a Fluorescence and brightfield microscopy images of cells stained with Bodipy lipid dye on day 9. Representative fields from biological triplicates (9 fields/well) shown from one of four independent experiments. Scale bar, 400 µm. See Supplementary Fig. S5a for full image sets. b Higher magnification of selected fields from a. Scale bar, 50 µm. c Quantification of Bodipy intensity, lipid droplet number, and average lipid volume per cell. Data from 9 fields per well merged; n = 3 wells per group. ***padj < 0.001 (IRX3-KO vs. control); ##padj = 0.002, ###padj < 0.001 (ML-792 vs. DMSO); ns, not significant; two-way ANOVA with Holm–Sidak correction. d Adipogenic gene expression in ME3 control and IRX3-KO cells treated with ML-792; n = 3 from one of two experiments. Data normalized to Rps13 and expressed relative to DMSO-treated control. *padj < 0.05, **padj < 0.01, ***padj < 0.001. e Relative effect of ML-792 on gene expression (ML-792/DMSO) in control and IRX3-KO cells. *padj < 0.05, **padj = 0.009; multiple unpaired, two-sided t-tests with Holm–Sidak correction. f Dose-response of ML-792 on lipid accumulation in IRX3-KO cells when added from day 2 or day 0 through day 9; n = 4 from one of three experiments. *padj < 0.05, ***padj < 0.001 (days), ###padj < 0.001 (dose). g Effect of delayed ML-792 applied (blue) or restricted to two-day intervals (red); n = 4. ***padj < 0.001; one-way ANOVA with Holm–Sidak correction. h Proposed model: IRX3 suppresses SUMOylation to permit adipogenic differentiation. Bar graphs show means ±SD. Source data are provided in the Source Data file.
Fig. 5
Fig. 5. Inhibition of SUMOylation improves PPARγ transcriptional activity and its synergy with PGC-1α.
To investigate how hyperactivated SUMOylation suppresses adipogenesis in IRX3-KO cells, the effect of SUMOylation inhibition on PPARγ activity was assessed. a Differential expression of Pparg and downstream target genes in IRX3-KO vs. control ME3 cells on day 1 of differentiation (n = 6); data from. Experimentally validated binding of upstream transcription factors to the promoters of each adipogenic regulator in WT adipogenic cells is shown to the right; ChIP-seq data collected from the UCSC Genome Browser hub UniBind 2021. Transcription factors experimentally shown to be SUMOylated in WT preadipocytes or mature adipocytes are marked with (S), data from. b Luciferase activity of a reporter gene under control of 3 × PPRE sites, co-transfected with PPARγ and/or PGC-1α in ME3 cells. Firefly luciferase units relative to the control group and normalized to constitutive Renilla luciferase is shown; n = 3 replicates from one out of two independent experiments. **padj = 0.001, ***padj < 0.001, overexpression of PGC-1α and/or PPARγ compared to empty plasmid; #padj < 0.05, ##padj < 0.01, ###padj < 0.001, comparison between DMSO, rosi and/or ML-792, two-way ANOVA with Holm-Sidak correction for multiple testing. The data were square-root-transformed prior to statistical analyses. The bar graphs show means ±SD. Source data are provided in the Source Data file.
Fig. 6
Fig. 6. IRX3 ablation alters SUMO occupancy at Wnt and Rho signaling genes.
ChIP-seq for SUMO2/3 was performed in ME3 control and IRX3-KO cells on days 1 and 1 of adipogenic differentiation (n = 2 biological replicates per condition). a Heatmap of SUMO2/3 ChIP-seq peak intensities clustered by shared and condition-specific peaks. See Supplementary Fig. 6, Supplementary Data 7. b MA plots showing differential SUMO2/3 peak intensity for IRX3-KO vs control (top) and day 1 vs day 1 (bottom). Blue dots, peaks with padj < 0.05; grey, non-significant; DESeq2 analysis with Benjamini-Hochberg correction. Beige ellipse, hypoSUMOylated regions in IRX3-KO on day 1; blue ellipse, hyperSUMOylated regions on day 1 vs day 1 in IRX3-KO. See Supplementary Data 7. c Number of significantly up- and downregulated SUMO peaks in b. d ClusterProfiler GO enrichment analysis of genes associated with increased SUMO occupancy in IRX3-KO cells on day 1 versus day 1; Benjamini-Hochberg correction, top 5 terms shown. See Supplementary Data 8. e ClusterProfiler GO enrichment analysis of genes with reduced SUMO occupancy in IRX3-KO vs control cells on day 1; Benjamini-Hochberg correction, top 15 terms shown. See also Supplementary Fig. 6 and Supplementary Data 8. f STREME motif enrichment analysis of SUMO peaks within Wnt pathway genes. Matching TOMTOM motifs are shown. See Supplementary Data 9–10. g Genome browser view of SUMO2/3 peaks at the Rspo2 promoter (top). Zoomed-in comparison with Unibind 2021 ChIP-seq tracks from relevant cell types showing peak overlap with transcription factors involved in osteogenesis and adipogenesis (bottom). h Relative Rspo2 mRNA levels in ME3 control vs IRX3-KO cells (top) and in response to ML-792 (bottom) on day 1 and day 9 (n = 3). ***padj < 0.001; two-way ANOVA with Holm–Sidak correction. i Relative expression of Wnt-responsive genes in IRX3-KO vs control cells on days 1 and 7 (n = 6). Genes upregulated and downregulated by Wnt signaling are shown in red and blue, respectively. **q < 0.01; multiple two-sided Mann-Whitney tests with FDR correction. Bar graphs show means ±SD. Source data are provided in the Source Data file.
Fig. 7
Fig. 7. IRX3 and SUMO inversely regulate shared target genes involved in adipogenic and osteogenic differentiation.
ME3 control and IRX3-KO cells were differentiated under adipogenic conditions and treated with either DMSO or 0.5 µM ML-792 from day 2 to 1, day 0 to 1, or continuously from day 0 to 9 (n = 3 replicate wells per condition). RNA was isolated on days 1, 1, and 9 for transcriptomic analysis. a Schematic of the experimental design. Days indicate the day of cell harvest; solid lines indicate IRX3-KO vs control comparisons; dashed lines represent ML-792 vs DMSO treatment. Numbers 1-12 denote pairwise comparisons. See also Supplementary Fig. 9. b Venn diagrams showing overlap between differentially expressed genes in IRX3-KO vs control cells (comparisons 1, 3, and 5) and in ML-792-treated vs DMSO-treated IRX3-KO cells (comparisons 8, 10, and 12) on days 1, 1, and 9. Percentages indicate the proportion of ML-792 responsive genes also altered in IRX3-KO cells. c Scatter plots of log2 fold changes for overlapping genes from (b). Red dots, genes inversely regulated by IRX3 and SUMO; black dots, genes regulated in the same direction. Roman numerals indicate quadrants; numbers show gene counts per quadrant. d ClusterProfiler GO enrichment analysis of inversely regulated genes from c; Benjamini-Hochberg correction, top 5 biological process (BP) terms per quadrant shown. Quadrants i-vi correspond to quadrants in c. e ClusterProfiler GO terms related to osteogenesis among genes upregulated in IRX3-KO cells and downregulated by ML-792 on day 1 (quadrant iv); Benjamini-Hochberg correction. f UCSC Genome Browser tracks of SUMO2/3 ChIP-seq peaks at the Fdx1 promoter in ME3 control and IRX3-KO cells on day 1. Fdx1 is part of the “electron transport chain” GO category identified among inversely regulated genes (quadrant v in c-d). Bar graphs show means ±SD. Source data are provided in the Source Data file.
Fig. 8
Fig. 8. IRX3 ablation promotes osteogenesis.
a ATAC–seq was performed in ME3 control and IRX3-KO cells on day 0 of adipogenic differentiation (n = 3). Top GO terms among promoter regions with increased chromatin accessibility in IRX3-KO cells are shown. See also Supplementary Fig. S9. b UCSC Genome Browser tracks of ATAC–seq peaks at promoters of genes associated with osteoblast-related GO terms in a, showing enhanced accessibility in IRX3-KO cells. c Adipogenic differentiation of ME3 control cells in 3D culture. I brightfield image of Oil Red O–stained lipid droplets; II, phase contrast image of lipid staining; III, fluorescence image of the hydrogel surface stained with DAPI (blue), Bodipy (green), and F-actin (red); IV, fluorescence image of the hydrogel interior; V–VI, magnified views. Scale bars, 50 μm. d Adipogenic differentiation of IRX3-KO cells in 3D culture. I–V as in (c). Scale bars, 50 μm. e ME3 control and IRX3-KO cells cultured in growth medium (GM) or osteogenic medium (OM), followed by alkaline phosphatase staining. Brightfield images (left) and quantification (right) shown (n = 3). Scale bar, 1 mm. **padj < 0.01, control vs IRX3-KO; ns, not significant, OM vs GM; two-way ANOVA with Holm–Sidak correction. f Alizarin Red S staining to assess mineralization after osteogenic differentiation in ME3 control and IRX3-KO cells. Brightfield images (left) and quantification (right) shown (n = 3). Scale bar, 1 mm. **padj = 0.003, control vs IRX3-KO; ns, not significant; #padj = 0.03; ###padj < 0.001, osteogenic vs growth medium; two-way ANOVA with Holm-Sidak correction. g Expression of early, intermediate, and late osteogenic markers in ME3 control and IRX3-KO cells cultured in GM or OM (n = 3). *padj = 0.04, **padj = 0.003, ***padj < 0.001, control vs IRX3-KO; two-way ANOVA with Holm–Sidak correction. Data were ln-transformed before statistical calculations. Bar graphs show means ±SD. Source data are provided in the Source Data file.
Fig. 9
Fig. 9. Inhibition of SUMOylation represses IRX3-KO-dependent osteogenesis.
To assess whether SUMOylation mediates the IRX3-KO-dependent adipogenesis, ME3 control and IRX3-KO cells were subjected to osteogenic differentiation in 3D culture for 21 days and treated with either vehicle or 0.5 µM ML-792 throughout the differentiation. a Alkaline phosphatase staining. Brightfield view (left) and quantification (right) shown. Data represent n = 5 replicate wells from a single experiment. Scale bar, 1 mm. ***padj < 0.001, DMSO vs. ML-792. ns, not significant; ###padj < 0.001, control vs. IRX3-KO. b Cells were treated as in (a), except RNA was harvested on day 7 and expression of early and intermediate markers of osteogenesis was measured by qPCR. Data normalized to the reference gene Tbp and shown relative to the control group. Data represent n = 5 replicate wells from a single experiment. *padj < 0.05, ns, not significant, DMSO vs. ML-792; ##padj = 0.002, ###padj < 0.001, control vs. IRX3-KO; two-way ANOVA with Holm–Sidak correction. Data were square root-transformed before statistical calculations. Bar graphs show means ±SD. Source data are provided in the Source Data file.

Similar articles

References

    1. Maes, H. H. M., Neale, M. C. & Eaves, L. J. Genetic and environmental factors in relative body weight and human adiposity. Behav. Genet.27, 325–351 (1997). - PubMed
    1. Elks, C. E. et al. Variability in the heritability of Body Mass Index: A systematic review and meta-regression. Front. Endocrinol. 3, 1–14 (2012). - PMC - PubMed
    1. Loos, R. J. F. & Yeo, G. S. H. The genetics of obesity: from discovery to biology. Nat. Rev. Genet.23, 120–133 (2022). - PMC - PubMed
    1. Frayling, T. M. et al. A common variant in the FTO gene is associated with body mass index and predisposes to childhood and adult obesity. Science316, 889–894 (2007). - PMC - PubMed
    1. Scuteri, A. et al. Genome-wide association scan shows genetic variants in the FTO gene are associated with obesity-related traits. PLoS Genet.3, e115 (2007). - PMC - PubMed

LinkOut - more resources