. 2025 Aug 6;16(1):7238.
doi: 10.1038/s41467-025-62189-9.

Ocean freshening near the end of the Mesozoic

Affiliations

Ocean freshening near the end of the Mesozoic

Wiesława Radmacher et al. Nat Commun. .

Abstract

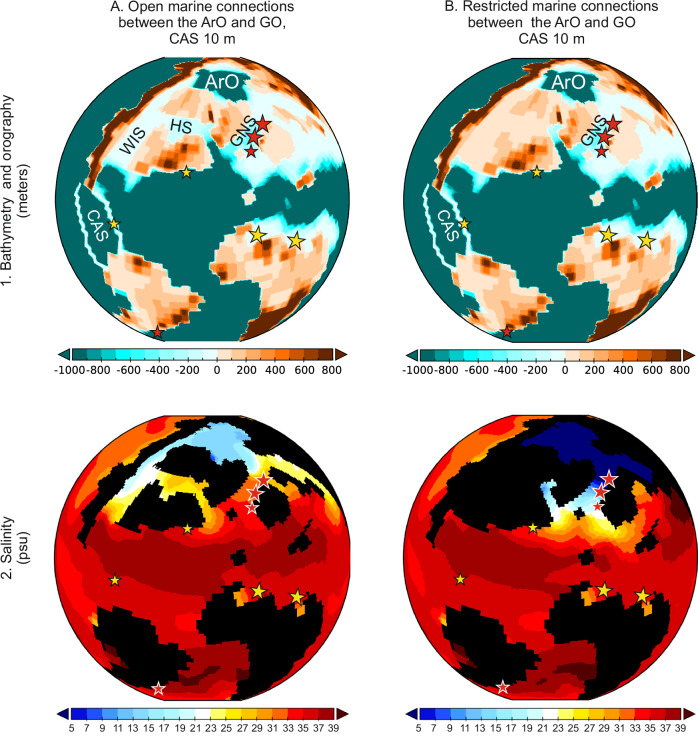
Paleogeographic changes have significantly shaped ocean circulation and climate dynamics throughout Earth's history. This study integrates geological proxies with climate simulations to assess how ocean gateway evolution influenced ocean salinity near the end of the Mesozoic (~66 Ma). Our modeling results demonstrate that 1) Central American Seaway shoaling reorganizes ocean currents, and 2) Arctic marine gateway restrictions, confining Arctic-Global Ocean exchange exclusively to the Greenland-Norwegian Seaway, drive Arctic Ocean surface freshening and southward outflow of buoyant, low-salinity waters. However, only the combined effect of these two factors leads to both Arctic freshening and increased water mass stratification in the Greenland-Norwegian Seaway, proto-North Atlantic, and the Western Tethys. This scenario aligns with Maastrichtian palynological, micropaleontological, and geochemical records from high- and low-latitude sites. Our findings highlight the profound impact of these latest Cretaceous paleogeographic reconfigurations in altering global salinity patterns, underscoring their role as key drivers of global climate dynamics.


Conflict of interest statement

Competing interests: We declare that the authors have no competing interests as defined by Nature Portfolio, or other interests that might be perceived to influence the results and/or discussion reported in this paper.

Figures

Fig. 1
Fig. 1. Latest Cretaceous (Maastrichtian, 70 Ma) paleogeography with a shallowed Central American Seaway (CAS) applied as a boundary condition in the Earth System Model simulations and interpolated to a resolution of 360 ×180°.
The geological sections analyzed in this study are indicated by large stars: (1) Sidi Ziane section in Algeria; (2) Re-2 core from the Negev region in Israel, both within the Western Tethys (WT); and two boreholes: (3) 6711/4-U-1 and (4) 6707/10-1, from the Greenland-Norwegian Seaway (GNS). Small stars represent additional published palynological data from locations such as (5) Barents Sea in the GNS; (6) Bass River south of the Hudson Seaway (HS); (7) Guatemala in the CAS; and (8) Bajada del Jagüel, Argentina, in the western South Atlantic (wSA). Remaining abbreviations: WIS – Western Interior Seaway, pNA - proto-North Atlantic, ArO - Arctic Ocean. The red dashed contour and black frame indicate A the area analyzed in the Earth system model simulations, encompassing the Western Tethys, Atlantic, and Arctic oceans, and B the analyzed region of the proto-North Atlantic.
Fig. 2
Fig. 2. Variations in global water currents driven by bathymetric changes in the Central American Seaway (CAS) and restrictions between the Arctic Ocean (ArO) and the Global Ocean (GO).
A Simulated ocean current patterns under open marine connections between the ArO and the GO; B Simulated ocean currents with restricted ArO–GO connection. Enhanced exchange between the Atlantic and Pacific oceans occurs under conditions of a deep CAS (1), whereas a shallow CAS (2) results in reduced inter-ocean exchange. The scale represents water current speed in meters per second (m/s).
Fig. 3
Fig. 3. A series of model experiments with varying paleogeographies and bathymetries.
The Arctic Ocean (ArO) is either restricted or connected to the Global Ocean (GO). Central American Seaway (CAS) depths are set to 10, 500, and 1700–2500 m. WT Western Tethys, pNA proto-North Atlantic. The analyzed region is shown in Fig. 1 (Region A).
Fig. 4
Fig. 4. The Maastrichtian Pacific-Arctic-Atlantic-Tethys salinity changes under different configurations.
A Shallow Central American Seaway (CAS) with open marine connections around the Arctic Ocean (ArO); B Shallow CAS with restricted marine connections around the ArO. WIS Western Interior Seaway, HS Hudson Seaway, GNS Greenland-Norwegian Seaway.
Fig. 5
Fig. 5. Simulated salinity and temperature in the proto-North Atlantic under varying paleogeographic scenarios.
A Zonal mean salinity (psu); B Zonal mean temperature (°C). Various paleogeographic scenarios are considered, including both open and restricted connections between the Arctic Ocean (ArO) and the Global Ocean (GO), as well as variations in the depth of the Central American Seaway (CAS), ranging from shallow (10 m) to deep (1700–2500 m). The analyzed region corresponds to Region B in Fig. 1.
Fig. 6
Fig. 6. Stratigraphic correlation between the Sidi Ziane and Zumaia sections, showing tie-points used for the age model of the late Maastrichtian at Sidi Ziane.
Last Occurrence Datum (LO) and First Occurrence (FO). *= Not recognized at Zumaia, the LO of Gansserina gansseri is based on its stratigraphic position at Gubbio section, Italy.
Fig. 7
Fig. 7. Temporal correlation of planktic foraminifera, dinoflagellate cysts, and carbonate geochemistry of the Sidi Ziane section.
A Bulk sediment carbon isotope (δ13C, ‰); B oxygen stable isotope (δ18O, ‰); C calcium carbonate content (CaCO3 %); D Relative abundance (%) of selected planktic foraminifera genera; E Relative abundance (%) of selected dinocysts. Biozone ranges are marked by: 1 = Gansserina gansseri; 2 = Plummerita hantkeninoides; 3 = Archaeoglobigerina cretacea. The age for the C29r/C30n reversal is based on the Geological Time Scale 2020.
Fig. 8
Fig. 8. Compositional data and statistical evaluation of the Sidi Ziane section, Algeria.
A, B Relative abundance of dinocyst and planktic foraminiferal groups in the directly comparable samples. C Violin plot for the compositional data analysis using CLR-transformed abundances, comparing the abundance of areoligeracean dinocysts under two different scenarios based on the relative abundance of the planktic foraminiferal genera Guembelitria and Planohedbergella. D Violin plot for the compositional data analysis using relative abundances, comparing the above mentioned groups. C, D also display the results of the Wilcoxon test to evaluate statistical significance.
Fig. 9
Fig. 9. Scanning Electron Microscope (SEM) photographs.
1–6: Dinoflagellate cysts from Negev, Israel, belonging to the Areoligeraceae, which dominated lower-latitude regions during the latest Cretaceous. 1. Areoligera volata; 2–4. A. senonensis; 5–6: A. medusettiformis; 7–10: Planktic foraminifera from the uppermost Maastrichtian of Sidi Ziane, Algeria; 7–8: Guembelitria cretacea, a – axial view, b – spiral view; 9: Planohedbergella prairiehillensis, a – lateral view, b – umbilical view; 10: Planohedbergella volutus a – lateral view, b – umbilical view.

References

    1. Donnadieu, Y., Pucéat, E., Moiroud, M., Guillocheau, F. & Deconinck, J. F. A better-ventilated ocean triggered by Late Cretaceous changes in continental configuration. Nat. Commun. 7, 10316 (2016). - PMC - PubMed
    1. Ladant, J. B. et al. Paleogeographic controls on the evolution of Late Cretaceous ocean circulation. Climate16, 973–1006 (2020).
    1. Laugié, M. et al. Exploring the impact of Cenomanian paleogeography and marine gateways on oceanic oxygen. Paleoceanogr. Paleoclimatol.36, e2020PA004202 (2021).
    1. Niezgodzki, I., Knorr, G., Lohmann, G., Tyszka, J. & Markwick, P. J. Late Cretaceous climate simulations with different CO2 levels and subarctic gateway configurations: A model-data comparison. Paleoceanography32, 980–998 (2017).
    1. Brass, G. W., Southam, J. R. & Peterson, W. H. Warm saline bottom water in the ancient ocean. Nature296, 620–623 (1982).

LinkOut - more resources