. 2025 Aug 6;16(1):7262.
doi: 10.1038/s41467-025-62514-2.

Plasmodium falciparum egress disrupts endothelial junctions and activates JAK-STAT signaling in a microvascular 3D blood-brain barrier model

Affiliations

Plasmodium falciparum egress disrupts endothelial junctions and activates JAK-STAT signaling in a microvascular 3D blood-brain barrier model

Livia Piatti et al. Nat Commun. .

Abstract

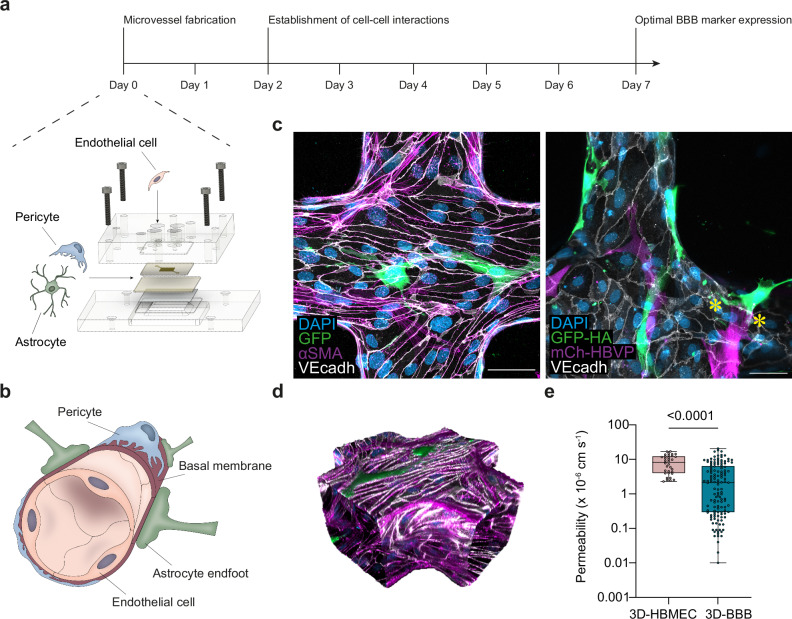
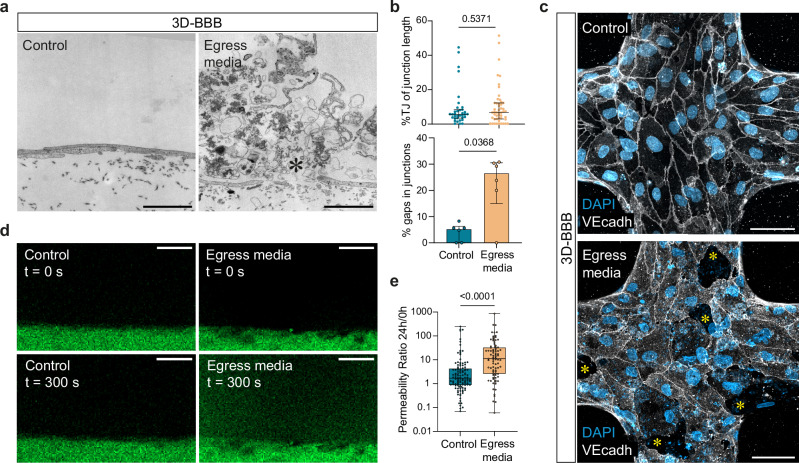
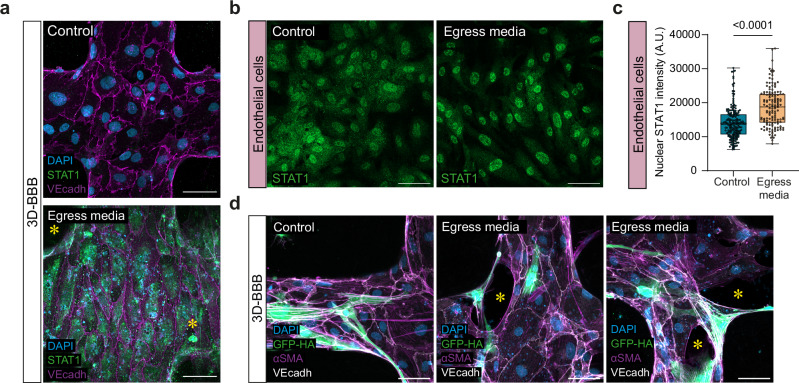
Cerebral malaria is a severe neurovascular complication of Plasmodium falciparum infection, with high mortality rates even after treatment with effective antimalarials. Limitations in current experimental models have hindered our knowledge of the disease. We developed a 3D blood-brain barrier (BBB) model with enhanced barrier properties using primary brain endothelial cells, astrocytes, and pericytes. Exposure to parasite egress products increases microvascular permeability, likely due to transcriptional downregulation of junctional and vascular development genes in endothelial cells. In addition, it increases the expression of ferroptosis markers, antigen presentation and type I interferon genes and upregulates the JAK-STAT pathway across all BBB cell types. Incubation with cytoadherent schizont-stage P. falciparum-infected erythrocytes induces a similar, but highly localized transcriptional shift, along with inter-endothelial gaps at sites of parasite egress, leading to enhanced permeability. Treatment with the JAK-STAT inhibitor Ruxolitinib prevents the increase in permeability induced by P. falciparum egress products. These findings provide key insights into the parasite-mediated mechanisms driving brain microvascular pathogenesis in cerebral malaria and suggest potential avenues for adjunctive therapies.


Conflict of interest statement

Competing interests: The authors declare no competing interests.

Figures

Fig. 1
Fig. 1. Perfusable 3D-BBB microvascular model recapitulates the BBB structure, cell identities and presents improved barrier properties.
a Representation of the experimental timeline for 3D-BBB microvessel fabrication and culture, including a schematic sketch showing the materials for microvessel fabrication and the cells that compose it: human primary astrocytes, pericytes and brain microvascular endothelial cells. b Schematic depiction of the BBB architecture. c Maximum z-projection images of the 3D-BBB microvessel model and the spatial multicellular organization of endothelial cells stained with VE-cadherin (white), GFP-expressing astrocytes and pericytes labeled with αSMA (pink) (left image) or expressing mCherry (right image). Asterisks indicate astrocyte end feet contacting endothelial cells. Representative images from at least 3 independent experiments with similar results. d 3D reconstruction of a portion of the microfluidic network. e Apparent microvascular permeability to 70 kDa FITC-dextran. Each point represents an ROI from endothelial-only (N = 3) and 3D-BBB (N = 13) microvessels (Two-tailed Mann-Whitney U test). Box plots display the median (line within the box), IQR (box), and range (whiskers). Data are provided as a Source Data file.
Fig. 2
Fig. 2. P. falciparum iRBC-egress media induces transcriptional downregulation of junctional markers and BBB signaling.
a Representation of the experimental timeline on 3D-BBB microvessels before and after 24-hour incubation with iRBC-egress media. bg Single-cell transcriptomic analysis comparing 3D-BBB models exposed to iRBC-egress media and control uRBC media. b UMAP of sequenced cells colored by unsupervised Leiden clustering. c Dot plot of main BBB cell type markers. d UMAP of sequenced cells colored by experimental condition. e Volcano plot of differentially expressed genes in endothelial cells upon 24 h iRBC-egress media incubation, plotting the log2-transformed fold change (log2FC) against the statistical significance (-log10 of the false discovery rate (FDR)). Significantly up- or downregulated genes (FDR < 0.05, log2FC > 0.1 or log2FC < − 0.1, respectively) are marked in red or blue and selected downregulated genes are labeled. f GO-term over-representation analysis on significantly downregulated genes (FDR < 0.05, log2FC < − 0.1) in endothelial cells. Each network node represents one of the most significant GO-terms (adjusted p-value < 0.0001), and edges connect GO-terms with more than 20% gene overlap. GO-term clusters were manually summarized with one label term. P-values were calculated using the hypergeometric distribution (one-sided Fisher’s exact test). Multiple comparisons adjustment was performed using the Benjamini-Hochberg procedure. g Selection of downregulated ligand-receptor interactions important for BBB establishment, identified among the three BBB cell types after exposure to iRBC-egress media using the CellChat package. Arrows point from ligands on sender cells to receptors on receiver cells and are colored by the sender cell. Weights of links are proportional to the interaction strength.
Fig. 3
Fig. 3. P. falciparum iRBC-egress media causes inter-endothelial gaps impairing microvascular integrity.
a TEM images showing an inter-endothelial gap formed in 3D-BBB microvessels exposed to iRBC-egress media (right), compared to an intact junction in control microvessels (left). Asterisk indicates parasite egress products. Scale bar = 2 μm. b Scatter plot comparing the percentage of tight junctions over total junctional length in 3D-BBB microvessels exposed to control uRBC media (N = 1 microvessel) or iRBC-egress media (N = 2 microvessels) (top), and bar plot quantifying the percentage of inter-endothelial gaps found by TEM on 3D-BBB microvessels incubated with control uRBC media (N = 1) or iRBC-egress media (N = 2) (bottom). For both graphs, each dot represents the quantification of a TEM section from a different microvessel area with 10–25 quantified junctions, the median value is reported as a line with error bars indicating the IQR (Two-tailed Mann-Whitney U test). c Maximum z-projection of a confocal image showing the junctional marker VE-cadherin (white) in a microvessel incubated with control media or iRBC-egress media. DAPI (blue) stains large nuclei corresponding to BBB cells, and nucleic acids found in iRBC-egress media, presenting small punctate labeling. Asterisks indicate inter-endothelial gaps. Scale bar = 50 μm. Representative image from at least 3 independent experiments with similar results. d Representative images showing 70 kDa FITC-dextran diffusion through the lateral wall of the 3D-BBB before and after 24 h incubation with control media or iRBC-egress media. Scale bar = 50 μm. e Ratio of the apparent permeability calculated at 24 h post-incubation and at pre-incubation with control media or iRBC-egress media. Each point represents the ratio from an ROI coming from 3D-BBB microvessels exposed to control media (N = 4 microvessels) and iRBC-egress media (N = 10) (Two-tailed Mann-Whitney U test). Box plots display the median (line within the box), IQR range (box), and range (whiskers). Data are provided as a Source Data file.
Fig. 4
Fig. 4. iRBC-egress media activates inflammatory and antigen presentation pathways in all BBB cell types.
a Volcano plots of differentially expressed genes in endothelial cells (same analysis as in 3e), pericytes, and astrocytes upon 24-hour incubation with iRBC-egress media, plotting the log2-FC against the statistical significance (‐log10 of the FDR). Significantly up- or downregulated genes (FDR < 0.05, log2FC > 0.1 or log2FC < − 0.1, respectively) are marked in red or blue and selected upregulated genes are labeled. b GO-term over-representation analysis on significantly upregulated genes (FDR < 0.05, log2FC > 0.1) in endothelial cells. Each network node represents one of the most significant GO-terms (adjusted p-value < 0.0001), and edges connect GO-terms with more than 20% gene overlap. GO-term clusters were manually summarized in one label term. P-values were calculated using the hypergeometric distribution (one-sided Fisher’s exact test). Multiple comparisons adjustment was performed using the Benjamini-Hochberg procedure. c Selected upregulated ligand-receptor interactions identified among the cell types within the 3D-BBB model after exposure to iRBC-egress media using the CellChat package. Arrows point from colored ligands on sender cells to receptors on receiver cells. Weights of links are proportional to the interaction strength. d Representative TEM images of endothelial cells within the 3D-BBB model taking up parasite material (asterisk) after incubation with iRBC-egress media (bottom) and a control endothelial cell incubated with uRBC media (top). Scale bar = 2 μm. Additional TEM images can be found in Supplementary Fig. 4a. e Representative confocal images from two independent experiments (left) and close-up views (right) showing maximum z-projection of LAMP1 labeling (yellow) in 3D-BBB microvessels after 24-hour incubation with iRBC-egress media or control media. Scale bar = 50 μm; close-up = 2 μm. f Violin plots showing the MHC I and MHC II gene signature score plotted by cell type and condition (Two-tailed Mann-Whitney U test followed by calculation of effect size r, Benjamini-Hochberg multiple comparisons adjustment). Genes in the MHC I and II signature score can be found in Methods. g Heatmap of pathway activities inferred using the PROGENy method. The colors correspond to the mean PROGENy pathway activity score in the cells of the respective cell type and condition.
Fig. 5
Fig. 5. P. falciparum iRBC-egress induces activation of the JAK-STAT pathway in all the BBB cells and induces changes in vessel architecture.
a Representative confocal imaging showing maximum z-projection of STAT1 labeling (green) in 3D-BBB microvessels after 24 h incubation with iRBC-egress media or control media. Asterisks indicate STAT1-positive astrocytes and pericytes in the collagen hydrogel. Endothelial junctions were labeled with VE-cadherin (magenta) and nuclei with DAPI (blue). Scale bar = 50 μm. b Representative maximum z-projection of confocal images showing STAT1 protein localization (green) in endothelial monolayers after 24 h incubation with iRBC-egress media or media control. Scale bar = 50 μm. c Mean fluorescence intensity of STAT1 labeling in the nuclei of endothelial cells grown on monolayers (N = 6 wells/condition) after 24 h incubation with iRBC-egress media or media control (Two-tailed Mann-Whitney U test). Box plots display the median (line), IQR (box), and range (whiskers). d Representative confocal imaging showing maximum z-projection of 3D-BBB microvessels after 24 h incubation with iRBC-egress media. GFP-expressing astrocytes (green) and αSMA-labeled pericytes (magenta), asterisks represent gaps between endothelial cells, stained with VE-cadherin (white). Scale bar = 50 μm. Representative images (a and d) are from at least 3 independent experiments with similar results. Source data are provided as a Source Data file.
Fig. 6
Fig. 6. Incubation with trophozoite- and schizont-stage P. falciparum-iRBC induces minor transcriptional changes in BBB cell types.
a Representation of the experimental timeline on 3D-BBB microvessels before and after 6-hour incubation with cytoadherent trophozoite or schizont P. falciparum-iRBC or control devices perfused with uRBC. b UMAP of sequenced BBB cells and P. falciparum-iRBC colored by experimental condition. c UMAP of BBB cells after exclusion of P. falciparum-iRBC. d Volcano plots of differentially expressed genes in endothelial cells upon 6-hour incubation with trophozoite- or schizont-stage iRBC, plotting the log2FC against the statistical significance (‐log10 of the FDR). Significantly up- or downregulated genes (FDR < 0.05, log2FC > 0.1 or log2FC < − 0.1, respectively) are marked in red or blue, respectively, and selected genes are labeled. e Heatmap showing log2FC values of selected genes belonging to significant GO-terms shown in Figs. 2f and 4b, in brain endothelial cells after 24-hour exposure to iRBC-egress media, or 6-hour exposure to trophozoite- or schizont-stage iRBC compared to the respective uRBC perfused control. A hierarchical clustering dendrogram was constructed based on the log2FC values of all genes differentially expressed in either of the experimental conditions. f Barplot showing the number of significantly differentially expressed genes (DE genes) (FDR < 0.05, log2FC > 0.1 or log2FC < − 0.1, respectively) in brain endothelial cells. Pericytes and astrocytes upon 3D-BBB microvessel exposure to trophozoite and schizont-stage iRBC, or iRBC-egress media, compared to the respective uRBC perfused controls.
Fig. 7
Fig. 7. Incubation with P. falciparum-iRBC induces localized changes at sites of parasite egress.
a Representative TEM images showing inter-endothelial junctions formed in 3D-BBB microvessels exposed to trophozoites, schizonts or uRBC. Scale bar = 500 nm. b Scatter plot of percentage of tight junctions per total junctional length after incubation with control media, trophozoites and schizonts (N = 3 microvessels/ condition) (Kruskal-Wallis with Dunn’s multiple comparisons test). Each dot represents images from TEM sections, including 58–74 junctions, the lines represent the median and error bars indicate IQR. c Representative z-projection confocal images (left) and close-up (right) of VE-cadherin in control microvessel and after 6 h incubation with schizonts. DAPI identifies mature schizonts (~ 5 μm) and merozoites (< 1 μm). Scale bar = 50 μm. d Scatter plot quantifying the colocalization of gaps and merozoites in ROI of microvessels with low (N = 3) or high (N = 5) schizont rupture. The lines represent the median, and error bars indicate IQR. e TEM image showing an extravasated merozoite (arrowhead) in the collagen of 3D-BBB exposed to schizonts. Scale bar = 2 μm. f Ratio of apparent permeability between values at 6-hour post-incubation with control or schizonts and baseline permeability before incubation. Each point represents a different ROI from 3D-BBB microvessels treated with schizonts (N = 8) or control media (N = 5) (Two-tailed Mann-Whitney U test). Box plots display the median (line), IQR (box), and range (whiskers). g Violin plot of egress signature score in every HBMEC across conditions (Kruskal-Wallis with Dunn’s multiple comparisons test). h Violin plot of egress signature score in HBMEC exposed to schizonts split by P. falciparum RNA content (high > 10 logcounts) (Pf RNA low: N = 385, Pf RNA high: N = 8) (Two-tailed Mann-Whitney U test). i Heatmap showing log2FC values of selected endothelial genes in Figs. 2f and 4b, after exposure to iRBC-egress media, trophozoites, schizonts, or endothelial cells with high P. falciparum-RNA content compared to uRBC control. A hierarchical clustering dendrogram was constructed based on the log2FC values of all genes differentially expressed in either of the experimental conditions. Data are provided as a Source Data file.
Fig. 8
Fig. 8. Pharmacological inhibition of JAK-STAT signaling preserves 3D-BBB integrity.
a Representative maximum z-projection confocal images of STAT1 protein (green) in 3D-BBB microvessels in control microvessels and after 24 h incubation with iRBC-egress media, and upon co-incubation with Ruxolitinib. Scale bar = 50 μm. b Representative maximum z-projection confocal images (left; scale bar = 50 μm) and close-up views (right; scale bar = 20 μm) of junctional marker ZO-1 (magenta) in control microvessels and after 24 h incubation with iRBC-egress media, and upon co-incubation with Ruxolitinib. c Ratio of the apparent permeability between values calculated at 24 h post-incubation with control media or iRBC-egress media, and at pre-incubation. Each point represents the ratio from an ROI from 3D-BBB microvessels exposed to control media (N = 4), iRBC-egress media (N = 10) or co-incubated with Ruxolitinib and control media (N = 3) or iRBC-egress media (N = 4) (Kruskal-Wallis with Dunn’s multiple comparisons test). Box plots display the median (line), IQR (box), and range (whiskers). d Schematic model of the altered pathways in the BBB cell types upon iRBC-egress media exposure and at sites of natural iRBC rupture. P. falciparum egress products released upon iRBC rupture activate antigen presentation (MHC I, MHC II) and inflammation-related (STAT1) pathways in BBB cell types. Furthermore, while endothelial cells downregulate junctional markers, pericytes show reduced Ang-1 and PDGFRβ signaling and astrocytes activate the p53 apoptosis-associated pathway. Pharmacological inhibition of the JAK-STAT pathway through Ruxolitinib prevents STAT1 overexpression and preserves vascular barrier integrity. Representative images in (a and b) are from 2 independent experiments with similar results. Data are provided as a Source Data file.

Similar articles

References

    1. World malaria report 2023. https://www.who.int/teams/global-malaria-programme/reports/world-malaria....
    1. Taylor, T. E. et al. Differentiating the pathologies of cerebral malaria by postmortem parasite counts. Nat. Med.10, 143–145 (2004). - PubMed
    1. Dorovini-Zis, K. et al. The neuropathology of fatal cerebral Malaria in Malawian children. Am. J. Pathol.178, 2146–2158 (2011). - PMC - PubMed
    1. Milner, D. A. et al. The systemic pathology of cerebral malaria in African children. Front. Cell. Infect. Microbiol. 4, 10.3389/fcimb.2014.00104 (2014). - PMC - PubMed
    1. Seydel, K. B. et al. Brain swelling and death in children with cerebral Malaria. N Engl. J. Med.372, 1126–1137 (2015). - PMC - PubMed

MeSH terms

LinkOut - more resources