. 2025 Aug 6;16(1):7266.
doi: 10.1038/s41467-025-62448-9.

SC35-mediated bZIP49 splicing regulates K⁺ channel AKT1 for salt stress adaptation in poplar

Affiliations

SC35-mediated bZIP49 splicing regulates K⁺ channel AKT1 for salt stress adaptation in poplar

Xiao Liu et al. Nat Commun. .

Abstract

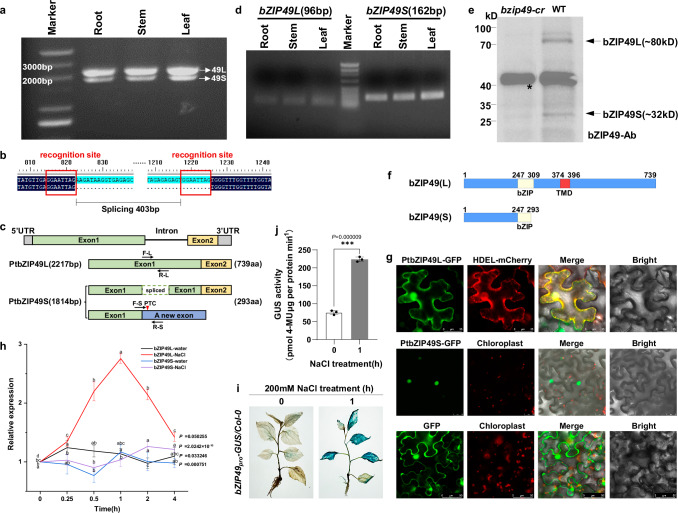
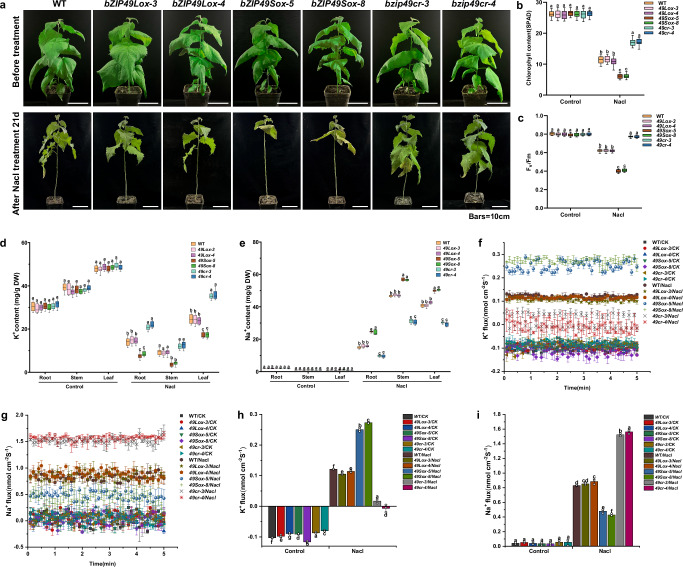
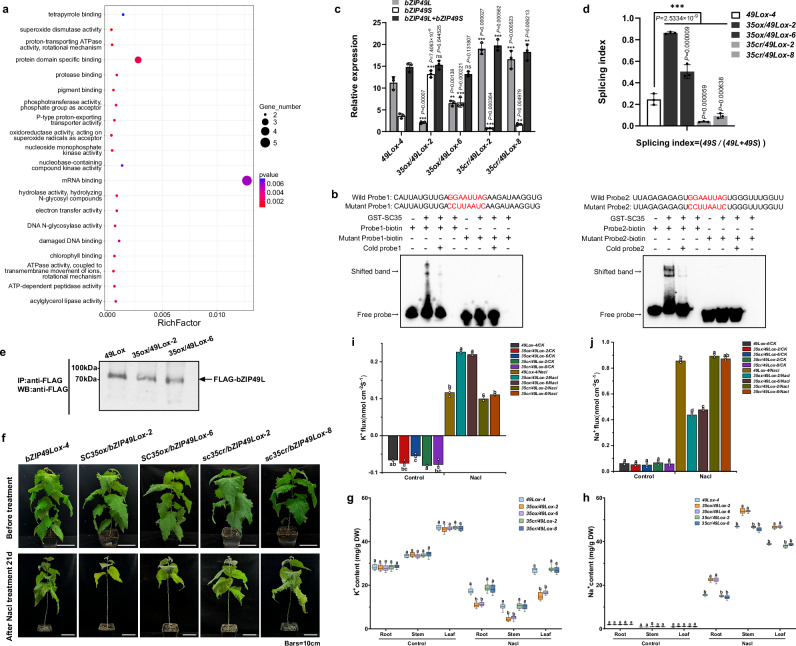
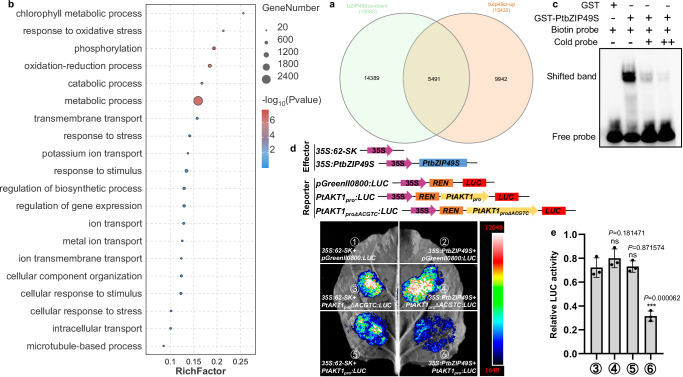
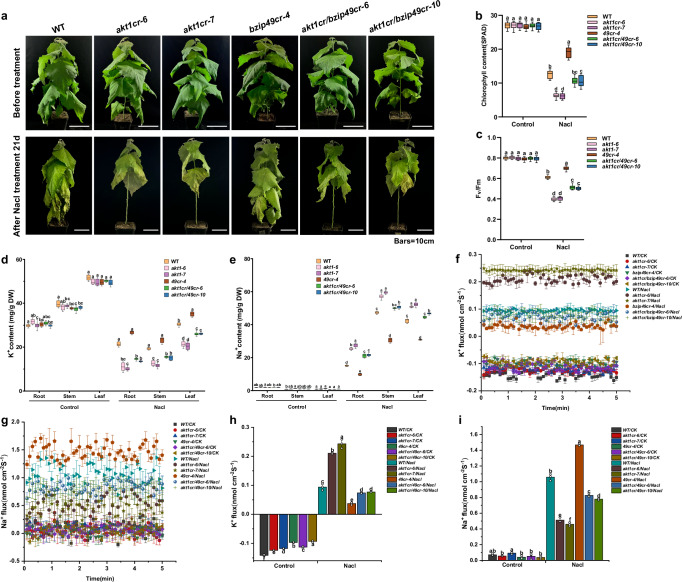
Soil salinization threatens plant distribution, crop yields, and ecosystem stability. In response, plants activate potassium (K+) signaling to maintain Na⁺/K⁺ balance, though the mechanisms regulating K⁺ uptake under salt stress remain poorly understood. This study identified two splice variants of the bZIP49 transcription factor in Populus tomentosa: unspliced "bZIP49L" and spliced "bZIP49S". bZIP49S, the active form under salt stress, reduces salt tolerance when overexpressed, while bzip49cr knockout enhances it. The serine/arginine-rich splicing factor SC35 was identified as a regulator of bZIP49 mRNA splicing through a self-developed experimental method, and its overexpression enhances salt sensitivity. bZIP49S inhibits the K+ transporter AKT1 by binding its promoter, and AKT1 loss in bzip49cr mutant limits K+ influx and reduces salt tolerance. Under salt stress, the E2 ubiquitin-conjugating enzyme UBC32 promotes SC35 degradation via ubiquitination, lowering bZIP49S levels and alleviating the inhibition of AKT1. This facilitates K⁺ uptake, restores Na⁺/K⁺ balance, and improves salt tolerance. Our study highlights the critical role of bZIP49 splicing and the "UBC32-SC35-bZIP49-AKT1" module in modulating Na⁺/K⁺ balance under salt stress in poplar.


Conflict of interest statement

Competing interests: The authors declare no competing interests. Ethical approval: This study did not involve human participants, animal subjects, or sensitive social data. All authors contributed equally, regardless of gender, nationality, or institutional affiliation. The research was conducted in compliance with institutional guidelines for responsible and ethical scientific practices.

Figures

Fig. 1
Fig. 1. Discovery of bZIP49 specific splicing events in P. tomentosa.
a Cloning of bZIP49 in P. tomentosa revealed two bands: the upper band corresponds to the unspliced transcript, while the lower band represents the spliced variant. b Schematic diagram of the mRNA splicing of bZIP49 and its corresponding isoforms. The red box marks the recognition site, and the horizontal line represents the 403 bp spliced fragment. c The complete schematic diagram of the PtbZIP49 gene structure and corresponding structural diagrams of two transcription variants, PtbZIP49L and PtbZIP49S. The arrow represents the specific primer used for RT-qPCR, and the green dashed rectangle represents the excised 403 bp fragment. A red triangle indicates a premature termination codon (PTC) at the newly formed intron. d Semi-quantitation RT-qPCR product analysis of bZIP49L and bZIP49S transcript isoforms in the roots, stems, and leaves of wild-type P. tomentosa. e Immunoblot analysis of bZIP49L and bZIP49S protein isoforms. The nuclear proteins from wild-type (WT) and bzip49cr mutant lines were isolated for immunoblot assays with anti-bZIP49 antibody. *, indicates non-specific bands. f Diagrams illustrating the predicted proteins structures encoded by bZIP49L and bZIP49S. g Subcellular localization of PtbZIP49L and PtbZIP49S in N. benthamiana leaves, with RFP-HDEL used as an ER marker. h Relative expression levels of bZIP49L and bZIP49S under salt stress, with water treatments as a control. Values are means ± SE; n  =  3 technically replicates (ns P > 0.05; * P < 0.05; *** P < 0.001; one-way ANOVA). i Histochemical analysis of bZIP49Pro-GUS/Col-0 transgenic plants treated with 200 mM NaCl for 0 or 1 h for GUS staining. j Quantitative measurement of GUS activity in bZIP49Pro-GUS seedlings after 200 mM NaCl treatment, with untreated samples as controls. The data are shown as mean ± SE; n  =  3 biological replicates (Two-tailed Student’s t-test: *** P < 0.001). Source data are provided as a Source Data file.
Fig. 2
Fig. 2. bZIP49S, but not bZIP49L, negatively regulates salt tolerance in poplars.
a Phenotypes comparison of 60-day-old WT, bZIP49Lox, bZIP49Sox, and bzip49cr mutant plants under control and 100 mM NaCl conditions. b–e Measurement of chlorophyll content (b), Fv/Fm (c), K+ content (d), and Na+ content (e) under normal and salt stress conditions. f–i Net K+ (f, h) and Na+ (g, i) fluxes in the root meristem and elongation zone measured using NMT. Box plots show the median (center line), the 25th and 75th percentiles (box bounds), and whiskers extending to 1.5 times the interquartile range (IQR). Dots represent outliers beyond the whiskers. n = 12 biological replicates. Line and bar charts show time course flux data and mean ± SE values (n = 3 biological replicates). Different letters indicate significant differences (P < 0.05, two-way ANOVA; P values are shown in Source Data file). Source data are provided as a Source Data file.
Fig. 3
Fig. 3. SC35-mediated splicing of bZIP49 enhances salt sensitivity in bZIP49Lox plants.
a GO enrichment analysis of positive yeast clones (hypergeometric test). Bubbles size reflects enrichment factor. b RNA-EMSA indicated the binding of GST-SC35 to the “GGAAUUAG” RNA motif. c, d RT-qPCR of bZIP49L/S transcripts (c) and splicing index (d) in bZIP49Lox, SC35ox/bZIP49Lox, and sc35cr/bZIP49Lox plants. Data represent mean ± SE (n = 3 technically replicates; ns P > 0.05; **P < 0.01; ***P < 0.001; one-way ANOVA). e Immunoblot analysis of FLAG-bZIP49L following immunoprecipitation in bZIP49Lox and SC35ox/bZIP49Lox plants. f Phenotypes comparison of 60-day-old transgenic lines under normal and 100 mM NaCl conditions. g, h K+ (g) and Na+ content (h) of different genotypes under normal and salt stress conditions. Box plots show medians, interquartile ranges, and 1.5 × IQR whiskers; dots indicate outliers (n = 12 biological replicates). i, j Net K+ (i) and Na+ (j) fluxes in root meristem and elongation zone. Bar charts show the mean values across the time course and replicates. Values are means ± SE (n = 3 biological replicates). Different letters indicate significant differences (P < 0.05, two-way ANOVA; P values are shown in Source Data file). Source data are provided as a Source Data file.
Fig. 4
Fig. 4. Transcriptome analysis shows that bZIP49S may inhibits AKT1.
a Venn diagram shows overlapping genes from two groups of differentially expressed genes. b GO enrichment analysis was performed on the 5491 overlapping genes using the hypergeometric test with the ClusterProfiler R package, identifying significantly overrepresented biological processes. The top 20 GO terms are shown, with the y-axis representing biological processes and the x-axis representing enrichment significance. Bubble size indicates the enrichment factor, the ratio of upregulated genes in a biological process to all genes annotated in that process. c EMSA showing bZIP49 binding to the AKT1 promoter. Biotin-labeled probes were used for protein-DNA binding, with unlabeled probes as competitors. +, added, ++, added at twice the volume. Three biological replicates were performed with similar results. d The effect of bZIP49 on AKT1 expression was analysis using an effector/reporter-based gene transactivation assay in N. benthamiana leaves, with a schematic illustrating the effector and reporter structures. e Luciferase activity analysis. Data are the means ± SE; n = 3 biological replicates (ns, P > 0.05; ***, P < 0.001, one-way ANOVA). Source data are provided as a Source Data file.
Fig. 5
Fig. 5. Mutation of AKT1 reduces the salt tolerance of bzip49cr mutant.
a Phenotypes comparison of 60-day-old WT, akt1cr, bzip49cr and akt1cr/bzip49cr mutant plants under control and 100 mM NaCl conditions. b–e Measurements of chlorophyll content (b), Fv/Fm (c), K+ content (d), and Na+ content (e) of WT, akt1cr, bzip49cr, and akt1cr/bzip49cr mutant plants under normal and salt stress conditions. Box plots show medians, interquartile ranges, and 1.5×IQR whiskers; dots indicate outliers (n = 12 biological replicates). f–i Net K+ (f, h) and Na+ (g, i) fluxes in the root meristem and elongation zone measured using NMT. Line and bar charts display mean values across the time course and replicates. Values are means ± SE (n = 3 biological replicates). Different letters indicate significant differences (P < 0.05, two-way ANOVA; P values are shown in Source Data file). Source data are provided as a Source Data file.
Fig. 6
Fig. 6. UBC32 interacts with SC35, promoting its ubiquitination and degradation, which inhibits bZIP49 splicing and reduces the bZIP49S-mediated suppression of AKT1.
a Co-IP assays show the interaction between UBC32 and SC35. UBC32-Flag and SC35-GFP, or UBC32-Flag and Empty-GFP, were transiently expressed in N. benthamiana leaves, with immunoprecipitated samples detected using anti-GFP and anti-Flag antibodies. b Pull-down assays confirmed the UBC32-SC35 interaction, with anti-GST and anti-His antibodies detecting SC35 and UBC32, respectively. c Proteasome-mediated degradation assay of SC35 in plant cells. SC35-GFP was co-expressed with UBC32 in N. benthamiana leaves, with or without MG132 treatment, and subjected to NaCl treatment at various time points (0, 3, 6, and 12 h). SC35-GFP protein levels were determined using an anti-GFP antibody, with hygromycin B phosphotransferase (HPT) used as the loading control. d UBC32 promotes SC35 ubiquitination. IP of endogenous SC35 in N. benthamiana leaves, with or without UBC32, was followed by detection of ubiquitinated SC35 using anti-Ub antibody, with actin as the loading control. The ‘+’ and ‘-’ symbols represent the presence and absence of components, respectively. IP, immunoprecipitation. e A proposed regulatory model illustrates the pathway of “E2 ubiquitin-conjugating enzyme UBC32Splicing factor SC35 - bZIP49K+ transporter 1 (AKT1)” in poplar. Under normal conditions, low UBC32 expression allows SC35 to promote bZIP49 splicing, increasing bZIP49S transcripts that inhibit AKT1, limit K+ influx, and lower intracellular K+ levels. Under salt stress, increased UBC32 expression promotes SC35 ubiquitination and degradation, lowering bZIP49S level, alleviating AKT1 suppression, increasing K+ influx, decreasing the Na+/K+ ratio, maintaining cellular ion balance, and improving plant salt tolerance. Arrows (→) represent positive regulation, crossed arrows (⊣) indicate negative regulation, and the arrow thickness represents the intensity of regulation. Source data are provided as a Source Data file.

Similar articles

References

    1. Yang, Y. & Guo, Y. Elucidating the molecular mechanisms mediating plant salt-stress responses. N. Phytol.217, 523–539 (2017). - PubMed
    1. Zhu, J. K. Plant salt tolerance. Trends Plant Sci.6, 66–71 (2001). - PubMed
    1. Munns, R. Genes and salt tolerance: bringing them together. N. Phytol.167, 645–663 (2005). - PubMed
    1. Zhu, J.-K. Abiotic stress signaling and responses in plants. Cell167, 313–324 (2016). - PMC - PubMed
    1. Jiang, Z. et al. Plant cell-surface GIPC sphingolipids sense salt to trigger Ca2+ influx. Nature572, 341–346 (2019). - PubMed

MeSH terms

LinkOut - more resources