. 2025 Aug 6;14(1):27.
doi: 10.1038/s41389-025-00574-1.

Novel CDK2/CDK9 inhibitor fadraciclib targets cell survival and DNA damage pathways and synergizes with encorafenib in human colorectal cancer cells with BRAF(V600E)

Affiliations

Novel CDK2/CDK9 inhibitor fadraciclib targets cell survival and DNA damage pathways and synergizes with encorafenib in human colorectal cancer cells with BRAF(V600E)

Md Mohiuddin et al. Oncogenesis. .

Abstract

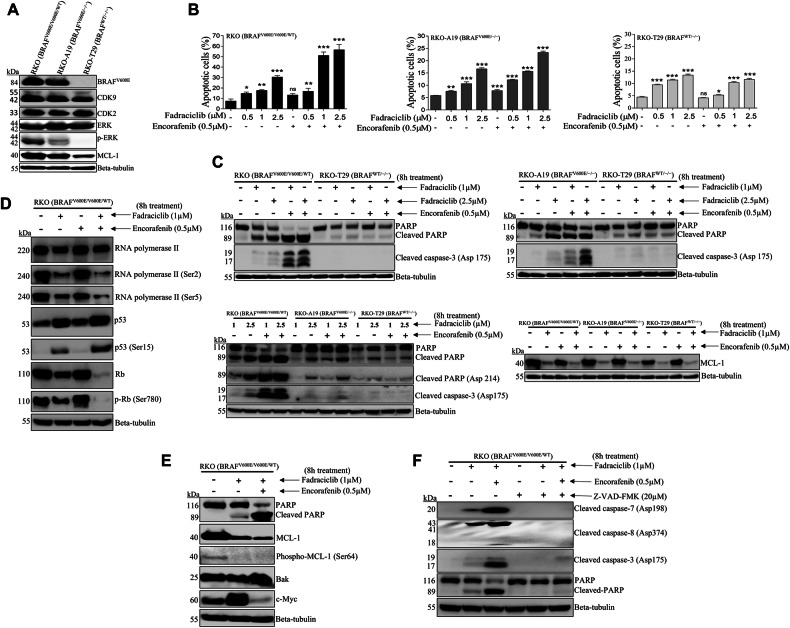
The oncogenic BRAF(V600E) mutation activates the ERK1/2 pathway and is detected in 10% of human colorectal cancers (CRCs) where it is associated with poor prognosis. Inhibitors of BRAF have shown only modest efficacy in patients with CRC due to intrinsic drug resistance. We studied the CDK2/CDK9 inhibitor, fadraciclib, alone and in combination with the BRAF inhibitor encorafenib in isogenic human RKO CRC cells with two, one, or no BRAFV600E alleles (RKO+/+, A19+/-, T29-/-) and in BRAF wild-type HCT-116 cells, including Bax knockout HCT-116Bax-/- cells. Treatment with fadraciclib was shown to suppress MCL-1 and phospho-MCL-1 (Ser64), induce a Bax-dependent apoptosis, and inhibit colony formation in a BRAF gene dose-dependent manner. Fadraciclib decreased phosphorylation of RNA polymerase II, indicating suppression of RNA transcription. The tumor growth inhibitory effect of fadraciclib plus encorafenib was synergistic. Fadraciclib decreased Rb phosphorylation, inhibited cell cycle progression, and promoted DNA damage as evidenced by cleavage of PARP, increased pH2AX (ser139), and activation of p53. In RKO+/+ versus A19+/- or T29-/- cells, drug treatment was associated with greater suppression of p-Rb and inhibition of apoptosis and the cell cycle. In a zebrafish xenograft model, fadraciclib plus encorafenib significantly reduced tumor size, concurrent with increased caspase-3 activation. In human CRCs, BRAF mutation was associated with overexpression of CDK2, and CDK9 overexpression was associated with worse patient survival. In conclusion, fadraciclib depletes MCL-1 to potentiate apoptosis and, combined with encorafenib, synergistically suppresses tumor cell growth in a BRAFV600E gene dose-dependent manner. These data suggest a novel therapeutic strategy in CRCs with BRAFV600E.


Conflict of interest statement

Competing interests: The authors declare no competing interests. Ethics approval and consent to participate: All methods were performed in accordance with the relevant guidelines and regulations. In vivo experiments were performed using zebrafish (Danio rerio), which were handled according to European animal welfare Legislation, Directive 2010/63/EU (European Commission, 2016), DGAV-ORBEA 004166/0421/000/000/2020. No human research was conducted in this manuscript.

Figures

Fig. 1
Fig. 1. Growth inhibitory effects of fadraciclib and encorafenib on BRAF-mutant human CRC cell lines.
A Detection of the expression of BRAFV600E, CDK9, CDK2, ERK, p-ERK, and MCL-1 proteins by immunoblotting. Beta-tubulin was probed as a loading control. Representative immunoblots from three independent experiments are shown. B Isogenic RKO (BRAFV600E/V600E/WT), A19 (BRAFV600E/−/−), and T29 (BRAFWT/−/−) human CRC cell lines were treated with fadraciclib, encorafenib or their combination at the indicated doses for 8 h. Apoptosis induction was analyzed by Annexin V and PI staining as determined by flow cytometry. The results are presented as the mean ± SD of three independent experiments. Significance was determined by a one-way ANOVA followed by Dunnett’s multiple comparison test. (*p < 0.05, **p < 0.01, ***p < 0.001). Non-significant (ns). C Cell lines were treated with fadraciclib, encorafenib or their combination at the indicated doses for 8 h. Immunoblotting detected the expression of cleaved PARP, cleaved PARP (Asp214), cleaved caspase-3 (Asp175), and MCL-1. Beta-tubulin was probed as a loading control. Representative immunoblots from three independent experiments are shown. D RKO (BRAFV600E/V600E/WT) cells were treated with fadraciclib (1 µM), encorafenib (0.5 µM) or their combination for 8 h. Expression of RNA polymerase II, RNA polymerase II (Ser2), RNA polymerase II (Ser5), p53, p53 (Ser15), Rb, and p-Rb (Ser780) proteins were analyzed by immunoblotting. Beta-tubulin was probed as a loading control. Representative immunoblots from three independent experiments are shown. E RKO (BRAFV600E/V600E/WT) cells were treated with fadraciclib alone or combined with encorafenib at the indicated doses for 8 h. Immunoblotting detected the expression of cleaved PARP, MCL-1, phospho-MCL-1 (Ser64), Bak, and c-Myc. Beta-tubulin was probed as a loading control. Representative immunoblots from three independent experiments are shown. F RKO (BRAFV600E/V600E/WT) cells were treated with fadraciclib (1 µM) alone or combined with encorafenib (0.5 µM) for 8 h in the presence or absence of a pan-caspase inhibitor (Z-VAD-FMK). Cells were then probed for cleavage of caspase-7 (Asp198), caspase-8 (Asp374), caspase-3 (Asp175), and PARP by immunoblotting. Beta-tubulin was probed as a loading control. Representative immunoblots from three independent experiments are shown.
Fig. 2
Fig. 2. Effect of fadraciclib on human HCT-116 CRC cells.
A HCT-116 CRC cells were treated with fadraciclib (0.5, 1 µM) for 24 h, and apoptosis induction was measured by Annexin V and PI staining. Results are presented as the mean ± SD of three independent measurements. Significance was determined by a one-way ANOVA followed by Dunnett’s multiple comparison test. (***p < 0.001). B HCT-116 cells were treated with fadraciclib (1 µM) or DMSO (control) for 24 h and immunoblotting was performed to detect expression of RNA polymerase II, RNA polymerase II (Ser2), RNA polymerase II (Ser5), p53, p53 (Ser15), Rb, p-Rb (Ser780), Bcl-xL, MCL-1, cleaved caspase-3 (Asp175), and PARP. Beta-tubulin was probed as a loading control. Representative immunoblots from three independent experiments are shown. C Parental HCT-116 and HCT-116Bax-/- human CRC cell lines were probed for Bax protein expression by immunoblotting. Beta-tubulin was probed as a loading control. Representative immunoblots from three independent trials are shown. D HCT-116Bax-/- cells were treated with fadraciclib at indicated doses for 24 h, and apoptosis was analyzed by annexin V and PI staining. Results are presented as the mean ± SD of three independent measurements. Significance was determined by a one-way ANOVA followed by Dunnett’s multiple comparison test. (***p < 0.001; ns: non-significant).
Fig. 3
Fig. 3. Effect of CDK2/CDK9 inhibition on the growth of BRAFV600E human CRC cells.
A Colony formation assay was performed using RKO (BRAFV600E/V600E/WT), A19 (BRAFV600E/−/−), and T29 (BRAFWT/−/−) human CRC cell lines. Cell lines were treated with fadraciclib, encorafenib or their combination at the indicated doses. Following 8 h of drug treatment, the cell media were replaced with fresh media and incubated for an additional 8 days. Results are the mean ± SD of three independent experiments. Significance was determined by a one-way ANOVA followed by Dunnett’s multiple comparison test. (***p < 0.001; ns: non-significant). B To assess the potential for synergy, the combination index was determined in drug-treated cells. The plot shows the fraction affected (Fa; x-axis) vs. the combination index (CI; y-axis). A synergistic effect was observed as indicated by a CI < 1.
Fig. 4
Fig. 4. Effect of knockdown of CDK2 and CDK9 on drug-induced apoptotic signaling, DNA damage and cell cycle regulatory proteins.
A RKO (BRAFV600E/V600E/WT) cells with knockdown of CDK2 or CDK9 by siRNA were treated with fadraciclib alone or combined with encorafenib at the indicated doses and times. Expression of CDK2, CDK9, RNA polymerase II (Ser5), cleaved PARP, cleaved PARP (Asp214), and cleaved caspase-3 (Asp175) was determined by immunoblotting. Beta-tubulin was probed as a loading control. Representative immunoblots from three independent experiments are shown. B RKO (BRAFV600E/V600E/WT) cells were transfected with siRNA targeting CDK2 and CDK9 or non-target control siRNA. In RKO cells with CDK2/9 siRNA or control, the effect of treatment with fadraciclib, encorafenib or their combination for 8 h on apoptosis was detected by annexin V and PI staining. Results are presented as the mean ± SD of three independent measurements. Significance was determined by a one-way ANOVA followed by Sidak’s multiple comparison test. (***p < 0.001). C In RKO cells treated with fadraciclib alone or combined with encorafenib, immunoblotting was performed to detect the expression of CDK2, CDK9, p-H2A.X (ser139), RNA polymerase II (Ser2), p53, p-Rb (Ser780), MCL-1, cleaved caspase-3 (Asp175), cleaved PARP, and cleaved PARP (Asp214). Beta-tubulin was probed as a loading control. Representative immunoblots from three independent trials are shown. D RKO (BRAFV600E/V600E/WT) cells were treated with fadraciclib alone or combined with encorafenib for 8 h with or without actinomycin D. The expression of cleaved PARP, MCL-1, Bcl-xL, and cleaved caspase-3 (Asp175) was detected by immunoblotting. Beta-tubulin was probed as a loading control. Representative Western blots are shown from three independent experiments.
Fig. 5
Fig. 5. The effect of fadraciclib and encorafenib on cell cycle regulation.
A RKO, A19 and T29 isogenic CRC cells were treated with fadraciclib, encorafenib or their combination (8 h) at the indicated doses. Cells were stained with propidium iodide (PI), and a flow cytometric analysis was performed with analysis of G0/G1, S and G2/M phases of the cell cycle. B The expression of cyclin D1, cyclin B1, p-Rb (Ser780), p-Rb (Ser807/811), MDM2, p53, and phospho-p53 (Ser15) were detected by immunoblotting. Beta-tubulin was probed as a loading control. Representative immunoblots from three independent experiments are shown.
Fig. 6
Fig. 6. The effect of fadraciclib plus encorafenib on tumor size and caspase-3 activation in a zebrafish tumor xenograft model.
A RKO-A19 (BRAFV600E/−/−) tumor cells were re-suspended in Lipossoma Clodronate (for specific macrophage ablation) and then injected into the perivitelline space of zebrafish embryos at 2 days post-fertilization (2 dpf). Zebrafish tumor xenografts were randomly divided into 2 groups: control (untreated) vs those treated with fadraciclib (5 µM) and encorafenib (0.5 µM) for 3 consecutive days. Whole-mount immunofluorescence was performed to analyze cell death in tumor zenografts (anti-activated caspase 3, in green) where nuclei were stained with DAPI (in blue). Tumor xenograft areas are circled with dashed lines. Representative confocal microscopic images of zebrafish xenografts are shown at 3 days post injection (dpi). Percent caspase-3 activation in tumor xenografts (N, as indicated) from control vs. drug-treated groups is shown where each dot represents one xenograft. B Tumor size by treatment group is also shown in control vs drug-treated tumor xenografts. Error bars indicate the mean ± SD; *p < 0.05, ***p < 0.001. Scale bars: 50 µm. C CDK2 and CDK9 gene expression in human CRCs. Using the TCGA database of human CRCs [36], we analyzed gene expression data for CDK2 and CDK9 in human CRCs with or without BRAF mutation. Box plots show CDK2 and CDK9 mRNA expression levels in relationship to BRAF mutation status (Mut or Non-mut). Horizontal line indicates median value and interquartile range (IQR) is represented by the box; minimum and maximum values are indicated by the whiskers. Data was analyzed by Mann–Whitney U-test. (***p < 0.001; ns: non-significant). D Kaplan–Meier analysis of overall survival for CDK2 high vs. CDK2 low gene expression (dichotomized at the median value), and CDK9 high vs. CDK9 low expression in patients with stage III and IV colorectal cancer patients. Gene expression data were obtained from TCGA.

References

    1. Zheng JL, Wang SS, Shen KP, Chen L, Peng X, Chen JF, et al. Ursolic acid induces apoptosis and anoikis in colorectal carcinoma RKO cells. BMC Complement Med Ther. 2021;21:52. - PMC - PubMed
    1. Akimoto N, Ugai T, Zhong R, Hamada T, Fujiyoshi K, Giannakis M, et al. Rising incidence of early-onset colorectal cancer - a call to action. Nat Rev Clin Oncol. 2021;18:230–43. - PMC - PubMed
    1. Tabernero J, Ros J, Elez E. The evolving treatment landscape in BRAF-V600E-mutated metastatic colorectal cancer. Am Soc Clin Oncol Educ Book. 2022;42:1–10. - PubMed
    1. Kawakami H, Huang S, Pal K, Dutta SK, Mukhopadhyay D, Sinicrope FA. Mutant BRAF upregulates MCL-1 to confer apoptosis resistance that is reversed by MCL-1 antagonism and cobimetinib in colorectal cancer. Mol Cancer Ther. 2016;15:3015–27. - PMC - PubMed
    1. Corcoran RB, Ebi H, Turke AB, Coffee EM, Nishino M, Cogdill AP, et al. EGFR-mediated re-activation of MAPK signaling contributes to insensitivity of BRAF mutant colorectal cancers to RAF inhibition with vemurafenib. Cancer Discov. 2012;2:227–35. - PMC - PubMed

LinkOut - more resources