. 2025 Aug 6;16(1):7254.
doi: 10.1038/s41467-025-62495-2.

IgG autoantibodies in bullous pemphigoid induce a pathogenic MyD88-dependent pro-inflammatory response in keratinocytes

Affiliations

IgG autoantibodies in bullous pemphigoid induce a pathogenic MyD88-dependent pro-inflammatory response in keratinocytes

Lei Bao et al. Nat Commun. .

Abstract

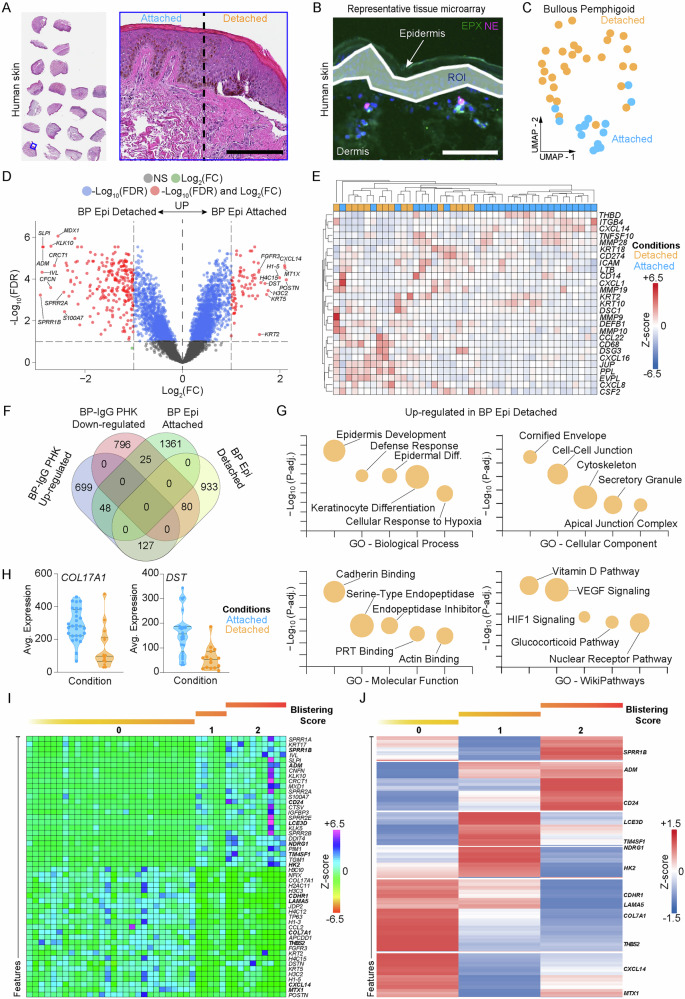
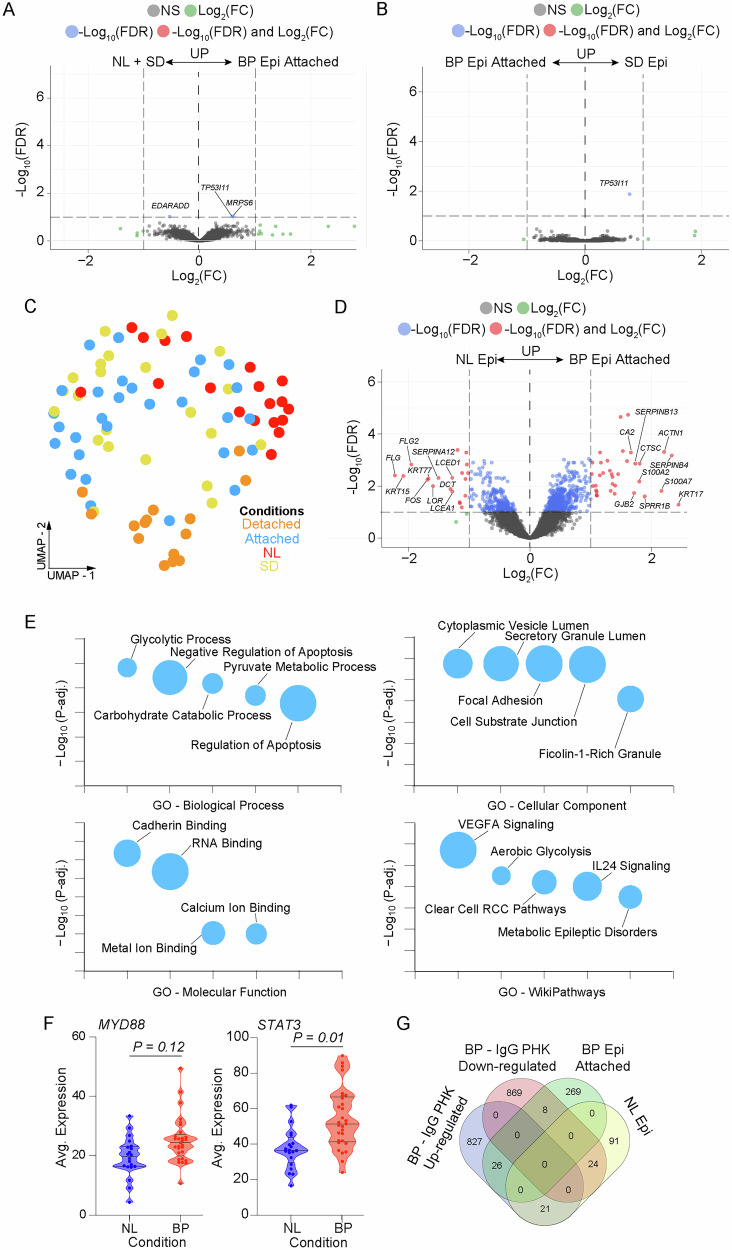
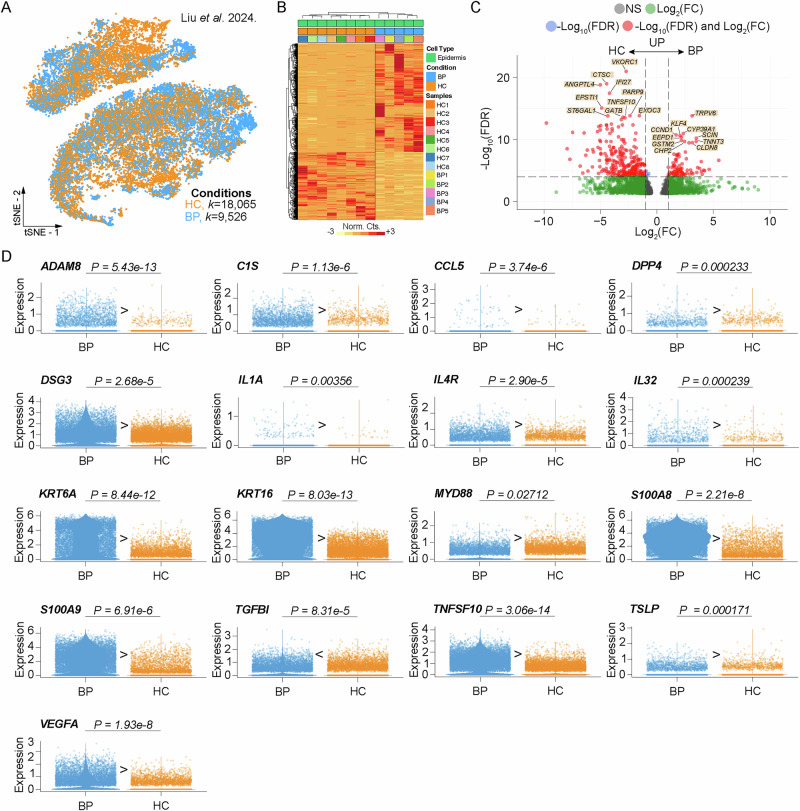
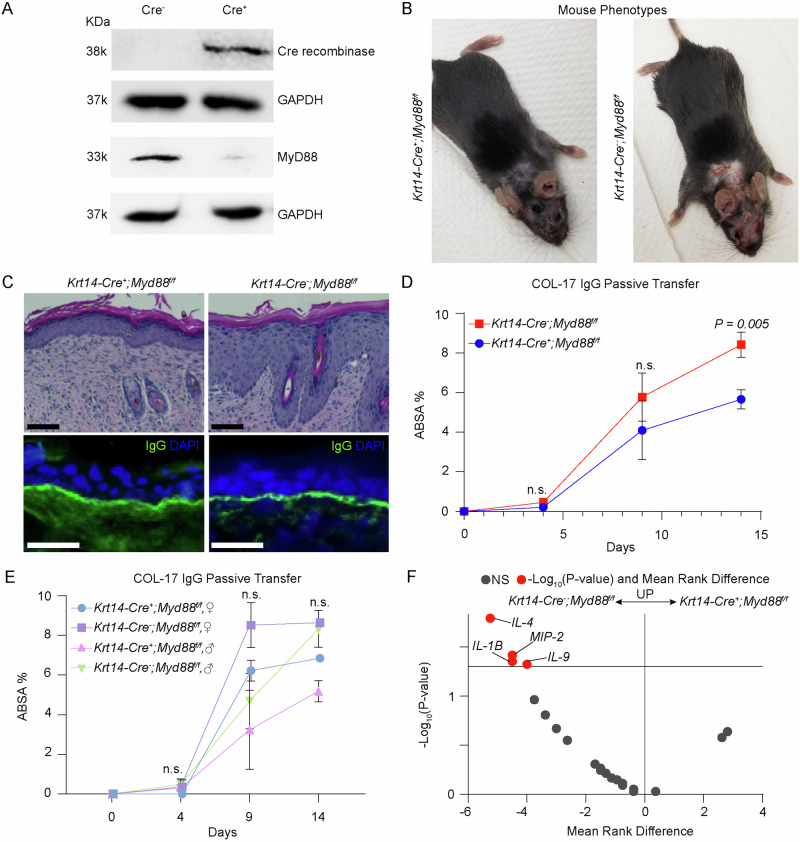
Autoantibodies in bullous pemphigoid (BP) are known to activate the innate immune response. Nevertheless, the direct effect of autoantibodies on keratinocytes and the contribution of keratinocyte responses to the pathology of BP are largely unknown. Here, by performing multiplex immunoassays and RNA-seq on primary keratinocytes treated with IgG derived from BP patients, we identify a MyD88-dependent pro-inflammatory and proteolytic response characterized by the release of several cytokines (IL-6, IL-24, TGF-β1), chemokines (CXCL16, MIP-3β, RANTES), C1s, DPP4, and MMP-9. The activation of this MyD88-dependent response is further validated using spatial transcriptomics and scRNA-seq of diseased skin. Blistering of the skin appears to significantly impact this inflammatory response, with attached BP skin and spongiotic dermatitis revealing indistinguishable transcriptomes. In a preclinical mouse model of BP, Krt14-specific Myd88 knockout significantly decreases disease severity and reduces serum levels of IL-4 and IL-9, indicating a contributory role of keratinocyte-derived skin inflammation in the systemic response. Thus, our work highlights key contributions of keratinocytes in response to autoantibodies in BP.


Conflict of interest statement

Competing interests: This work was supported by Astra Zeneca. A.M., C.M. and C.N. are past or present employees of AstraZeneca and may hold stock and/or stock options or interests in the company. E.S. has a scientific cooperation with Astra Zeneca and received consulting fees from Astra Zeneca (both not related to the present project). The remaining authors declare no competing interests.

Figures

Fig. 1
Fig. 1. BP-IgG induces expression of numerous pro-inflammatory proteins relative to control-IgG treated primary human keratinocytes.
A Heat map demonstrating supernatant protein expression of BP-IgG vs. control-IgG-treated primary human keratinocytes. B Volcano plot of significant up- and down-regulated proteins with Padj <0.05. (Mann-Whitney U-test with False Discovery Rate (FDR) correction with Benjamini, Krieger, and Yekutieli method). C Correlation matrix of supernatant protein levels with hierarchical clustering. AC Data shown are representative of (n = 16) BP-IgG and control-IgG (n = 9) treated samples pooled from two independent experiments. Box and whiskers plot shown as mean, minimum, and maximum with box showing 25th to 75th percentile. D Proteins decreased in BP patients with antibodies detectable only against BP230 (n = 3) vs. those with antibodies only detectable against BP180 (n = 9) normalized to control-IgG-treated keratinocytes. (Welch’s t-test). E BP-IgG induces histologic blistering in 3D HSE in the absence of immune cells. (Mann-Whitney U-test). F Direct immunofluorescence demonstrates deposition of anti-basement membrane IgG in BP-IgG but not control-IgG-treated 3D HSE. E, F data shown are representative of n = 9/cohort pooled from two independent experiments. Data shown is mean ± SEM. NS not significant. Scale bar = 100 μm.
Fig. 2
Fig. 2. Whole transcriptome analysis of BP-IgG versus control-IgG-treated keratinocytes reveals dysregulation of numerous inflammatory and structural genes.
A Heat map of bulk RNA-seq from BP-IgG vs. control-IgG-treated primary human keratinocytes. B Violin plots demonstrating normalized expression of significantly differentially expressed cytokines/chemokines, C Complement components, S100 family, toll-like receptors, extracellular matrix (ECM) components, matrix metalloproteinases, and skin barrier genes. The data shown is the mean Log2(TPM + 1) representative of n = 4 per group. Data is representative of two independent experiments. All data shown are significant at Padj <0.05 (EdgeR). D Validation of MMP9 upregulation by qPCR from one of two independent experiments in a unique patient cohort (n = 4 IgG donors/cohort) is shown as mean, minimum, and maximum (unpaired t-test).
Fig. 3
Fig. 3. Spatial transcriptomics demonstrates a divergent transcriptome between blistered and attached skin in BP.
A Representative tissue microarray (of 3) and distinction of attached vs. detached skin stained with H&E. B Representative region of interest selection strategy (eosinophil peroxidase, EPX) and (neutrophil elastase, NE) is shown in green and magenta respectively; DAPI is shown in blue. C Two-dimensional UMAP plot demonstrating clustering of attached and detached epithelium in BP. D Volcano plot of differentially expressed genes in detached vs. attached epithelia in BP. The top 10 differentially expressed genes sorted by Padj are shown Padj < 0.05 (EdgeR). E Heat map comparing attached and detached gene expression from selected genes from BP-IgG-treated human keratinocyte experiments. F Venn diagram of up- and down-regulated genes between BP-IgG vs. control-IgG-treated primary human keratinocytes and detached vs. attached epithelium in BP. G Dot plots of gene ontology (GO) and WikiPathways for detached vs. attached skin in BP (FDR-corrected). H Differential gene expression of COL17A1 and DST in detached vs. attached BP skin. I Gene expression trajectory of all BP patients in aggregate, and (J) a single patient for whom all levels of blistering were available. The data shown is representative of 26 unique cores selected from BP patients (n = 20). NS not significant, ROI region of interest. Scale bar = 200 μm.
Fig. 4
Fig. 4. Spatial transcriptomics of attached BP skin and spongiotic dermatitis share numerous features distinct from normal skin.
A Volcano plot comparing BP epithelia with normal skin (NL) and spongiotic dermatitis (SD), revealing few differentially expressed genes along with (B) BP vs. spongiotic dermatitis alone. C Two-dimensional UMAP plot demonstrating significant overlap between BP (attached) and spongiotic dermatitis (SD) epithelial transcriptomes with polarization of BP (detached) and normal skin. D Volcano plot demonstrating significantly differentially expressed genes between BP (attached) and normal (NL) skin defined as Log2F.C. > 0.5 and Padj < 0.05 (EdgeR). E Gene ontology (GO) and WikiPathways bubble plots of BP (attached) vs. normal skin (NL). F Upregulation of STAT3 (Padj = 0.01) and MYD88 (Padj = 0.12) expression in BP vs. normal skin (EdgeR). G Venn diagram showing overlapping genes between BP (attached) vs. normal skin (NL) and BP-IgG vs. control-IgG-treated primary human keratinocytes. The data shown are representative of n = 20 patients per cohort. NS not significant.
Fig. 5
Fig. 5. scRNA-seq of BP versus normal keratinocytes.
A Two-dimensional t-SNE feature plot demonstrating bioinformatically gated keratinocyte transcriptomes from BP (n = 5) vs. healthy control (n = 8, HC) patient skin. B Heat map of BP vs. HC skin. C Volcano plot with the top 10 differentially expressed genes between all keratinocytes in BP patients vs. HC skin cohort. D Violin plots of key differentially expressed genes between BP keratinocytes and HC keratinocytes using pseudobulk analysis of scRNA-seq reveals significant dysregulation of several inflammatory, differentiation, and protease markers (DeSeq2). NS not significant.
Fig. 6
Fig. 6. MyD88 regulates a number of responses to BP-IgG in keratinocytes.
A Heat map of gene expression from BP-IgG-treated control (CBP, n = 5) or MyD88-deficient nTERT cells (88BP, n = 5) and control-IgG-treated MyD88-deficient nTERT cells (88 C, n = 4). B Two-dimensional PCA plot demonstrates clustering of samples, supporting significant transcriptional changes due to MyD88 deficiency. C Heat map of supernatant proteins from BP-IgG- vs. control-IgG-treated MyD88 KO nTERT (MyD88BP, n = 4; MyD88C, n = 5) and control nTERT cells (TERTBP, n = 4; TERTC, n = 5). D Violin plots demonstrating selected genes induced by BP-IgG that are affected by MyD88 deficiency. All data shown are significant at Padj < 0.05 (EdgeR). E MyD88 knockout blunts protein expression of IL-8, IL-24, MMP-9, TGFα, GROα, and TIMP-1. F BP-IgG induced protein expression of TGF-β1, PDGF-AB/BB, and RANTES occurs regardless of MyD88 deficiency. G MyD88 knockout results in a relative increase in MMP-1, MMP-3, and IL-20 responses. Data shown are from a single experiment as mean±SEM. EG One way ANOVA with Tukey’s test. NS not significant. *P < 0.05, **P < 0.01, ***P < 0.001, and ***P < 0.0001.
Fig. 7
Fig. 7. Krt14-dependent Myd88 deficiency decreases disease severity in BP, reducing inflammatory cytokines.
A Western blot from one of each genotype demonstrates knockout of MyD88 in skin from Krt14-Cre+ mice, as well as Krt14 limited expression of Cre. B, C Representative phenotype, H&E, and direct immunofluorescence of Krt14-Cre- or Krt14-Cre + ;Myd88fl/fl crosses treated with passive antibody transfer against Col17a1NC1-14. D Decreased affected body surface area (ABSA) score is seen at day 14 in Krt14-Cre + ;Myd88fl/fl (unpaired t-test), (E) without significant sex-based differences appreciated (one-way ANOVA). F Volcano plot demonstrating decreased serum levels of IL-1β, IL-4, MIP-2, and IL-9 in keratinocyte-dependent MyD88 knockouts relative to controls. BE Data shown as mean ± SEM representative of n = 7/condition pooled from two independent experiments. NS not significant. Scale bar = 50 μm.

Update of

Similar articles

References

    1. Amber, K. T., Murrell, D. F., Schmidt, E., Joly, P. & Borradori, L. Autoimmune Subepidermal Bullous Diseases of the Skin and Mucosae: Clinical Features, Diagnosis, and Management. Clin. Rev. Allergy Immunol.54, 26–51 (2018). - PubMed
    1. Cole, C., Borradori, L. & Amber, K. T. Deciphering the Contribution of BP230 Autoantibodies in Bullous Pemphigoid. Antibodies (Basel) 11, 44 (2022). - PMC - PubMed
    1. Hiroyasu, S. et al. Bullous pemphigoid IgG induces BP180 internalization via a macropinocytic pathway. Am. J. Pathol.182, 828–840 (2013). - PMC - PubMed
    1. Bao, L. et al. FcRn inhibition reduces bullous pemphigoid anti-basement membrane zone IgG deposition and blistering in 3D human skin equivalents. J. Invest. Dermatol.144, 2809–2812.e2 (2024). - PubMed
    1. Cole, C., Vinay, K., Borradori, L. & Amber, K. T. Insights Into the Pathogenesis of Bullous Pemphigoid: The Role of Complement-Independent Mechanisms. Front Immunol.13, 912876 (2022). - PMC - PubMed

MeSH terms