. 2025 Aug 6;16(1):7260.
doi: 10.1038/s41467-025-62317-5.

Phase synchrony between prefrontal noradrenergic and cholinergic signals indexes inhibitory control

Affiliations

Phase synchrony between prefrontal noradrenergic and cholinergic signals indexes inhibitory control

Yuxiang Andy Liu et al. Nat Commun. .

Abstract

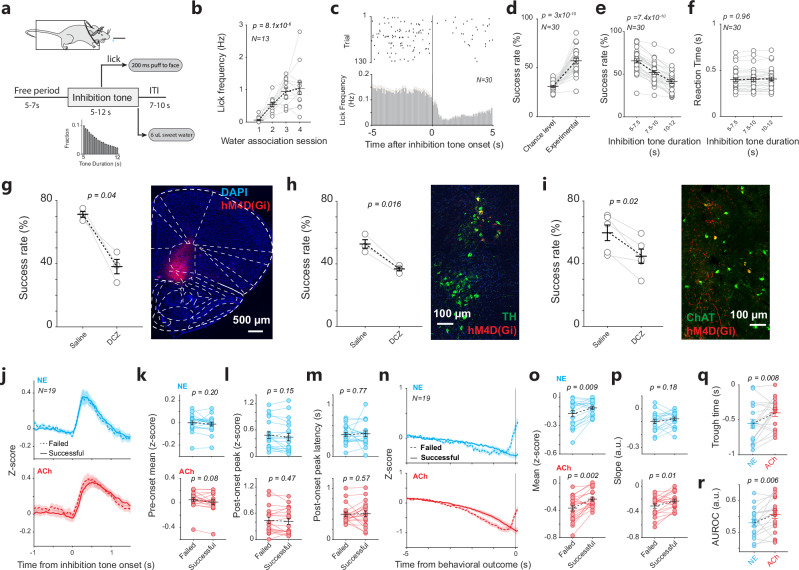
This study investigates how norepinephrine (NE) and acetylcholine (ACh) in the prefrontal cortex (PFC) modulate inhibitory control, a critical executive function. Using fluorescent sensors, we tracked prefrontal NE/ACh dynamics in mice during inhibitory control tasks and found strong NE-ACh coherence at 0.4-0.8 Hz. Inhibiting locus coeruleus (LC) neurons projecting to the basal forebrain (BF) induced greater impairments in inhibitory control than targeting those projecting to the PFC, despite partial overlap. This inhibition disrupted NE-ACh phase synchrony between successful and failed trials, indicating its importance. Conversely, silencing cholinergic neurons projecting to the LC did not affect task performance or phase synchrony. Neuropixels recordings revealed that disrupting LC-BF projections impaired PFC neuronal encoding and altered population firing patterns linked to inhibitory control. These findings suggest that the LC and cholinergic systems jointly modulate inhibitory control by influencing NE-ACh synchrony and its effect on PFC activity, underscoring their role in cognitive control.


Conflict of interest statement

Competing interests: Q.W. is the co-founder of Sharper Sense. The remaining authors declare no competing interests.

Figures

Fig. 1
Fig. 1. Spontaneous fluctuation of NE and ACh levels in the prefrontal cortex.
a Diagram of GRABNE and GRABACh recording. Used with permission of Elsevier, from the Mouse Brain in Stereotaxic Coordinates, Franklin and Paxinos, 2007; permission conveyed through Copyright Clearance Center, Inc. b Histological confirmation of expression of GRABNE and GRABACh in the prefrontal cortex. c Example heatmap of NE and ACh responses to water rewards. d NE and ACh dynamics around water rewards. 25 sessions from 7 animals. e NE and ACh peak responses (top; p = 0.22, two-sided Wilcoxon signed-rank test) and their latencies (bottom; p = 0.03, two-sided Wilcoxon signed-rank test) to water rewards. 25 sessions from 7 animals. f Example traces of simultaneously recorded NE, ACh, and pupil size. Inset: spectrum of NE and ACh signals. g Cross-correlogram between NE and ACh signals. Both peak correlation coefficient (p = 1.3e-4, two-sided Wilcoxon signed-rank test) and latency (p = 5.6e-3, two-sided Wilcoxon signed-rank test) are greater than 0. 165 sessions from 19 animals. Shaded area around 0 indicates 99.7% confidence interval. h Coherence between NE and ACh signals. 165 sessions from 19 animals. Shaded area around 0 indicates 99.7% confidence interval. i, j Cross-correlogram between NE/ACh signals and pupil size. p = 6.3e-4, two-sided paired t-test for peak correlation coefficients and p = 3.4e-4, two-sided paired t-test for cross-correlation lags. 111 sessions from 19 animals for (im). Horizontal shaded area around 0 indicates 99.7% confidence interval. k, l Cross-correlogram between NE/ACh signals and the first derivative of pupil size. P = 0.12, two-sided paired t-test for peak correlation coefficients and p = 2.9e-4, two-sided paired t-test for cross-correlogram lags. Shaded area around 0 indicates 99.7% confidence interval. m Example image of the pupil of a mouse (top) and the phase relationship between prefrontal NE/ACh signals and pupil fluctuations (bottom). Error bars and shaded areas indicate ±SEM. unless otherwise indicated.
Fig. 2
Fig. 2. Prefrontal NE and ACh dynamics during inhibitory control.
a Diagram of the inhibitory control task. b Impulsive licking frequency during the initial shaping period. p = 8.1e-6, one-way ANOVA test. 52 sessions from 13 animals. c Example raster plot of licks (top) and average licking frequency (bottom) around the onset of the inhibition tone. 260 sessions from 30 animals for (cf). d Raw success rate and the chance-level success rate. p = 3e-10, two-sided paired t-test. e Raw success rate associated with different inhibition tone durations. p = 7.4e-10, one-way ANOVA test. f Reaction time associated with different inhibition tone durations. p = 0.96, one-way ANOVA test. g Success rate with and without the inactivation of the prefrontal cortex. p = 0.04, two-sided paired t-test. 28 sessions from 3 animals. h Success rate with and without the inactivation of noradrenergic inputs to the prefrontal cortex. p = 0.016, two-sided paired t-test. 30 sessions from 3 animals. i Success rate with and without the inactivation of cholinergic inputs to the prefrontal cortex. p = 0.02, two-sided paired t-test. 44 sessions from 5 animals. j NE and ACh dynamics around the onset of inhibition tone for the successful and failed trials. 165 sessions from 19 animals for (jr). k Mean NE and ACh levels before inhibition tone onset. NE: p = 0.20, two-sided Wilcoxon signed-rank test; ACh: p = 0.08, two-sided Wilcoxon signed-rank test. l The peak value of NE and ACh transient responses to inhibition tone onset. NE: p = 0.15, two-sided Wilcoxon signed-rank test; ACh: p = 0.47, two-sided Wilcoxon signed-rank test. m The peak latency of NE and ACh transient responses. NE: p = 0.77, two-sided Wilcoxon signed-rank test; ACh: p = 0.57, two-sided Wilcoxon signed-rank test. n NE and ACh dynamics prior to behavioral outcomes in the successful and failed trials. o Mean NE and ACh levels prior to behavioral outcomes. NE: p = 0.009, two-sided Wilcoxon signed-rank test; ACh: p = 0.002, two-sided Wilcoxon signed-rank test. p The slope of NE and ACh signals prior to behavioral outcomes. NE: p = 0.18, two-sided Wilcoxon signed-rank test; ACh: p = 0.01, two-sided Wilcoxon signed-rank test. q The trough time of NE and ACh signals prior to behavioral outcomes. p = 0.008, two-sided paired t-test. r The area under ROC curve (AUROC) calculated from signal distributions associated with the successful and failed trials for NE and ACh signals. p = 0.006, two-sided Wilcoxon signed-rank test. Error bars and shaded areas indicate ±SEM.
Fig. 3
Fig. 3. Chemogenetic silencing of BF-projecting LC neurons impaired the behavior but did not diminish the difference in NE and ACh signals between successful and failed trials.
a Diagram of retrograde expression of DREADD receptors in LC neurons that project to the basal forebrain region. Used with permission of Elsevier, from the Mouse Brain in Stereotaxic Coordinates, Franklin and Paxinos, 2007; permission conveyed through Copyright Clearance Center, Inc. b Histological confirmation of the expression of DREADD receptors in LC neurons. c CNO-mediated chemogenetic inhibition of LC neurons that project to the basal forebrain region reduced the inhibitory control performance to the chance level. p = 4e-3, two-sided paired t-test. d, e Chemogenetic inhibition of LC neurons that project to the basal forebrain region slowed down the reaction time but did not change licking frequency during the free period. p = 5.7e-3, and p = 0.68, respectively, two-sided paired t-tests. f Average NE/ACh signals prior to behavioral outcomes under saline and CNO treatment. g NE/ACh signals prior to behavioral outcomes in the successful and failed trials under saline and CNO treatment. h, i Mean NE and ACh levels prior to behavioral outcomes in the successful and failed trials under saline and CNO treatment. Saline: NE: p = 0.53, two-sided paired t-test; ACh: p = 0.009, two-sided paired t-test. CNO: NE: p = 0.1, two-sided paired t-test; ACh: p = 8e-6, two-sided paired t-test. j Area under the ROC curve (AUROC), which measures the normalized difference in NE/ACh levels between the successful and failed trials, under saline and CNO treatment. ACh: p = 3.1e-27, two-sided Wilcoxon signed-rank test; NE: p = 0.31, two-sided Wilcoxon signed-rank test. All data are from 34 saline sessions and 42 CNO sessions from 5 animals. Error bars and shaded area indicate ±SEM.
Fig. 4
Fig. 4. Phase synchrony between prefrontal NE and ACh signals is a robust indicator of inhibitory control behavior.
a Illustration of the estimation of NE-ACh phase synchrony. b Distribution of NE/ACh phase in successful and failed trials under saline and CNO treatment. c NE-ACh phase synchrony prior to behavioral outcomes under saline and CNO treatment. p = 0.81, two-sided Wilcoxon signed-rank test. d NE-ACh phase synchrony prior to behavioral outcomes in successful and failed trials under saline and CNO treatment. e Mean NE-ACh phase synchrony prior to behavioral outcomes in successful and failed trials under saline and CNO treatment. Saline: p = 0.004, two-sided paired t-test; CNO: p = 0.26, two-sided paired t-test. f AUROC calculated using NE-ACh phase synchrony under saline vs. CNO treatment. p = 2.6e-36, two-sided Wilcoxon signed-rank test. g Difference in prefrontal NE-ACh phase synchrony between successful and failed trials was positively correlated with inhibitory control performance in saline control sessions but not in CNO treatment sessions. Saline: p = 0.015, two-sided t-test; CNO: p = 0.71, two-sided t-test h Switching rate prior to behavioral outcomes in successful and failed trials under saline and CNO treatment. i Mean switching rate prior to behavioral outcomes in successful vs. failed trials under saline or CNO treatment. Saline: p = 3.97e-11, paired t-test; CNO: p = 0.12, paired t-test. All data are from 34 saline sessions and 42 CNO sessions from 5 animals. Error bars and shaded areas indicate ±SEM.
Fig. 5
Fig. 5. Retrograde tracing revealed distinct subgroups of LC neurons projecting to the prefrontal cortex and basal forebrain.
a Diagram showing retrograde expression of different fluorophores in LC neurons that project to the prefrontal cortex and basal forebrain. Used with permission of Elsevier, from the Mouse Brain in Stereotaxic Coordinates, Franklin and Paxinos, 2007; permission conveyed through Copyright Clearance Center, Inc. b Example confocal image showing co-expression of EYFP (pseudocolored green) and mCherry in LC neurons. c Sections of the LC from an example mouse illustrating the spatial distribution of OFC-projecting and BF-projecting LC neurons. d Quantification of LC neurons, OFC-projecting, and BF-projecting LC neurons across anterior-posterior sections. 56 sections from 4 animals. e Overall quantification of LC neurons projecting to the OFC, BF, or both. The cartoon illustrates the percentage of LC neurons projecting to the PFC, BF, or both. OFC-projecting vs BF-projecting: p = 0.41, two-sided paired t-test. OFC-projecting vs OFC&BF-projecting: p = 0.005, two-sided paired t-test. BF-projecting vs OFC&BF-projecting: p = 6e-4, two-sided paired t-test. 56 sections from 4 animals. Error bars indicate ±S.E.M.
Fig. 6
Fig. 6. Neuropixels recording from the prefrontal cortex during inhibitory control.
a Histological confirmation of the location of the Neuropixels probe (indicated by red dye and the yellow arrow) in the prefrontal cortex. The yellow line indicates a distance of 1.2 mm from the Neuropixels probe tip, where most of the active units during inhibitory control were located. Used with permission of Elsevier, from the Mouse Brain in Stereotaxic Coordinates, Franklin and Paxinos, 2007; permission conveyed through Copyright Clearance Center, Inc. b Waveform characteristics of regular spiking units (RSU) and fast spiking units (FSU) (left panel) and their location from the tip of the Neuropixels probe (right panel). c DCZ-mediated chemogenetic inhibition of LC neurons that project to the basal forebrain region reduced the inhibitory control performance to the chance level. p = 0.015, two-sided paired t-test. d Population firing rate prior to behavioral outcomes in the successful and failed trials under saline and DCZ treatment. Inset: mean firing rate under saline and DCZ treatment. p = 0.0043, two-sided t-test. e Number of encoding neurons under saline and DCZ treatment. p = 0.005, two-sided paired t-test. f Total number of neurons under saline and DCZ treatment. p = 0.60, two-sided paired t-test. g Raster plot of spikes of an example encoding neuron on successful and failed trials. h Population firing rate of encoding neurons prior to behavioral outcomes in the successful and failed trials under saline and DCZ treatment. Pie charts: percentage of encoding neurons with higher firing rates in successful trials and encoding neurons with lower firing rates in successful trials. Inset: distribution of encoding neurons along neuropixels probe. i Raster plot of spikes of an example action-predicting neuron on successful and failed trials. j Population firing rate of action-predicting neurons prior to behavioral outcomes in the successful and failed trials under saline and DCZ treatment. Left inset: distribution of encoding neurons along neuropixels probe. Right inset: mean firing rate under saline and DCZ treatment. p = 0.43, two-sided t-test. k Percentage of action-predicting neurons under saline and DCZ treatment. p = 0.41, two-sided paired t-test. l Number of encoding neurons among action-predicting neurons under saline and DCZ treatment. p = 0.43, two-sided paired t-test. All data are from 15 saline sessions and 15 DCZ sessions from 3 animals. Error bars and shaded areas indicate ±SEM.
Fig. 7
Fig. 7. Population firing patterns encoding inhibitory control in the prefrontal cortex.
a Pairwise cross-correlogram across encoding neurons. b Pairwise cross-correlogram across non-encoding neurons. c Projection of population firing patterns associated with inhibitory control and independent component onto dPC1, dPC2 and dPC3, respectively. Left: saline control; right: DCZ treatment. d Population firing patterns associated with inhibitory control plotted in a low-dimensional space. Left: saline control; right: DCZ treatment. e Cluster distance between population firing patterns associated with inhibitory control in successful and failed trials under saline and DCZ treatment. p = 6.8e-3, two-sided t-test. f Cluster distance between population firing patterns associated with inhibitory control in successful and failed trials is positively correlated with behavioral performance in saline control sessions (left; p = 0.02, two-sided t-test.), but not in DCZ treatment sessions (right; p = 0.22, two-sided t-test.). All data are from 15 saline sessions and 15 DCZ sessions from 3 animals. Error bars and shaded areas indicate ±SEM.
Fig. 8
Fig. 8. The relationship between NE-ACh phase synchrony and pupil size.
a Pupil dynamics prior to behavioral outcomes in the successful and failed trials of the inhibitory control task. p = 0.47, two-sided paired t-test. b Identification of temporal response functions that map NE, ACh, or NE-ACh phase synchrony to pupil size. c There was no significant difference in temporal response functions that map prefrontal NE and ACh signals to pupil size between the successful and failed trials in the inhibitory control task. NE: p = 0.74, two-sided paired t-test. ACh: p = 0.2, two-sided paired t-test. d Temporal response functions mapping prefrontal NE-ACh phase synchrony were more pronounced in the failed trials than in successful trials in the inhibitory control task. p = 0.02, two-sided paired t-test. All data are from 111 sessions from 19 animals. Error bars and shaded areas indicate ±SEM.

Update of

References

    1. Dalley, J. W. & Ersche, K. D. Neural circuitry and mechanisms of waiting impulsivity: relevance to addiction. Philos. Trans. R. Soc. Lond. B Biol. Sci.374, 20180145 (2019). - PMC - PubMed
    1. Dalley, J. W. & Robbins, T. W. Fractionating impulsivity: neuropsychiatric implications. Nat. Rev. Neurosci.18, 158–171 (2017). - PubMed
    1. Tomassini, A. et al. Prefrontal cortical connectivity mediates locus coeruleus noradrenergic regulation of inhibitory control in older adults. J. Neurosci.42, 3484 (2022). - PMC - PubMed
    1. Terra, H. et al. Prefrontal cortical projection neurons targeting dorsomedial striatum control behavioral inhibition. Curr. Biol.30, 4188–4200.e4185 (2020). - PubMed
    1. Miller, E. K. & Cohen, J. D. An integrative theory of prefrontal cortex function. Annu. Rev. Neurosci.24, 167–202 (2001). - PubMed

LinkOut - more resources