. 2025 Sep;645(8081):712-721.
doi: 10.1038/s41586-025-09335-x. Epub 2025 Aug 6.

Lithium deficiency and the onset of Alzheimer's disease

Affiliations

Lithium deficiency and the onset of Alzheimer's disease

Liviu Aron et al. Nature. 2025 Sep.

Abstract

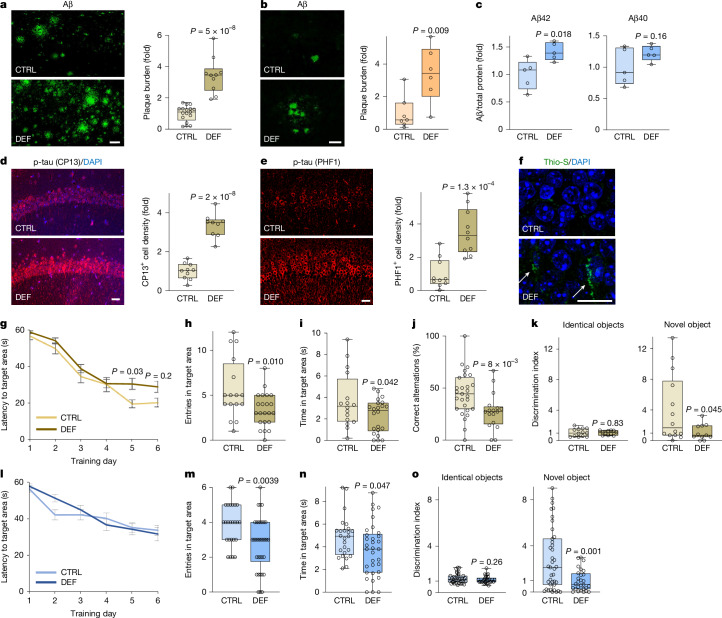
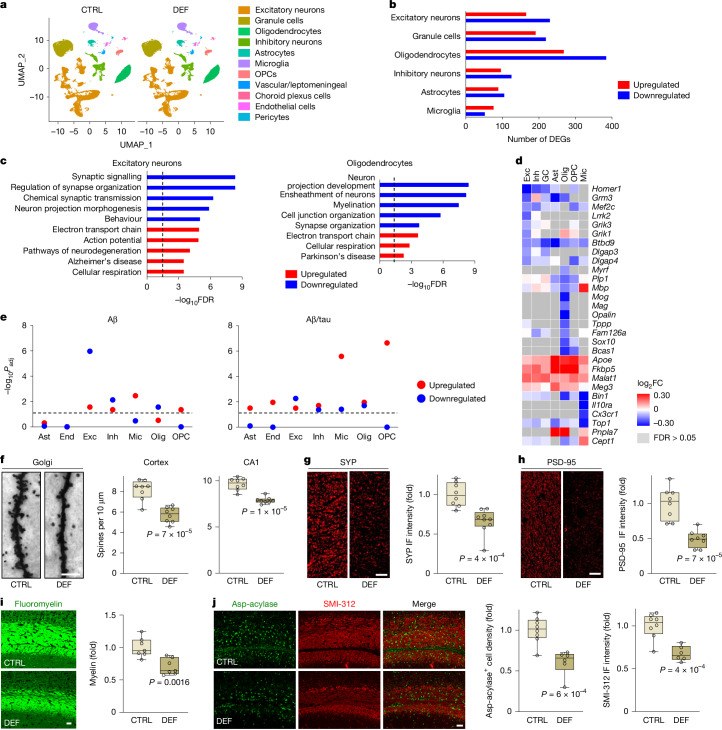
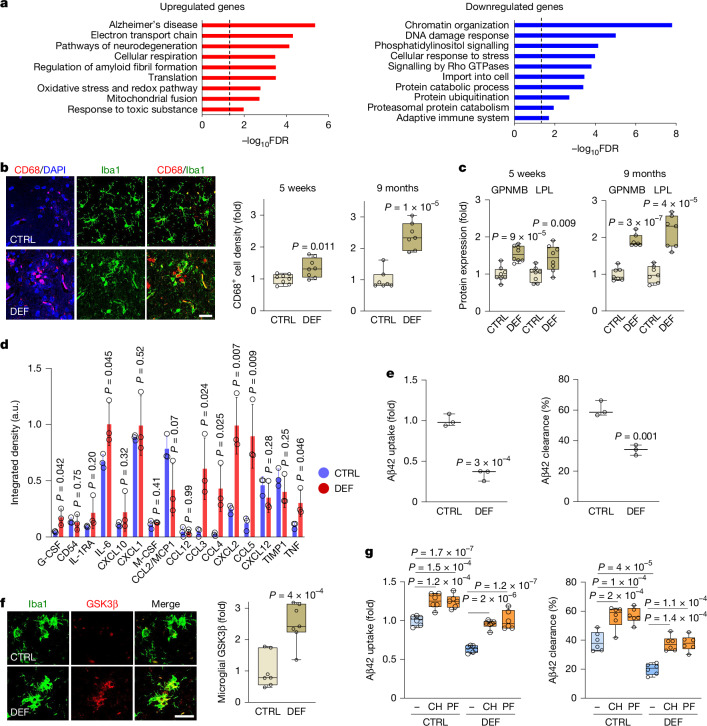
The earliest molecular changes in Alzheimer's disease (AD) are poorly understood1-5. Here we show that endogenous lithium (Li) is dynamically regulated in the brain and contributes to cognitive preservation during ageing. Of the metals we analysed, Li was the only one that was significantly reduced in the brain in individuals with mild cognitive impairment (MCI), a precursor to AD. Li bioavailability was further reduced in AD by amyloid sequestration. We explored the role of endogenous Li in the brain by depleting it from the diet of wild-type and AD mouse models. Reducing endogenous cortical Li by approximately 50% markedly increased the deposition of amyloid-β and the accumulation of phospho-tau, and led to pro-inflammatory microglial activation, the loss of synapses, axons and myelin, and accelerated cognitive decline. These effects were mediated, at least in part, through activation of the kinase GSK3β. Single-nucleus RNA-seq showed that Li deficiency gives rise to transcriptome changes in multiple brain cell types that overlap with transcriptome changes in AD. Replacement therapy with lithium orotate, which is a Li salt with reduced amyloid binding, prevents pathological changes and memory loss in AD mouse models and ageing wild-type mice. These findings reveal physiological effects of endogenous Li in the brain and indicate that disruption of Li homeostasis may be an early event in the pathogenesis of AD. Li replacement with amyloid-evading salts is a potential approach to the prevention and treatment of AD.


Conflict of interest statement

Competing interests: The authors declare no competing interests.

Figures

Fig. 1
Fig. 1. Lithium deficiency and the onset of AD.
a,b, Volcano plots showing changes in metal cortex-to-serum ratios in the PFC of MCI versus NCI (a) and AD versus NCI (b) cases, along with their statistical significance, determined by one-way analysis of variance (ANOVA) with Tukey’s post-hoc test, followed by the Benjamini–Hochberg correction for the number of metals assessed. c,d, Li cortex-to-serum ratios (c) and total cortical Li levels (d) in cases from ROSMAP. Each point represents an individual case. e, Total cortical Li in cases from a replication cohort. f, Li is concentrated in Aβ plaques in MCI and AD. Aβ immunolabelling in the PFC of an AD case (left). LA-ICP–MS was done on an adjacent unfixed section to quantify Li in Aβ plaques (white circles) and neighbouring non-plaque regions (yellow circles). Scale bar, 50 μm. The ratios of Li level in plaque (P) to non-plaque (NP) regions are shown (right) in MCI and AD cases. g, Cortical brain samples were subfractionated into plaque-enriched and non-plaque fractions. Li levels in non-plaque fractions were measured by ICP–MS and normalized to the mean of NCI. P values were calculated by one-way (ad) or two-way (f) ANOVA with Tukey’s post-hoc and Benjamini–Hochberg corrections (ac) or Tukey’s post-hoc corrections (d,f), or by two-tailed unpaired t-test (e,g). cg, Box plots show individual values, median (line), box limits (25th and 75th percentiles) and whiskers (minimum and maximum). ac, NCI n = 133, MCI n = 58, AD n = 94. d, NCI n = 177, MCI n = 66, AD n = 105. e, NCI n = 22, AD n = 21. f, MCI n = 7, AD n = 5. g, NCI n = 74, AD n = 42. Source Data
Fig. 2
Fig. 2. Lithium deficiency accelerates AD pathology and cognitive decline.
a,b, Aβ immunolabelling and plaque quantification (right) in the hippocampus of 3xTg (a) and J20 (b) mice on Li-deficient (DEF) or control (CTRL) diets. c, Aβ42 and Aβ40 levels in the frontal cortex of wild-type (WT) mice on DEF or CTRL diets, normalized to total protein (n = 5 per group). df, Immunolabelling of pSer202-tau (CP13; d) or pSer396/Ser404-tau (PHF1, e) and thioflavin S labelling (f) in the hippocampal CA1 region of 3xTg mice on DEF or CTRL diets, and quantification of phospho-tau-positive cell density (d,e, right). In f, arrows indicate neurofibrillary tangle-like structures. gk, Behavioural assessment of 3xTg mice on DEF or CTRL diets: Morris water-maze learning (g) and memory (h,i), Y-maze (j) and novel-object recognition (k). lo, Behavioural assessment of ageing WT mice on DEF or CTRL diets: Morris water-maze learning (l) and memory (m,n), and novel-object recognition (o). Diets were administered to 3xTg mice from 6 months to 15 months of age (a,df) or 6 months to 13.5 months of age (gk); to J20 mice from 3 months to 6 months of age (b); and to WT mice from 12 months to 20 months of age (c,lo). In ae, data were normalized to CTRL. In ae, hk and mo, box plots show individual values, median (line), box limits (25th and 75th percentiles) and whiskers (minimum to maximum). In g and l, data are mean ± s.e.m. P values were calculated by two-tailed unpaired t-test (ae, hk, mo) or mixed-effects models with Šídák’s post-hoc test (g,l); selected P values shown. No significant differences were detected in l. Scale bars, all 25 μm. a, CTRL n = 17, DEF n = 10; b, CTRL n = 7, DEF n = 6; d, CTRL n = 10, DEF n = 9; e, n = 10 per group; gi, CTRL n = 16, DEF n = 22; j, CTRL n = 27, DEF n = 17; k, CTRL n = 13 (left), n = 14 (right); DEF n = 11; lm, CTRL n = 25, DEF n = 34; n, CTRL n = 25, DEF n = 33; o, CTRL n = 39, DEF n = 28. Source Data
Fig. 3
Fig. 3. Cell-type-specific regulation of gene expression by endogenous lithium.
a, Uniform manifold approximation and projection (UMAP) plots of nuclei from snRNA-seq of hippocampi from 12-month-old 3xTg mice fed Li-deficient (DEF, n = 5) or control (CTRL, n = 4) diets for 5 weeks, coloured by cell type. b, Number of DEGs per cell type, stratified by directionality. c, GO analysis of DEGs showing enriched downregulated (blue) and upregulated (red) pathways. d, Heatmap showing the expression changes (log2FC) for selected DEGs across cell types. FC, fold change. e, Overlap of DEGs associated with Li deficiency and human AD pathology. DEGs from snRNA-seq of 3xTg mice on a DEF diet were overlapped with DEGs from snRNA-seq of human biopsy samples with Aβ or Aβ/tau pathology. Shown is the significance level (−log10Padj) for the overlap of upregulated and downregulated DEGs in each cell type, calculated using Fisher’s exact test and corrected for multiple comparisons across cell types and gene directions using the Benjamini–Hochberg method. fj, Synaptic and structural alterations in 3xTg mice fed CTRL or DEF diets from 6–12 (f) or 6–15 (gj) months of age. Golgi labelling and spine density quantification in cortex and hippocampal CA1 (f). Immunolabelling and quantification of synaptophysin (SYP; g) and PSD-95 (h) in the hippocampal CA1 region; IF, immunofluorescence. Immunolabelling and quantification of myelin (fluoromyelin; i), oligodendrocyte (Asp-acylase, aspartoacylase; j) and axon (SMI-312; j) densities in the corpus callosum. In fj, box plots show individual values, median (line), box limits (25th and 75th percentiles) and whiskers (minimum and maximum). In gj, data are normalized to the CTRL group means. In fj, P values were calculated by two-tailed unpaired t-tests. Scale bars: 5 μm (f) and 25 μm (gj). f,h, n = 8 per group; g, CTRL n = 8, DEF n = 9; i, n = 7 per group; j, CTRL n = 8, DEF n = 6. Ast, astrocytes; End, endothelial cells; Exc, excitatory neurons; GC, granule cells; Inh, inhibitory neurons; Mic, microglia; Olig, oligodendrocytes. Source Data
Fig. 4
Fig. 4. Lithium deficiency activates microglia and impairs Aβ clearance.
a, GO analysis of DEGs shared between Li-deficient (DEF) 3xTg (treatment from 5 to 9 months of age; n = 4 mice per group) and wild-type (WT; treatment from 12 to 20 months of age; n = 4 per group) microglia. b,c, 3xTg mice were fed a DEF or CTRL diet for either 5 weeks (starting at 10.8 months of age; n = 8 per group) or 9 months (starting at 6 months of age; n = 7 per group). Immunolabelling (b, left) of total (Iba1) and activated (CD68) microglia in the hippocampus (9-month treatment). Quantification of CD68+ cell density (b, right) and GPNMB and LPL microglial expression (c) in the hippocampus. d, Cytokine levels in culture medium of primary cortical microglia isolated from WT mice on CTRL or DEF diets from 12 to 18 months of age (n = 3 per group), after stimulation with 50 ng ml−1 LPS. Signals were normalized to internal controls from the cytokine array. Data are mean ± s.d. a.u., arbitrary units. e, Aβ42 uptake (left) and degradation (right) by primary cortical microglia isolated from 18-month-old WT mice after 6 months on CTRL or DEF diets (n = 3 per group). f, Immunolabelling (left) and quantification (right) of GSK3β in Iba1+ microglia in the hippocampus of 3xTg mice after 9 months on CTRL or DEF diets (n = 7 per group). g, Aβ42 uptake (left) and degradation (right) by primary microglia isolated from WT mice fed CTRL or DEF diets from 12 to 16 months of age, and then incubated in culture with the GSK3β inhibitors CHIR99021 (CH) or PF-04802367 (PF) (n = 6 biological replicates per group). In bg, data were normalized to the mean of CTRL groups. In b,c,eg, box plots show individual values, median (line), box limits (25th and 75th percentiles) and whiskers (minimum and maximum). P values calculated by unpaired two-tailed t-tests (af) or two-way ANOVA with Tukey’s post-hoc test (g). Scale bars, 20 μm. Source Data
Fig. 5
Fig. 5. Therapeutic efficacy of a plaque-evading lithium salt.
a, Organic Li salt solutions exhibit lower conductivity than inorganic Li salts. All solutions contained 430 µEq l−1 Li. b,c, Li binds to human Aβ1–42 fibrils (b) and oligomers (c). Binding curves are shown for all tested concentrations (b, left) and the 0–30 µEq l−1 range (b, right). LiC shows higher affinity than LiO (EC50 values and 95% confidence intervals are in Supplementary Table 13). d, Immunolabelling of Aβ and pSer202-tau in the hippocampus (left) and quantification of plaque burden (middle) and pSer202-tau+ cell density (right) in 3xTg mice treated with LiO or LiC (4.3 µEq l−1) from 9 to 18 months of age (vehicle n = 3, LiC n = 11, LiO n = 13). e, Aβ immunolabelling (left) and quantification (right) in J20 mice treated with LiO (4.3 µEq l−1) from 17 to 22 months of age (water n = 9, LiO n = 11). f, GO analysis of DEGs from RNA-seq analysis of the hippocampus of 3xTg mice treated with LiO (4.3 µEq l−1) or vehicle from 6 to 12 months of age (n = 9 per group). g, Memory retrieval in the Morris water maze for 3xTg mice treated from 5 to 12 months of age; WT mice (12 months) served as controls. WT n = 16, 3xTg n = 25, LiO 4.3 n = 17, LiO 430 n = 16 (left), n = 15 (right), LiC n = 10, NaO n = 9. In d,e, data were normalized to the mean for the water vehicle. In ac, mean ± s.d. values are shown from n = 3 independent solution replicates (a) or n = 3 biological replicates (b,c). In d,e,g, box plots show individual values, median (line), box limits (25th and 75th percentiles) and whiskers (minimum and maximum). In d,e, P values were calculated by one-way ANOVA with Tukey’s post-hoc test. In g, WT and 3xTg (water) groups were compared using a preplanned unpaired two-tailed t-test; all other P values were derived from one-way ANOVA with Dunnett’s post-hoc comparisons to the 3xTg (water) control. Scale bars, 50 μm. Source Data
Extended Data Fig. 1
Extended Data Fig. 1. Analysis of brain and serum lithium levels.
a-c Li cortex-to-serum ratio in the cerebellum (a), total Li levels in the cerebellum (b), and serum Li levels (c) are not significantly different in NCI, MCI, and AD. a, n = 125 NCI, n = 55 MCI and n = 101 AD cases. b, n = 129 NCI, n = 58 MCI and n = 102 AD cases. c, n = 141 NCI, n = 62 MCI and n = 101 AD cases. d, Lithium is concentrated in Aβ plaques in AD mice. Aβ immunolabeling in the cortex of 12-month-old J20 mice. Laser ablation ICP-MS was performed on an adjacent unfixed section to quantify Li in Aβ plaques (P; white circles) and in neighboring non-plaque regions (NP; yellow circles). The ratios of Li levels in P to NP regions are shown (right) for n = 4 mice. e, Aβ immunolabeling of the cortex in J20 mice at 3 months of age, prior to onset of Aβ deposition, and 12 months of age, following widespread Aβ deposition. Cortical samples were subfractionated from 3-month-old (WT n = 6; J20 n = 7) and 12-month-old (WT n = 9, J20 n = 7) mice and Li in non-plaque fractions was measured by ICP-MS (middle and right panels). The data was normalized to the mean of WT. Box plots show individual values, median (line), box limits (25th-75th percentiles), and whiskers (min-max). P-values by one-way ANOVA with Tukey’s post-hoc test (a-c) or two-tailed unpaired t-tests (d,e). Scale bars, 50 μm. Source Data
Extended Data Fig. 2
Extended Data Fig. 2. Lithium deficiency does not impair exploratory behavior or motor function in mice.
a–c, Li levels measured by ICP-MS in serum (a) and cortex (b) of 15-month-old 3xTg mice, and in cortex of 20-month-old WT mice (c) fed CTRL or DEF diets (n = 5 per group). d, Amyloid plaque burden in the hippocampus of 12-month-old 3xTg mice after 5 weeks of CTRL or DEF diet (n = 7 per group). e, Aβx-40 and Aβx-42 levels in the hippocampus of 26-month-old WT mice (treated from 12–26 months of age; CTRL n = 7; DEF n = 6), normalized to total protein. f, Immunofluorescence for pSer202-tau (CP13) in CA1 of 12-month-old 3xTg mice after 5 weeks of CTRL or DEF diet (n = 7 per group). g, pSer202-tau pathology in 15-month-old 3xTg mice fed either standard PicoLab® Rodent Diet 20 (CTRL 5053, n = 7) or a chemically-defined control diet (CTRL AIN-93M, n = 10), compared to those on Li-deficient chemically-defined AIN-93M diet (n = 9) for 9 months. h–l, Behavioral testing of 3xTg mice fed CTRL or DEF diets from 6–13.5 months of age: Open field activity (h–j), Morris water maze swim speed (k), and latency to reach a visible platform elevated above water level (l). m–q, Behavioral testing of 20-month-old WT mice fed CTRL or DEF diets from 12–20 months of age: Open field activity (m–o), swim speed (p), and latency to reach a visible platform (q). a–g, Data normalized to CTRL group means. l,q, Data are the mean ± s.e.m. a-k,m-p, Box plots show individual values, median (line), box limits (25th-75th percentiles), and whiskers (min-max). P-values by unpaired two-tailed t-test, except g (one-way ANOVA with Tukey’s post-hoc test). h-l, n = 16 CTRL. h, j-l, n = 21 DEF. i, n = 20 DEF. m-o, n = 33 CTRL, n = 43 DEF. p,q, n = 25 CTRL, n = 34 DEF. Source Data
Extended Data Fig. 3
Extended Data Fig. 3. Li deficiency results in loss of dendritic spines, axons and oligodendrocytes.
a, Golgi staining and quantification (right) of dendritic spine density in hippocampus CA1 (middle) and CA3 (right) subdomains of WT mice fed Li-deficient (DEF) or CTRL diets from 12–24 months of age (n = 8 mice per group). b, Golgi staining and quantification of spine density (right) in the hippocampus CA1 of 12-month-old 3xTg mice after 5 weeks of CTRL or DEF diet (n = 8 mice/group) for 5 weeks. c, Immunolabeling and quantification (right) of mature oligodendrocytes (marker Aspartoacylase) and axons (marker SMI-312) in the corpus callosum of WT mice treated from 12–24 months of age (CTRL n = 8; DEF n = 6). d, Immunolabeling of OPCs (marker PDGFRα) in the hippocampus of 3xTg mice treated with CTRL and DEF diets from 6–15 months of age and quantification of OPC density (n = 7 per group). e, Lithium deficiency impairs myelin integrity. Transmission electron microscopy (left panel) showing structural abnormalities in the myelin of the corpus callosum of Li-deficient 3xTg mice (treatment from 6–12 months). Violin plots show g-ratios (middle) and myelin sheath thickness (right) for individual axons (CTRL n = 1,376; DEF n = 1,396; pooled from n = 8 mice per group). a-d, Box plots show individual values, median (line), box limits (25th-75th percentiles), and whiskers (min-max). c,d, The data was normalized to the mean of CTRL groups. a-e, P-values by unpaired two-tailed t-tests. Scale bars, 5 μm (a,b) or 25 μm (c, d). Source Data
Extended Data Fig. 4
Extended Data Fig. 4. Lithium deficiency and Wnt/β-catenin signaling.
a, Pathways associated with Li deficiency in WT microglia. Wnt/β-catenin/TCF signaling is among the most significantly enriched signaling pathways and is predicted to be inhibited (predicted activation and inhibition are depicted as orange and blue, respectively). b,c, Functional network diagrams of Wnt/β-catenin/TCF signaling in Li-deficient WT and 3xTg microglia (b), and in excitatory neurons (c, left panel) and oligodendrocytes (c, right panel) from Li-deficient 3xTg mice. In each network, associated DEGs (FDR < 0.05) are highlighted in red (upregulated) or green (downregulated). In a, color intensity reflects z-score strength. Analysis was performed using the Ingenuity Pathway Analysis (IPA) platform. False discovery rate (FDR) was determined using a one-sided Fisher’s exact test followed by Benjamini-Hochberg correction for multiple comparisons. Source Data
Extended Data Fig. 5
Extended Data Fig. 5. Regulation of GSK3β and β-catenin by endogenous lithium.
a-d, Immunolabeling and quantification of nuclear β-catenin in hippocampal CA1 neurons (a, b), corpus callosum oligodendrocytes (c), and microglia (d), co-labeled for MAP2, aspartoacylase (Asp-Acl), and Iba1, respectively. Additional β-catenin quantification shown for CA1 neurons after 5 weeks of DEF diet (a, middle). WT mice fed CTRL or DEF diets from 12–24 months of age shown in b. e,f, Immunolabeling (e, CA1 neurons) and quantification (e, right panel; f) of total GSK3β levels in CA1 neurons (e, MAP2 co-labeling) and oligodendrocytes (f, Aspartoacylase co-labeling) in 15-month-old 3xTg mice. g, Gsk3b mRNA in hippocampus of 12-month-old 3xTg mice was measured by qRT-PCR and normalized to Gapdh. h,i, pTyr216-GSK3β immunolabeling (h, 3xTg CA1 neurons) and quantification (h, middle and right panels; i) in CA1 neurons (h, MAP2 co-labeling) and oligodendrocytes (i, Aspartoacylase co-labeling) of 15-month-old 3xTg (h, middle; i, left) and 24-month-old WT (h, right; i, right) mice on CTRL or DEF diets. j,k, Immunolabeling of pSer9-GSK3β (j, left) and quantification of absolute (j, right) and relative (k) levels of inhibitory pSer9-GSK3β in the hippocampal CA1 region of 15-month-old 3xTg mice. l, Inositol levels measured by mass spectrometry in the hippocampus of 15-month-old 3xTg mice. 3xTg mice were fed CTRL or DEF diets for 9 months (from 6–15 months of age: a, left and right; c, d-f, h-l) or 5 weeks (from 10.85–12 months of age: a, middle; g). WT mice were treated from 12–24 months of age (b; h, right; i, right). Box plots show individual values, median (line), box limits (25th-75th percentiles), and whiskers (min-max). Data was normalized to CTRL group means. P-values by unpaired two-tailed t-test. WT CTRL n = 8, DEF n = 6. 3xTg CTRL (n = 6 in l, n = 7 in a, middle, d-f,j,k; n = 8 in a, right and c,g-i), 3xTg DEF (n = 6 in l, n = 7 in a, middle and d-f,j,k; n = 8 in g; n = 9 in a, right, and c,h,i). Scale bars, 25 μm. Source Data
Extended Data Fig. 6
Extended Data Fig. 6. Inhibition of GSK3β rescues Li deficiency.
12-month-old 3xTg mice, maintained on Li-deficient (DEF) or CTRL diets for 3 months, received CHIR99021 (CHIR; 50 mg/kg body weight, intraperitoneally) or vehicle, once daily for 14 days. a, Immunolabeling and quantification (right) of CD68+/Iba1+ microglia density in the hippocampus. b, Cytokine and chemokine levels in the hippocampus (n = 3 mice per group), normalized to the mean of CTRL/Vehicle group. Means ± s.d. shown. c, Aβ immunolabeling and quantification (right) of plaque burden in the hippocampus. d, Phospho-Ser202-tau (CP13 antibody) labeling and quantification (right) of CP13+ cell density in the hippocampus CA1 region. e, Immunolabeling of oligodendrocytes (Aspartoacylase+) and myelin basic protein (MBP) labeling of myelin in the corpus callosum with quantification (middle and right) of oligodendrocyte density and MBP immunofluorescence (IF) intensity. a,c-e, Box plots show individual values, median (line), box limits (25th-75th percentiles), and whiskers (min-max). Data was normalized to CTRL/Vehicle and analyzed by two-way ANOVA with Tukey’s post hoc (a,c-e) or two-tailed unpaired t-test (b); p-values indicated. Sample sizes: CTRL/Vehicle n = 6 (a,c,d), n = 7 (e); CTRL/CHIR99021, DEF/Vehicle n = 7 (a,ce); DEF/CHIR99021 n = 6 (a,ce). Scale bars, 25 μm. Source Data
Extended Data Fig. 7
Extended Data Fig. 7. Lithium orotate exhibits reduced conductivity and Aβ binding compared to lithium carbonate.
a, Organic Li salts show reduced conductivity relative to inorganic Li salts. Solution conductivities are shown for Li concentrations of 4.3 mEq/L (left panel), 43 µEq/L (middle panel), and 21.5 µEq/L (right panel). P-values by unpaired two-tailed t-tests comparing organic versus inorganic salts. b, Binding of LiO and LiC to Aβ42 oligomers across a concentration range of 0–500 µEq/L Li. c,d, LiO exhibits less sequestration in Aβ plaques than LiC. The plaque to non-plaque (P/NP) Li ratios were quantified by laser ablation ICP-MS in 18-month-old 3xTg (c) and J20 (d) mice treated with LiO or LiC (4.3 µEq Li/L) for 7 days. 3xTg/LiC n = 7, 3xTg/LiO n = 8; J20/LiC n = 4 J20/LiO n = 4. e,f, Treatment with LiO achieves higher Li levels in non-plaque fractions relative to tratment with LiC. Subfractionation of the hippocampus was performed in 18-month-old J20 (e) and 3xTg (f) mice that were administered LiO or LiC (4.3 µEq Li/L) for 7 days. Age-matched WT mice without Aβ deposition served as controls. e, WT n = 8, J20 n = 8, J20/LiC n = 6, J20/LiO n = 7. f, WT n = 12, 3xTg n = 9, 3xTg/LiC n = 7, 3xTg/LiO n = 8. a,b, Shown are means ± s.d. for n = 3 independent solution replicates (a) or n = 3 biological replicates (b). c-f, Box plots show individual values, median (line), box limits (25th-75th percentiles), and whiskers (min-max). Data was normalized to the mean of NP (c,d) or WT (e,f). P-values by unpaired two-tailed t-tests (a,c,d; pre-planned comparisons: WT vs. J20 in e; and WT vs 3xTg in f) or one-way ANOVA with Tukey’s post-hoc test (e,f). Source Data
Extended Data Fig. 8
Extended Data Fig. 8. Suppression of AD patholog by lithium orotate.
a,b, Immunolabeling of Aβ (a) and pSer202-tau (p-tau/CP13, b) and quantification of Aβ plaque burden (a, right) and CP13+ cell density (b, right) in the hippocampus of 3xTg mice treated with the indicated concentrations of LiO, LiC, NaO or vehicle (water) from 5–12 months of age. c, Immunolabeling and quantification (right) of postsynaptic PSD-95 in hippocampus CA1 of 3xTg mice administered LiO or LiC (4.3 µEq/L), or vehicle from 9–18 months of age. d,e, Immunolabeling of myelin basic protein (MBP) (d) and oligodendrocytes (Aspartoacylase labeling) and quantifications of MBP expression (d, right) and oligodendrocyte density (e, right) in the corpus callosum of 3xTg mice. f,g, Quantification of Iba1+ microglia (f) and GFAP+ astrocyte (g) densities in the hippocampus of 18-month-old 3xTg mice treated with LiO or LiC (4.3 µEq/L) or vehicle from 9–18 months of age. Box plots show individual values, median (line), box limits (25th-75th percentiles), and whiskers (min-max). a-g, Data was normalized to the vehicle group means and analyzed by one-way ANOVA with Tukey’s post-hoc test. Scale bars, 25 μm. a,b, vehicle n = 17, LiO 4.3 n = 17, LiO 43 n = 8, LiO 430 n = 15, LiC 430 n = 10, NaO 4.3 n = 8, NaO 430 n = 6. c-g, water n = 4 (c), n = 6 (d-f), n = 7 (g); LiC n = 8, LiO n = 8. Source Data
Extended Data Fig. 9
Extended Data Fig. 9. Lithium orotate suppresses GSK3β activity.
a-d, Treatment with LiO broadly reduces both total and activated GSK3β. 3xTg mice were treated from 9–18 months of age with LiO, LiC (4.3 µEq/L), or vehicle (water). a,c,d, Left panels show representative immunolabeling of total GSK3β (a), pTyr216-GSK3β (c), and nuclear β-catenin (d) in hippocampal CA1 neurons double-labeled for MAP2. Nuclei were labeled with DAPI (d). a,c,d, Right panels show quantification of total GSK3β, pTyr216-GSK3β and nuclear β-catenin in hippocampal CA1 neurons. b, Quantification of total GSK3β in corpus callosum oligodendrocytes (double-labeled for GSK3β and Aspartoacylase). a-d, Box plots show individual values, median (line), box limits (25th-75th percentiles), and whiskers (min-max). Data was analyzed by one-way ANOVA with Tukey’s post-hoc test; P-values are shown. water n = 6, LiO n = 8, LiC n = 8. Scale bars, 50 µm. Source Data
Extended Data Fig. 10
Extended Data Fig. 10. Lithium orotate restores spatial memory in J20 mice with advanced amyloid pathology.
a, Time course of spatial learning in the Morris water maze for J20 mice administered LiO (4.3 µEq/L) or vehicle (water) from 17–22 months of age. Shown are means ± S.E.M. b,c, Memory retrieval in the probe trial of the Morris water maze. Shown is the number of entries and time spent in the target area (b), and the latency to reach the target area (c). d,e, Swim speed and the latency to find a visible platform. f-h, LiO does not affect exploratory behavior in the open field test. Shown is distance travelled, distance traveled in the center of the arena, and the speed in the open field. b-h, Box plots show individual values, median (line), box limits (25th-75th percentiles), and whiskers (min-max). a, Learning data were analyzed using mixed-effects models with repeated measures, followed by Šídák’s post-hoc test. b-h, P-values by two-tailed unpaired Mann Whitney U test (b) or two-tailed unpaired t-tests (c-h). e, no significant differences were found. Vehicle n = 8 (b, left; c), n = 9 (a, b right, d-h); LiO n = 10 (a-e,g), n = 11 (f,h). Source Data
Extended Data Fig. 11
Extended Data Fig. 11. Lithium orotate prevents age-related neuroinflammation.
a,b, LiO prevents age-related neuroinflammatory changes in the hippocampal CA1 and CA3 regions, cortex, and corpus callosum of WT mice. Top panels: Microglia (a, Iba1 labeling) and astrocytes (b, GFAP labeling) were immunolabeled in 6-month-old WT mice (adult), 24-month-old WT mice (aged), and 24-month-old WT mice administered LiO (4.3 µEq/L) from 12–24 months of age (Aged/LiO). Bottom panels: Quantification of Iba1- (a) and GFAP-positive (b) cell densities. DAPI labeled cell nuclei. Box plots show individual values, median (line), box limits (25th-75th percentiles), and whiskers (min-max). The data was analyzed by two-way ANOVA with Tukey’s post-hoc test and the P-values for comparisons are indicated. n = 7 mice/group, except in panel b (cortex: adult n = 5). Scale bars, 25 µm. Source Data
Extended Data Fig. 12
Extended Data Fig. 12. Lithium orotate promotes microglial clearance of Aβ.
a, LiO reverses age-related elevation of the proinflammatory cytokines IL-6 and IL-1β. Adult n = 4, Aged n = 6, Aged/LiO n = 6. b, LiO rescues the ability of aged microglia to clear Aβ. Left panel: Uptake of fluorophore-labeled human Aβ42 (red) by Iba1+ microglia (green). Right: Quantification of uptake and clearance. Microglia from 6-month-old WT controls (adult) were also analyzed. To assess Aβ42 uptake, microglia were incubated for 3 hr with Aβ42-containing medium. After the 3 hr preincubation, the medium was replaced with Aβ42-free medium and cells were incubated for an additional 3 hr to assess Aβ42 clearance. Microglia were purified from n = 6 mice per group. c-e LiO promotes microglial uptake and degradation of Aβ42. BV2 cells were pre-treated with 20-500 µM LiO or NaO for 6 hr, then incubated for 3 hr with fluorophore-labeled human Aβ42 in the continued presence of the respective compound. c, Shown is Aβ42 (red) and phalloidin (green) labeling. d,e Quantification of Aβ42 uptake (d) and clearance (e). Water n = 4, LiO n = 4, NaO n = 3 biological replicates. The LiO and NaO concentrations (20–500) were in µM. The data was normalized to the mean of adult controls (b, left) or water vehicle (d). a,b, Box plots show individual values, median (line), box limits (25th-75th percentiles), and whiskers (min-max). d,e, Shown are individual values, as well as means ± S.E.M. Data was analyzed by one-way (d,e) or two-way (a,b) ANOVA with Tukey’s (a), Šídák’s (b) or Dunnett’s (d,e) post-hoc tests and P-values are indicated. d,e, P-values are for comparisons to the water control. Scale bars, 15 μm. Source Data
Extended Data Fig. 13
Extended Data Fig. 13. Lithium and cognitive resilience during aging.
a-e LiO prevents age-related cognitive decline in WT mice. WT mice were treated with LiO (4.3 µEq/L) or vehicle from 12–24 months of age and then assessed behaviorally, together with 6-month-old WT mice (adult). a, Time course of spatial learning in the Morris water maze. b, Spatial memory was assessed in the probe trial of the Morris water maze. Shown are entries and time spent in the target area. c-d, Administration of LiO does not affect the latency to find a visible platform (c) or swim speed (d) in the Morris water maze. e, LiO restores the ability of aged WT mice to recognize a novel object. Shown is the discrimination index for identical objects (left) and for a novel object (right). a,c, Shown are means ± S.E.M. b,d,e, Box plots show individual values, median (line), box limits (25th-75th percentiles), and whiskers (min-max). a-e, Adult n = 18; Aged n = 14 (d,e) n = 15 (a-c); Aged/LiO n = 15 (d,e), n = 16 (a-c). a,c, Data was analyzed using mixed-effects models with repeated measures, followed by Tukey’s post-hoc test. b,d,e, Data was analyzed by two-way ANOVA with Tukey’s post-hoc test. a, shown are adjusted P-values for comparisons between Aged/LiO vs. Aged. c, No significant differences were seen between the 3 groups. f, Linear regression curves between cortical Li cortex-to-serum ratios and expression of cortical Complexin 1 (ROSMAP variable: synap_3cort_complex1), Complexin 2 (ROSMAP variable: synap_3cort_complex2), as well as a measure of mean Complexin1/2 expression in 3 brain regions (mid-cortex, inferior temporal cortex, and hippocampus; (ROSMAP variable: zcomplexin_3cort) for n = 47 aged cases with no cognitive impairment (NCI). Pearson correlation coefficients (r) and P-values are indicated. Source Data

References

    1. James, B. D. & Bennett, D. A. Causes and patterns of dementia: an update in the era of redefining Alzheimer’s disease. Annu. Rev. Public Health40, 65–84 (2019). - PubMed
    1. Sperling, R., Mormino, E. & Johnson, K. The evolution of preclinical Alzheimer’s disease: implications for prevention trials. Neuron84, 608–622 (2014). - PMC - PubMed
    1. De Strooper, B. & Karran, E. The cellular phase of Alzheimer’s disease. Cell164, 603–615 (2016). - PubMed
    1. Murdock, M. H. & Tsai, L.-H. Insights into Alzheimer’s disease from single-cell genomic approaches. Nat. Neurosci.26, 181–195 (2023). - PMC - PubMed
    1. Mathys, H. et al. Single-cell multiregion dissection of Alzheimer’s disease. Nature10.1038/s41586-024-07606-7 (2024). - PubMed

MeSH terms