. 2025 Oct;646(8084):378-383.
doi: 10.1038/s41586-025-09348-6. Epub 2025 Aug 6.

Hominins on Sulawesi during the Early Pleistocene

Affiliations

Hominins on Sulawesi during the Early Pleistocene

Budianto Hakim et al. Nature. 2025 Oct.

Abstract

The dispersal of archaic hominins beyond mainland Southeast Asia (Sunda)1 represents the earliest evidence for humans crossing ocean barriers to reach isolated landmasses2-4. Previously, the oldest indication of hominins in Wallacea, the oceanic island zone east of Sunda, comprised flaked stone artefacts deposited at least 1.02 ± 0.02 million years ago (Ma) at Wolo Sege on Flores5. Early hominins were also established on the oceanic island of Luzon (Philippines), as indicated by both stone artefacts and cut marks on faunal remains dating to between 777 and 631 thousand years ago (ka) at Kalinga6. Moreover, fossils of extinct, small-bodied hominins occur on Flores (Homo floresiensis)7-12 and Luzon (Homo luzonensis)13. On Sulawesi, the largest Wallacean island, previous excavations revealed stone artefacts with a minimum age of 194 ka at the open site of Talepu in the Walanae Depression14, long preceding the earliest known presence of modern humans (Homo sapiens) in the region (73-63 ka in Sunda)15. Here we show that stone artefacts also occur at the nearby site of Calio in fossiliferous layers dated to at least 1.04 Ma and possibly up to 1.48 Ma, using palaeomagnetic dating of sedimentary rocks and coupled Uranium-series (U-series) and electron-spin resonance (US-ESR) dating of fossil teeth. The discovery of Early Pleistocene artefacts at Calio suggests that Sulawesi was populated by hominins at around the same time as Flores, if not earlier.


Conflict of interest statement

Competing interests: The authors declare no competing interests.

Figures

Fig. 1
Fig. 1. Map of the study area.
a, The location of Sulawesi within the Wallacean archipelago (Wallacea)—the zone of oceanic islands between the Asian and Australian continental regions (Sunda and Sahul, respectively). MSL, mean sea level. b, The southwestern peninsula of Sulawesi, showing the locations of the Talepu (1) and Calio (2) sites on opposite sides of the Walanae River. Sources of map data: General bathymetric maps (https://www.gebco.net/data_and_products/gridded_bathymetry_data/); DEMNAS Badan Informasi Geospasial (https://tanahair.indonesia.go.id/demnas/#/demnas).
Fig. 2
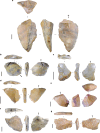
Fig. 2. Stone artefacts recovered from Early Pleistocene deposits at Calio.
a, Artefact 1: a large chert flake discovered partially exposed on the surface in a heavily cemented conglomerate. A black linear mineral stain marks the boundary between the exposed part of the flake and the portion embedded in the sandstone. b, Artefact 2: a medium-sized retouched flake struck from a core made from brecciated chert. The arrows indicate the direction of retouch scars across the dorsal face. c, Artefact 3: a small flake struck from a water-rolled chert cobble. d, Artefact 4: a small flake with moderate taphonomic (that is, non-cultural) flaking to both faces (it is broken diagonally). e, Artefact 5: the proximal end of a large flake broken by weathering. f, Artefact 6: a medium-sized redirecting flake struck onto a relatively flat cortical surface of a water-worn chert cobble. g, Artefact 7: a heavily abraded flake with moderate to heavy taphonomic flaking to both faces. Scale bars, 10 mm.
Fig. 3
Fig. 3. Plan and stratigraphic sections of the Calio excavation.
Layer 1 is a dark brown topsoil with a sandy clay texture (maximum thickness of >40 cm in B1U3). Layer 2 is a grey conglomerate rock composed of tightly cemented sand and gravel containing various rock types, along with stone artefacts and extinct fossil fauna. This conglomerate layer covers almost the entire surface of the excavation units, except for squares B1U5 and B1U6. Layers 3a and 3b share similarities in both colour and texture, consisting of brown, dark brown and yellowish-brown sandy gravel layers with tabular cross-bedding, but moderately cemented. Layer 4 is similar to layer 2, a conglomerate sediment, but it is only found in a few excavation units, particularly squares B1U6 and B1U2. This layer has a thickness of only about 5–10 cm and appears discontinuous, reappearing in other units, giving it an intercalated appearance. Layer 5a is dark brown with a sandy gravel texture. At the base of this layer, layer 5b consists of yellowish-brown sandy intercalations, contrasting in colour with the overlying layer but sharing the same sandy gravel texture. Layer 5c has a thickness of only 2–12 cm. At the base of layer 5b there is a layer resembling the conglomerate with similar characteristics, but it was not further excavated due to its extreme hardness. The deepest stone artefact (artefact 6; A6) was excavated from layer 3b at a depth of 56 cm in square B1U2. F1, the Celebochoerus maxilla dated using US–ESR.
Fig. 4
Fig. 4. The stratigraphic and palaeomagnetic context of the Calio site.
Paleomagnetic results plotted along the stratigraphy of the Calio excavation site and Beru-Bulu Carulle test-pit 335 m to the east, as well as adjacent outcrops along the main road in the vicinity of Beru-Bulu Carulle (Extended Data Fig. 1d). The zero-elevation reference level is the datum used at the Calio excavation site. Four samples taken within a stratigraphic interval of 12 m all returned reverse (R) magnetic polarities. One sample (Sp4) was broken in transit and could not be analysed further. MAD, mean angular deviation; NA, not available. The horizontal error bars indicate the 95% confidence limit of the mean directions (α95) (Extended Data Table 2).
Extended Data Fig. 1
Extended Data Fig. 1. Geological and stratigraphic context of the Calio site.
a, Digital Elevation Map of the southwestern peninsula of Sulawesi and b, Simplified geological map of the same area. Small red square indicates area shown in c, geological map of the study area. 1: Modern alluvium; 2: Late Pleistocene alluvial terrace; 3-7: Lithological sub-units of the Walanae Formation (3: Beru Member Sub-Unit B [fluvial facies]; 4: Beru Member Sub-Unit A [fluvio-estuarine facies]; 5: Samaoling Member [shallow marine facies]; 6: Burecing Member [deep marine facies]; 7: Tacipi Limestone Member); 8: strike and dip; 9: horizontal bedding; 10: inferred fault; 11: sites with surface collected stone artefacts; 12: sites with in situ stone artefacts; 13: vertebrate fossil localities. Rectangle indicates the area surrounding Calio shown in d, contour map of the Calio excavation area showing the palaeomagnetic sampling sites (red circles). The stratigraphic section shown in Extended Data Fig. 5 was measured along the main road. Green dashed lines connect the sampling sites with the measured section, taking into account topography and strike and dip. Panels a-c modified after ref. .
Extended Data Fig. 2
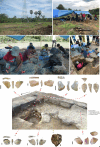
Extended Data Fig. 2. Calio archaeological site.
a, Location of the fossil- and stone artefact-bearing fluviatile pebbly sandstone strata outcropping at the ground surface in an agricultural field; b-d, Archaeological excavations at Calio (2022); e, 3D photogrammetry model of the excavated squares showing the locations of the stone artefacts and dated Celebochoerus fossil (F1) projected onto the stratigraphy (scale bars, 10 mm). Layers 1 to 5b are labelled. The deepest stone artefact excavated at Calio (Artefact 6) was found 56 cm below the ground surface in layer 3b. Agisoft Metashape Professional was used to produce the 3D image and the finds were projected onto this model using ArcGIS Pro.
Extended Data Fig. 3
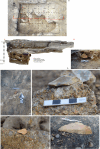
Extended Data Fig. 3. Stone artefacts in Early Pleistocene deposits at Calio.
a, Overhead view of the Calio trench showing the locations of the stone artefacts and the dated fossil specimen (F1); b, 3D photogrammetry model of the trench (section A to B in panel a) with archaeological finds projected and sedimentary layers indicated (layers 1-5b) (Agisoft Metashape Professional was used to produce the 3D image and the finds were projected onto this model using ArcGIS Pro); c, The stratigraphically deepest stone artefact excavated from the site (Artefact 6), seen here exposed in layer 3b in the trench wall; d, Artefact 5; e, Artefact 2; f, Artefact 4; g, Artefact 1 exposed on the ground surface partially embedded in extremely hard fluvial sandstone comprising the capping conglomerate (layer 2).
Extended Data Fig. 4
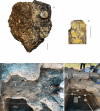
Extended Data Fig. 4. Celebochoerus heekereni fossil maxilla fragment from Calio.
The specimen was embedded in coarse sandstone and retrieved in two separate fitting blocks found in the same location (black arrows in c and d). a, Occlusal view of sinistral P4 and M2; b, Occlusal view of sinistral M3 of the same individual retrieved from the opposite block; c-d, Find location of the dated Celebochoerus fossil maxilla (marked by arrows) in square B1U1 approximately 30 cm below the ground surface. The deepest stone artefact (Artefact 6) was excavated from the adjoining square B1U2 to the north and was located ~26 cm below the level of the fossil.
Extended Data Fig. 5
Extended Data Fig. 5. Stratigraphy and palaeomagnetic results of the upper part of the Walanae Formation, including the Calio excavation site.
The stratigraphy is based on the Cabenge-Pampanua road section reported previously. Celebochoerus icons indicate the fluvial deposits that contained vertebrate fossils as described in the prior study and the current paper. The panel to the right shows the paleomagnetic results of 14 samples. The approximate stratigraphic levels of palaeomagnetic samples taken at a distance from the recorded road section are based on extrapolation using the measured strike and dip of 258°/60° (see Extended Data Fig. 1). Sample Sp9 yielded intermediate results. Horizontal error bars indicate the 95% confidence limit of the mean directions (α95) (see Extended Data Table 2). The low sampling density does not allow for a correlation with the geomagnetic polarity time scale; however, the Reverse polarities near Ciangkange (Sp6 and Sp9 to Sp11) likely fall within the Matuyama Chron, because the top of the underlying marine Burecing Member (Sp14) contains nannofossils pertaining to nannoplankton zone CN12, which ranges in age from 3.75 to 1.95 Ma (ref. ). R = Reverse polarity, N = Normal polarity, I = Intermediate polarity. F1 = Celebochoerus fossil maxilla excavated from the Calio site and dated using coupled Uranium-series and Electron Spin Resonance (US-ESR) to a minimum of 1.04 Ma.
Extended Data Fig. 6
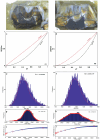
Extended Data Fig. 6. US-ESR dating results for two Celebochoerus fossil teeth at Calio.
a-b, Cross-sections of the two teeth (a, premolar P4; b, molar M3). Uranium uptake model in dental tissues of c, P4 and d, M3. Age distribution likelihood for e, P4 and f, M3. ESR dose equivalent (De) distribution likelihood of g, P4 and h, M3. ESR dose response curve (DRC) calculation using the Monte Carlo algorithm of McDoseE 2.0; i, P4 and j, M3.
Extended Data Fig. 7
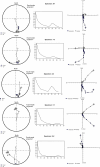
Extended Data Fig. 7. Stepwise AF-demagnetization diagrams and vector end-point diagrams.
Data is provided for five representative subsamples (denoted specimens) from the Calio excavation site and the road section further east. The analysed specimens were taken from palaeomagnetic block samples Sp1, Sp2, Sp6, Sp7 and Sp9. The first sample number indicates the block sample number, whereas the second number refers to subsamples obtained from the block samples (e.g., Specimen 6-1 is the first subsample obtained from palaeomagnetic block sample Sp6). Open circles on the orthogonal projection indicate the vertical component of magnetization and the solid circles the horizontal component. Open circles on the equal area projection diagram indicate an upper hemisphere magnetic direction. Solid circles indicate a lower hemisphere magnetic direction.
Extended Data Fig. 8
Extended Data Fig. 8. Stepwise Thermal demagnetization (TD) diagrams and vector end-point diagrams.
Data is provided for five representative samples from the Calio excavation site and the road section further east. TD-analyzed subsamples (denoted “Specimens”) were taken from palaeomagnetic block samples Sp3, Sp6, Sp7, Sp10, and Sp13 (e.g., Specimen 3-4 denotes subsample 4 from block sample Sp3). Open circles on the orthogonal projection indicate the vertical component of magnetization and the solid circles the horizontal component. Open circles on the equal area projection diagram indicate an upper hemisphere magnetic direction. Solid circles indicate a lower hemisphere magnetic direction.
Extended Data Fig. 9
Extended Data Fig. 9. Virtual Geomagnetic Pole (VGP) plots.
Data is provided for all palaeomagnetism samples from the Calio excavation site and other samples taken along the stratigraphic section. Yellow circles represent the VGP with sample numbers. The red star represents the sample site location.

References

    1. Hanebuth, T. J. J., Voris, H. K., Yokoyama, Y., Saito, Y. & Okuno, J. Formation and fate of sedimentary depocentres on Southeast Asia’s Sunda Shelf over the past sea-level cycle and biogeographic implications. Earth-Sci. Rev.104, 92–110 (2011).
    1. Morwood, M. & van Oosterzee, P. The Discovery of the Hobbit: The Scientific Breakthrough That Changed the Face of Human History (Random House, 2007).
    1. Dennell, R. W., Louys, J., O’Regan, H. J. & Wilkinson, D. M. The origins and persistence of Homo floresiensis on Flores: biogeographical and ecological perspectives. Quat. Sci. Rev.96, 98–107 (2014).
    1. Ruxton, G. D. & Wilkinson, D. M. Population trajectories for accidental versus planned colonisation of islands. J. Hum. Evol.63, 507–511 (2012). - PubMed
    1. Brumm, A. et al. Hominins on Flores, Indonesia, by one million years ago. Nature464, 748–752 (2010). - PubMed

Publication types

LinkOut - more resources