. 2025 Aug 6;11(1):369.
doi: 10.1038/s41420-025-02646-y.

RNA-mediated inhibition of mitochondrial SHMT2 impairs cancer cell proliferation

Affiliations

RNA-mediated inhibition of mitochondrial SHMT2 impairs cancer cell proliferation

Francesca Romana Liberati et al. Cell Death Discov. .

Abstract

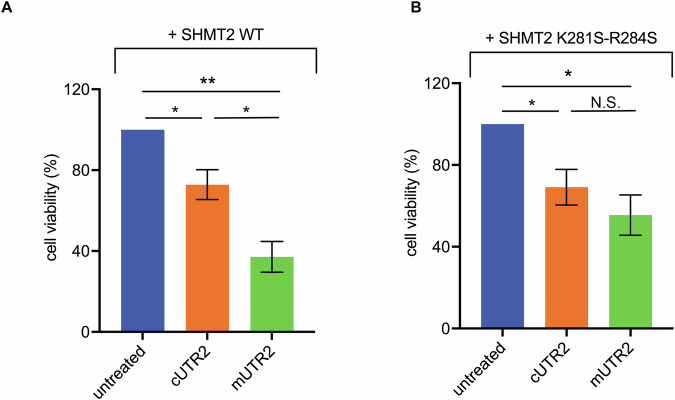
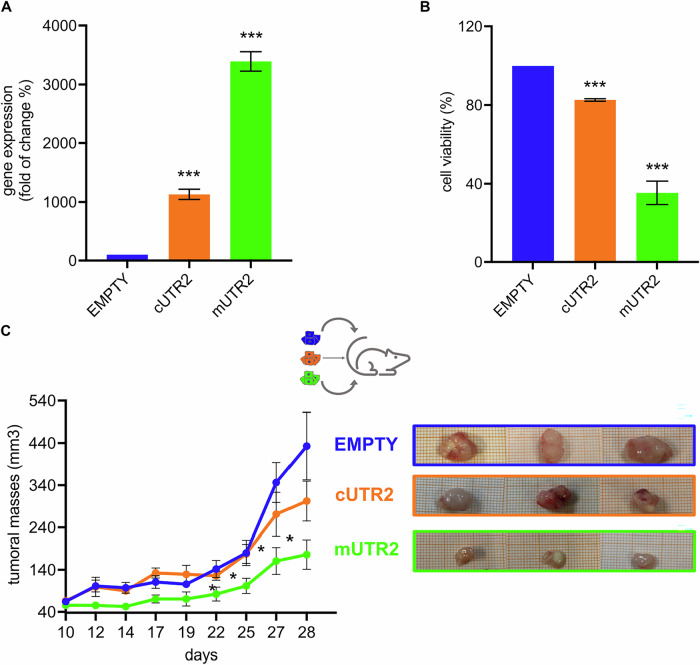
Targeting metabolic reprogramming is crucial for cancer treatment. Recent advances highlight RNA's ability to directly regulate enzyme activity through riboregulation. In this study, we used an RNA-based approach to inhibit the mitochondrial enzyme Serine hydroxymethyltransferase 2 (SHMT2), which lacks a selective in vivo inhibitor. SHMT2, often overexpressed in various cancers, is pivotal in one-carbon metabolism, a pathway vital for cell proliferation. Our results show that RNA effectively inhibits SHMT2's serine-to-glycine conversion in vitro (IC50 = 4.4 ± 0.2 nM). By using a mitochondrial import signal, we successfully delivered the inhibitory RNA into the mitochondria of lung cancer cells, reducing cell viability in vitro and tumor growth in vivo in a xenograft mouse model. These findings suggest that RNA-based strategies could be extended to selectively target other RNA-binding metabolic enzymes, offering potential solutions where small molecule inhibitors fall short or to counteract drug resistance.


Conflict of interest statement

Competing interests: The authors declare no competing interests. Ethics approval and consent to participate: All methods were performed in accordance with the relevant guidelines and regulations. All animal experiments were carried out under the authorization n° 312/2021-PR of the Italian Ministry of Health. Informed consent was not obtained, as this study does not involve patients.

Figures

Fig. 1
Fig. 1. Comparison of SHMT2 expression in lung adenocarcinoma (LUAD) versus normal lung tissues.
Boxplots display SHMT2 mRNA expression levels measured in TCGA samples: LUAD (n = 540, red) and normal (n = 59, blue). The yellow line within each box indicates the median; box limits represent the 25th and 75th percentiles; whiskers extend to 1.5× the interquartile range; open circles denote outliers. A two-tailed Student’s t-test indicates a highly significant increase in SHMT2 expression in LUAD compared to normal tissues (p = 6.5 × 10−84).
Fig. 2
Fig. 2. SHMT2 serine cleavage activity is inhibited by RNA.
A Binding of SHMT2 to UTR2 RNA. EMSA assays with UTR2 RNA and SHMT2 WT. The shift of UTR2 migration indicates that SHMT2 efficiently binds to UTR2 RNA. The apparent Kd of interaction is 0,56 ± 0,05 µM. B SHMT2 activity in the presence of UTR2. SHMT2 Ser-to-Gly reaction using L-serine and THF as substrates was carried out in the presence of increasing amount of UTR2 (red symbols) and the corresponding initial velocity, recorded spectrophotometrically, has been plotted as a function of the RNA yielding an IC50 UTR2 = 4.4 ± 0.2 nM. Error bars indicate standard deviation (SD) (n = 3). Differential effect of UTR2 on the Ser-to-Gly (red) and Gly-to-Ser (green) reaction is also reported. The IC50 of the UTR2 on the serine to glycine reaction is 4.4 ± 0.2 nM, whereas for the glycine to serine conversion the IC50 is 74 times higher (IC50 = 325.4 ± 119,5 nM). Error bars indicate standard deviation (SD) (n = 3). C Structural superposition of SHMT1:RNA complex (pink) and SHMT2 (beige) structures (PDB: 8A11 [22] and 5V7I [17], respectively). Lysine 279 (SHMT1), 281(SHMT2) and Arginine 284 are highlighted. Lysine 279 (SHMT1) lies on the flap motif and interacts with RNA; by superimposing the SHMT2 structure we identified two positive residues (lysine 281 and arginine 284) on the flap motif that might interact with RNA. D EMSA showing SHMT2 K281S-R284S binding to UTR2. The apparent KDapp is 1,6 ± 0,48 µM. E Effect of UTR2 on SHMT2 K281S-R284S catalytic activity. Data have been collected following the same protocol reported for the wild-type protein (red line). All the experimental data, acquired in three independent experiments, were fitted to Eq. 2 (see section “Methods”), obtaining the continuous lines shown in the figure. IC50 for the K281S-R284S mutant is 66.4 ± 3.3 nM, 15 times higher than the one observed for SHMT2 WT. The inset shows the KM for serine and THF and the Kcat of SHMT2 WT and mutant obtained experimentally.
Fig. 3
Fig. 3. RNA-based mitochondrial SHMT2 targeting.
A Scheme of the rationale of the experimental design to localize the UTR2 in different compartments. Untreated lung cancer cell is expected to have a steady-state activity of the two SHMT pools sustaining Serine production in the cytoplasm and Glycine production in the mitochondria, carried out by SHMT1/SHMT2 alpha and SHMT2, respectively (upper panel, green arrows in the cartoon). Two different plasmids expressing UTR2 were produced: cUTR2, with only the UTR2 sequence (magenta blow-up in the Figure), and mUTR2, including an additional 5’ sequence for mitochondrial import (violet in the cartoon in the green blow-up). The additional 20 nt sequence derives from the MRP RNA and it is known to be recognized by the PNPase cargo [24], allowing mitochondrial import of RNAs (lower panel, on the right). We expected cUTR2 to mainly target the Ser-to-Gly reaction carried out by the cytoplasmic pool of SHMTs, thus affecting marginally the Ser/Gly steady-state (lower panel, on the left). On the other hand, mUTR2 should mainly target the mitochondrial SHMT2, where the Ser-to-Gly reaction is prevalent, thus in principle affecting more dramatically the Ser/Gly steady-state (lower panel, on the right). An influence of mUTR2 sequence on cytosolic SHMT1 cannot be excluded (question mark in the Figure). Analysis of mitochondrial expression of UTR2 RNAs in A549 and H1299 LUAD cells. qRT-PCR analysis for cUTR2 and mUTR2 performed on mitochondrial extracts from A549 (B) and H1299 (C) cells transfected with the indicated UTR2 sequences. Data are average ± SD, from three independent experiments. **P < 0.001, ***P < 0.0001. Assessment of cell viability via Trypan Blue exclusion Assay: A549 (D) and H1299 (E) cells examined 48 h post-transfection with the indicated UTR2 sequences. Data shown as average ± SD from three independent replicates. *P < 0.05, **P < 0.001, ***P < 0.0001. F Cell cycle analysis with a focus on the apoptotic population (Sub-G1 Phase) in H1299 examined 48 h post-transfection with the indicated UTR2 sequences Data from a representative of three independent experiments showing a similar trend.
Fig. 4
Fig. 4. Analysis of SHMT activity and effect of UTR2 in HAP-1 cells.
Trypan blue exclusion assay performed on HAP SHMT2KO complemented with SHMT2 WT (A) or with SHMT2 K281S-R284S (B), after 48 h of transfection with the indicated UTR2 sequences. Data shown as average ± SD from three replicates. n.s.: not significant *P < 0.05, **P < 0.001. Data from individual experiments were normalized to 100%, and subsequent values were calculated relative to this baseline before being averaged.
Fig. 5
Fig. 5. Effect of UTR2 expression on the survival of H1299 cells and in the mouse model.
A Mitochondrial UTR2 expression: qRT-PCR on mitochondrial extracts of H1299 cells shows higher UTR2 expression in mitochondria when a mitochondrial RNA import signal is employed. Control involved cells transfected with an empty vector, showing low UTR2 expression. Data as average ± SD from three independent replicates. ***P < 0.0001. B Trypan blue exclusion assay carried out on H1299 cells lines stably transfected as indicated, 48 h after tetracycline treatment (0.06 µg/µl). Average ± standard deviation (SD) is shown. Data as average ± SD from three independent replicates. ***P < 0.0001. C Analysis (left panel) and images (right panel) of tumor volume 30 days after inoculation with the indicated cell lines and treatment with tetracycline in the drinking water. Average ± standard error (SR) is shown. The p-values (CTR vs mUTR2) for the last four statistically significant data points are 0.03, 0.05, 0.009, and 0.018, respectively.

References

    1. Thai AA, Solomon BJ, Sequist LV, Gainor JF, Heist RS. Lung cancer. Lancet. 2021;398:535–54. - PubMed
    1. Lemjabbar-Alaoui H, Hassan OU, Yang YW, Buchanan P. Lung cancer: biology and treatment options. Biochim Biophys Acta Rev Cancer. 2015;1856:189–210. - PMC - PubMed
    1. Hanahan D, Weinberg RA. Hallmarks of cancer: the next generation. Cell. 2011;144:646–74. - PubMed
    1. Rosenzweig A, Blenis J, Gomes AP. Beyond the warburg effect: how do cancer cells regulate One-Carbon metabolism?. Front Cell Dev Biol. 2018;6:90. - PMC - PubMed
    1. Newman AC, Maddocks ODK. One-carbon metabolism in cancer. Br J Cancer. 2017;116:1499–504. - PMC - PubMed

LinkOut - more resources