. 2025 Aug 6;16(1):6698.
doi: 10.1038/s41467-025-61681-6.

A genetically tractable non-vertebrate system to study complete camera-type eye regeneration

Affiliations

A genetically tractable non-vertebrate system to study complete camera-type eye regeneration

Alice Accorsi et al. Nat Commun. .

Abstract

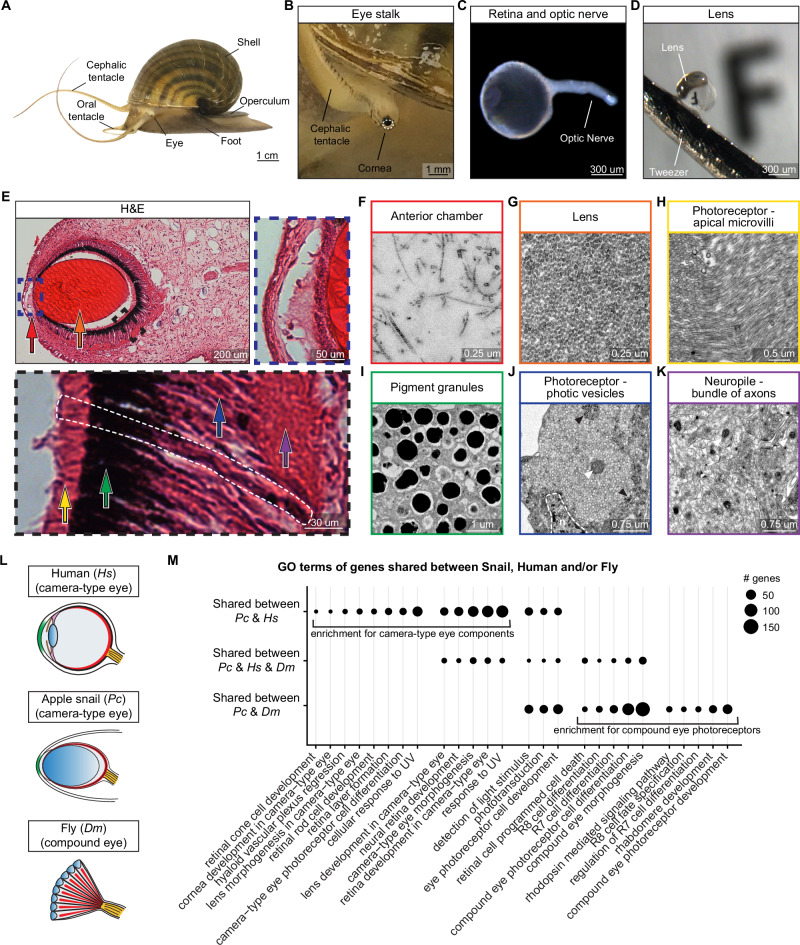
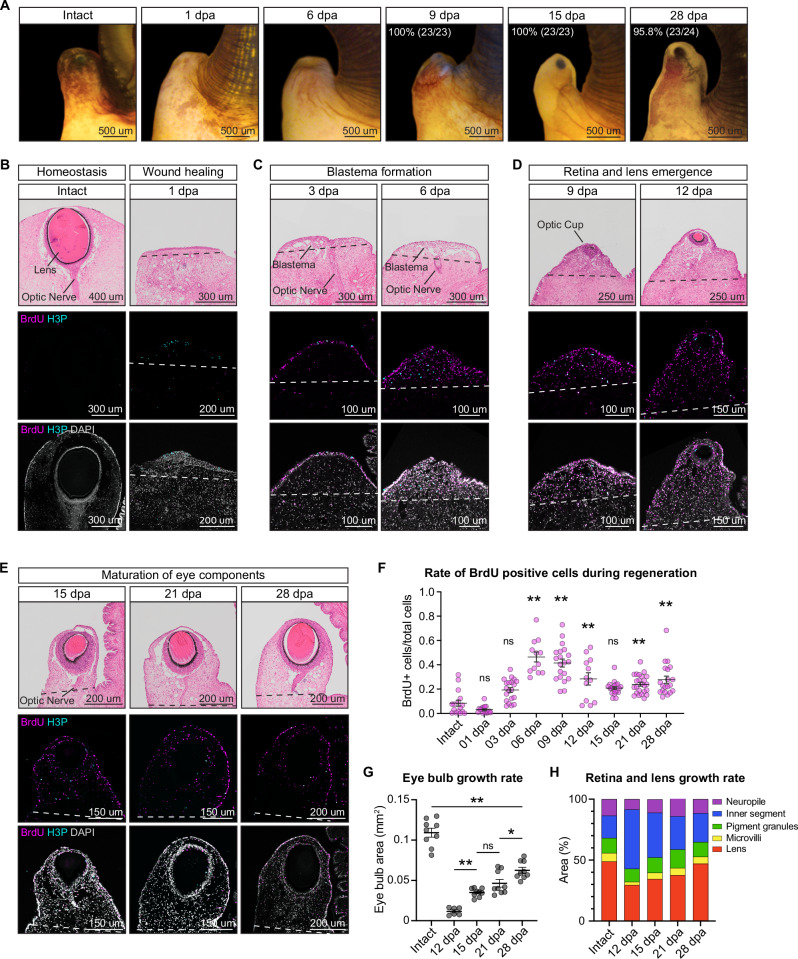
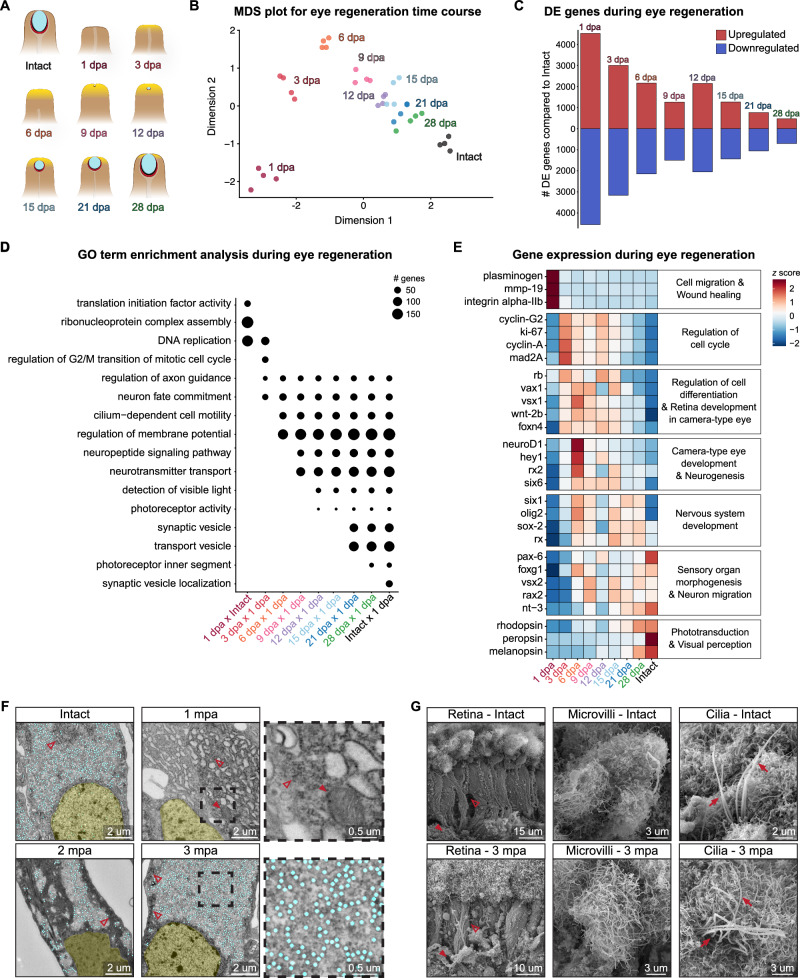
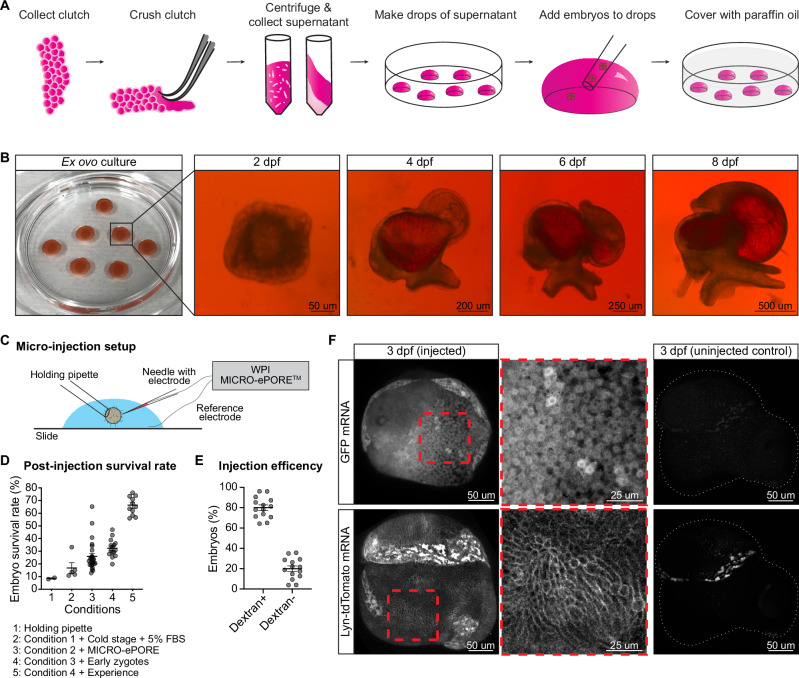
Camera-type eyes are complex sensory organs susceptible to irreversible damage. Their repair is difficult to study due to the paucity of camera-type eye regeneration models. Identifying a genetically tractable organism with the ability to fully regenerate complete camera-type eyes would help overcome this difficulty. Here, we introduce the apple snail Pomacea canaliculata, capable of full regeneration of camera-type eyes even after complete resection. We defined anatomical components of P. canaliculata eyes and genes expressed during crucial steps of their regeneration. By exploiting the unique features of this organism, we successfully established stable mutant lines in apple snails. Our studies reveal that, akin to humans, pax6 is indispensable for eye development in apple snails, establishing this as a research organism to unravel the mechanisms of camera-type eye regeneration. This work expands our understanding of complex sensory organ regeneration and offers a way to explore this process.


Conflict of interest statement

Competing interests: The authors declare no competing interests.

Figures

Fig. 1
Fig. 1. P. canaliculata has complex camera-type eyes.
A Adult P. canaliculata. B Eye bulb and eye stalk with cornea (dashed line). C Isolated optic nerve and retina with the lens enclosed in it. D Isolated lens held with tweezers in front of a paper with the letter F printed in font size 5. E Hematoxylin and eosin (H&E) staining of P. canaliculata eye longitudinal sections. Cornea (dashed line on the left), anterior chamber (red arrow), lens (orange arrow), posterior chamber, retina, optic nerve and surrounding connective tissue, muscle tissue and extracellular matrix (ECM) can be distinguished. The 2 insets highlight the cornea and the anterior part of the lens (blue dashed line) and a portion of the retina (black dashed line). In the latter, a photoreceptor (white dashed line), the photoreceptor outer segments (yellow arrow), pigment granules (green arrow), photoreceptor inner segments (blue arrow) and neuropile (purple arrow) are shown. Arrows in (E) and images in (FK) have the same color-code. TEM images of (F) anterior chamber filled with ECM; G lens with a densely packed structure; H outer segment of rhabdomeric photoreceptors characterized by microvilli; I pigment granules; J densely packed photic vesicles occupy an extensive portion of the photoreceptor cytoplasm together with rare mitochondria (white arrowhead) and ribosomes (black arrowheads), n nucleus; K neuropile, or bundle of axons forming the optic nerve, filled with heterogeneous vesicles. The images showed in (EK) are representative of data collected through three independent experiments. L Schematic representation of eye anatomy for human (Hs), apple snail (Pc) and Drosophila (Dm). M Gene Ontology (GO) enrichment analysis of P. canaliculata (Pc) genes bioinformatically defined as orthologs of human (Hs) and/or fly (Dm) genes. For this analysis only GO terms related to eye development and function were taken into consideration. The plot shows the number of genes for each GO term that can be found in both snail and human but not in fly (first row), in snail, human and fly (middle row), or in snail and fly but not in human (last row). Adjusted p value cutoff of 1e−5. Manually selected representative terms (see Supplementary Fig. 1 and Supplementary Data 1).
Fig. 2
Fig. 2. P. canaliculata camera-type eyes can fully regenerate after complete amputation.
A Regeneration time course after complete amputation of the eye bulb. BE Longitudinal sections of the eye stalk during eye regeneration time course stained with either H&E (top images) or anti-BrdU (magenta) and anti-H3P (cyan) (central and bottom row of images). The dashed lines represent where the cut for eye amputation was performed. BrdU and H3P positive cells where counted in the tissue above the dashed lines. F Quantification of BrdU positive cells in the regenerating tissue area during the eye regeneration time course. n = 3 snails for 6 and 12 dpa; n = 4 snails for Intact and 1 dpa; n = 5 snails for 3, 9, 15 and 28 days post amputation (dpa); n = 6 snails for 21 dpa; for each sample 4 sections were analyzed; non-parametric Kruskal−Wallis ANOVA with Dunn’s post hoc multiple comparisons test determined statistical differences between regenerating samples and Intact eye; adjusted p values are <0.0001 for 6 and 9 dpa, 0.0035 for 12 and 21 dpa and 0.0009 for 28 dpa. G Quantification of the eye bulb area during the eye regeneration time course. n = 3 snails/time point, 3 sections each; one-way ANOVA with Tukey’s post hoc multiple comparisons test determined statistical differences between samples; adjusted p values are 0.0046 for 15 vs 12 dpa, 0.0447 for 28 vs 21 dpa and <0.0001 for Intact vs 28 dpa. H Quantification of the relative area of the eye bulb components (lens in red, photoreceptor microvilli in yellow, pigmented layer in green, photoreceptor inner segment in blue and neuropile in purple) during the eye regeneration time course. Data are represented as mean ± SEM. n = 3 snails/time point, 3 sections each. *p value < 0.05, **p value < 0.01, ns non-significant (see Supplementary Fig. 2).
Fig. 3
Fig. 3. P. canaliculata regenerating eyes express genes driving vertebrate eye development.
A Schematic representation of the main morphologically defined time points during eye regeneration. Blastema/cell proliferation (yellow), lens (cyan), retina (red). B MDS plot of RNA-Seq samples collected during eye regeneration time course. Dimension 1 explains 41.8% of variance and Dimension 2 13.72%. n = 4 samples/time point (5 animals/sample) (see Supplementary Fig. 3A). C Number of differentially expressed (DE) genes (up-regulated in red and down-regulated in blue) compared to Intact samples [Log Fold Change (LogFC ≥ 0 and FDR ≤ 1e−5]. D GO enrichment analysis using significantly up-regulated genes (LogFC ≥ 0 and FDR ≤ 1e−5) in 1 dpa vs Intact and in 3, 6, 9, 12, 15, 21 and 28  dpa vs 1 dpa comparisons to highlight the features recovered throughout regeneration. GO terms used in this representation were manually selected from GO enrichment analysis run on the up-regulated genes obtained from comparing each time point with the previous one (p value ≤ 0.01, q value ≤ 0.05) (see Supplementary Fig. 4 and Supplementary Data 3B, C). E Heatmap of gene expression changes during eye regeneration time course. These genes represent the main stages of eye regeneration, and many of them are known, from previous studies, to be involved in vertebrate eye development (z scores calculated from TPMs). Gene categories on the right of the heatmap are based on GO annotations. F TEM images of the photoreceptor cytoplasm in the retina of Intact, 1, 2 and 3 months post amputation (mpa) eyes. Nuclei (yellow), photic vesicles (cyan), ribosomes and rough endoplasmic reticulum (empty arrowhead) and mitochondria (full arrowhead). The images are representative of data collected through three independent experiments. G SEM images of the retina, photoreceptor microvilli and apical cilia observed in Intact and 3 mpa eyes. At both time points, the retina is constituted by long photoreceptors (empty arrowhead), neuropile (on the bottom, full arrowhead) and microvilli (on the top). The photoreceptor microvilli at 3 mpa show an apical flat and wide expansion of the membrane like the Intact eyes. Cilia (full arrow) have been observed intercalated in the photoreceptor microvilli both in Intact and 3 mpa retina. The images are representative of data collected through three independent experiments.
Fig. 4
Fig. 4. P. canaliculata zygotes can be collected, micro-injected with exogenous mRNA and cultured ex ovo.
A Schematic representation of ex ovo culture protocol steps. Clutches are collected, crushed and centrifuged. The supernatant is collected and used to make drops where the embryos can be cultured. Everything is covered with paraffin oil to avoid evaporation. B Images of embryos cultured at 0 days post fertilization (dpf) and developing ex ovo. The images are representative of data collected through 6 independent experiments with more than 10 embryos in each experiment. C Schematic representation of the setup used for P. canaliculata zygote micro-injection (see Supplementary Fig. 5B, C). D Embryonic survival rate after micro-injection using different micro-injection protocols. Each dot represents an injection session with 50–100 embryos. E Percentage of embryos Dextran-positive, used as read-out of successfully injected embryos. Each dot represents an injection session with 50–100 embryos. F Confocal images of 3 dpf embryos injected with GFP mRNA or Lyn-tdTomato mRNA. GFP localizes in the cytoplasm, the membrane targeted tdTomato localizes in the cell membranes and the uninjected controls show some autofluorescence with a stereotypical localization in the red channel. Data are represented as mean ± SEM. The images are representative of data collected through two independent rounds of injections with more than 20 embryos each.
Fig. 5
Fig. 5. P. canaliculata has a pax6 gene highly expressed in the eye buds.
A Domain and 3D-folding predictions for human, D. melanogaster and P. canaliculata pax6 genes. Purple = PAX domain, orange = HOX domain, dark gray = disordered regions (see Supplementary Fig. 6). B Confocal images of pax6 (cyan) and rhodopsin (magenta) HCR during embryonic development. rhodopsin highlights the localization of the retina and the differentiation of the photoreceptors. The images are representative of five embryos. C Confocal images of pax6 (cyan) and nec2 (orange) HCR during embryonic development. nec2, also known as proprotein convertase 2 (pc2) or prohormone convertase 2, has been used as marker for the nervous system. The images are representative of five embryos. D Confocal images of pax6 (cyan) and rhodopsin (magenta) HCR on eye stalk whole mount during adult eye regeneration. The images are representative of five samples. E Detail of the 15 and 21 dpa regenerating retina. White arrowheads highlight cells expressing both pax6 (cyan) and rhodopsin (magenta). The images are representative of five esamples.
Fig. 6
Fig. 6. CRISPR mutant snails reveal P. canaliculata pax6 is required for eye formation.
A Schematic representation of the P. canaliculata pax6 genomic region, the gRNA target site, and the crossing strategy used to establish a stable mutant line and to obtain homozygous mutant animals (see Supplementary Fig. 7 and Supplementary Data 5). B Images of wild-type and pax6−/− 9 dpf embryos and insets of the region at the base of the cephalic tentacle. Wild-type and pax6+/− animals have eyes while the pax6−/− snails lack all the eye bulb and eye stalk components. C The percentage of F2 embryos with the “lack of eye” phenotype corresponds to the expected 25%. n = 6 clutches. D Correlation between genotypes and phenotypes in F2 embryos shows that the lack of eyes corresponds to homozygous mutants. n = 3 clutches. E Confocal images of wild-type and pax6−/− embryos stained with phalloidin during a developmental time course. Phalloidin shows that at 4 dpf there is a first morphological evidence of eye formation through cell wall contraction in the cephalic area of the embryos. The red arrows point at the area where the eye develops (in wild-type and pax6+/− snails) or where it should be developing (in pax6−/− snails). F Still images of time lapses showing adult wild-type and pax6−/− snails free to move in their tanks (see Supplementary Movie 1). Data are represented as mean ± SEM.

Similar articles

References

    1. Sánchez Alvarado, A. & Tsonis, P. A. Bridging the regeneration gap: genetic insights from diverse animal models. Nat. Rev. Genet.7, 873–884 (2006). - PubMed
    1. Srivastava, M. Beyond Casual Resemblance: Rigorous Frameworks for Comparing Regeneration Across Species. Annu. Rev. Cell Dev. Biol.37, 415–440 (2021). - PubMed
    1. Fernald, R. D. Casting a Genetic Light on the Evolution of Eyes. 313, 1914-1918 (2006). - PubMed
    1. Nilsson, D.-E. Eye evolution and its functional basis. Vis. Neurosci.30, 5–20 (2013). - PMC - PubMed
    1. Land, M. F. & Nilsson, D.-E. Animal eyes (Oxford University Press, 2012).

Substances