. 2025 Aug 6;16(1):7249.
doi: 10.1038/s41467-025-62622-z.

Metal-driven anaerobic oxidation of methane and the Sturtian deglaciation

Affiliations

Metal-driven anaerobic oxidation of methane and the Sturtian deglaciation

Jun Hu et al. Nat Commun. .

Abstract

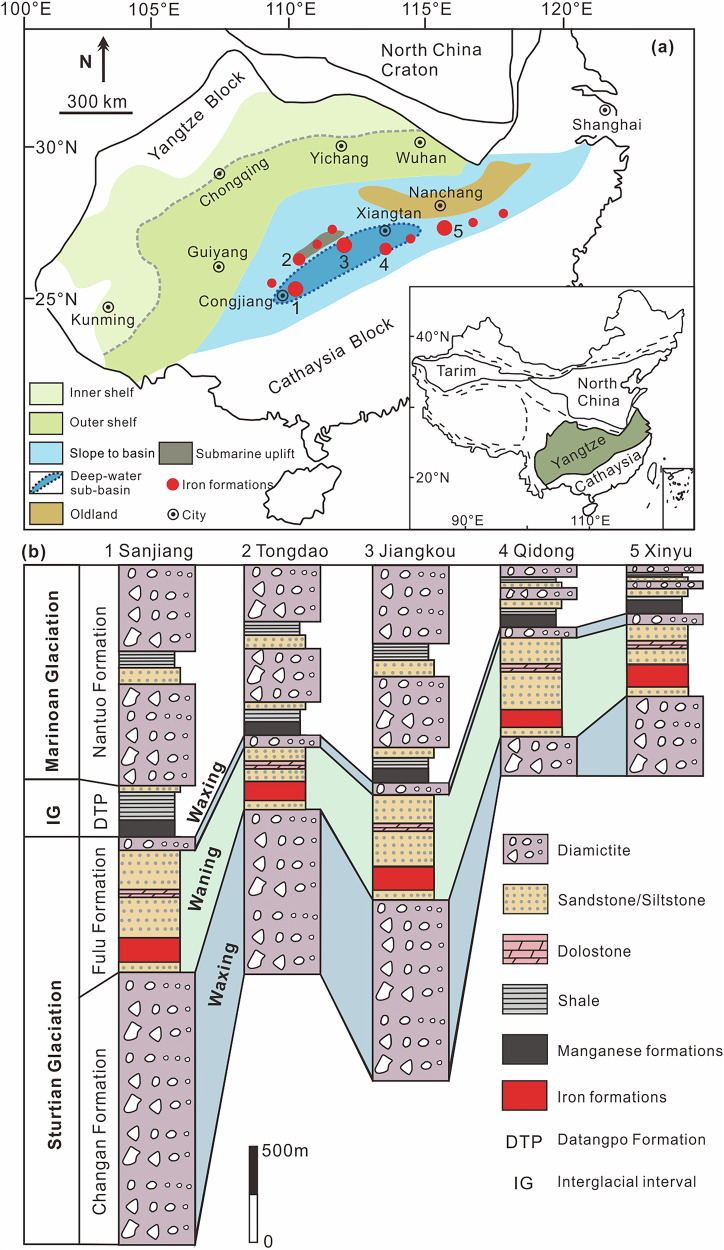
The Sturtian and Marinoan glaciations shaped Neoproterozoic palaeoenvironmental evolution. While methane emission likely intensified the Marinoan greenhouse effect, its role during the Sturtian glaciation-coinciding with widespread iron formations (IFs)-remains poorly understood. Here, we analysed bio-essential metals (Ni, Co, Zn), rare earth elements and yttrium (REY), Fe (δ56Fe) and Ni (δ60Ni) isotopes in hematite and magnetite, alongside bulk-rock and in-situ C isotopes of Mn-rich carbonates from five well-preserved Sturtian-aged IFs in South China. Our findings provide geochemical evidence for a methane-related biogeochemical pathway driving Fe-bearing mineral transformation via methanogenesis and metal-driven anaerobic methane oxidation (AOM), mediated by methanogens and anaerobic methane-oxidizing archaea (ANME) in ferruginous settings. Additionally, the Sturtian deglaciation facilitated atmospheric-oceanic O2 exchange, increased nutrient influx from weathering, and methane release under slow AOM oxidation kinetics, potentially aiding ice sheet melting or prolonging glacial waning.


Conflict of interest statement

Competing interests: The authors declare no competing interests.

Figures

Fig. 1
Fig. 1. Palaeogeographic setting and stratigraphic correlation of Sturtian iron formations in the South China Block.
a Palaeogeographic reconstruction of the South China Block (SCB) during the late Neoproterozoic Era, showing the distribution of Sturtian-aged iron formations (IFs) in the region,,,,,,; 1 (Sanjiang IF); 2 (Tongdao IF); 3 (Jiangkou IF); 4 (Qidong IF); and 5 (Xinyu IF). The inset shows the geographic locality of the Yangtze Block. The shelf is subdivided into inner and outer regions. Within the broader slope-to-basin environment, an inferred deep-water sub-basin is delineated, reflecting relatively greater water depth (Supplementary Information). This palaeogeographic framework is primarily informed by previous regional interpretations, including stratigraphic, sedimentological, and lithofacies features, and remains provisional in nature (see main text and SI for a detailed discussion of its limitations). Symbols for IFs and submarine uplifts are not to scale and are exaggerated for illustrative purposes. b Representative stratigraphic columns illustrating the correlation of the studied IFs with the waxing and waning cycles of the Sturtian glaciation in the SCB,,,,–. The thicknesses of the IFs, manganese formations, and intervening dolostone layers in the Fulu Formation, as well as the pebble-free siltstone, sandstone, and shale layers in the Nantuo Formation, are exaggerated for illustrative purposes and do not accurately represent their true dimensions.
Fig. 2
Fig. 2. Fe and Ni isotope systematics in magnetite and hematite from the studied Sturtian iron formations.
a Variations in Fe isotope compositions between coexisting hematite and magnetite, highlighting distinct trends that delineate diverse pathways of magnetite formation. The Fe isotope fractionations for equilibrium hematite and magnetite formation are illustrated in blue,. The gray line labeled “1:1” represents the origin of magnetite through the in-situ dissimilatory iron reduction (DIR) of the common precursor Fe(OH)3,. b, c Cross-plots of δ60Ni versus δ56Fe values for magnetite samples. Plot (c) displays average δ60Ni and δ56Fe values. The δ60Ni and δ56Fe values of magnetite exhibit a positive correlation. Error bars for the δ56Fe and δ60Ni data represent two standard deviations (2 SD).
Fig. 3
Fig. 3. Correlations among Ni isotopes, metal elements, and REY patterns in magnetite from the studied Sturtian iron formations.
ac, e, f Cross-plots of Ni, Co, Zn, and Mn contents, as well as Y/Ho ratios, versus δ60Ni, illustrating anticorrelations between these element contents and ratios and the δ60Ni values. d Plot of Dy/YbPAAS versus δ60Ni, demonstrating a positive correlation between Dy/YbPAAS ratios and δ60Ni values. Here, Dy/YbPAAS represents the ratio of middle rare earth elements (MREE) to heavy rare earth elements (HREE). Rare earth element data are normalized to post-Archean Australian shale (subscript PAAS). g Plot of Ni contents versus Dy/YbPAAS. An anticorrelation exists between Ni contents and MREE/HREE ratios. h, i Plots of Ni contents versus Co and Zn contents, showing positive correlations among the variables. Error bars for the δ60Ni data represent two standard deviations (2 SD).
Fig. 4
Fig. 4. Correlations of metal elements and REY patterns with Fe isotope compositions in magnetite from the studied Sturtian iron formations.
ac Plots of Ni, Co, Mn contents versus δ56Fe values, illustrating anticorrelations between the parameters and δ56Fe values. d Plot of Dy/YbPAAS ratios versus δ56Fe values. A positive correlation exists between the ratios of MREE to HREE and δ56Fe values. Error bars for the δ56Fe data represent two standard deviations (2 SD).
Fig. 5
Fig. 5. Distributions and mineral-specific differences of metal elements, REY patterns and isotope compositions from the studied Sturtian iron formations.
ae Box plots illustrating the distribution of metal elements, REY, as well as Ni and Fe isotopes in magnetite. a Ni contents (n = 34), b Co contents (n = 34), c Dy/YbPAAS ratios (n = 34), d δ60Ni values (n = 24), and e δ56Fe values (n = 34). Boxes represent the interquartile range (IQR = Q3 − Q1), encompassing the central 50% of the data. The mean is shown as a colored solid circle, and the median (Q2) as a colored solid line within the box. Outliers are indicated by light gray circles. Extreme outliers, defined as exceeding double the IQR from Q2, are excluded from the visualization. fh Comparative plots of different IFs were generated to investigate the relationships between Ni (f) and Co (g) contents, as well as the Dy/YbPAAS (h) ratios in coexisting hematite and magnetite.
Fig. 6
Fig. 6. Conceptual illustration of biogeochemical cycling during the waning stage of the Sturtian glaciation in the South China Block.
a The studied Sturtian-aged IFs were deposited during deglaciation, with minimal glacial influence, allowing for open-water conditions. This created favorable conditions for direct O₂ exchange between the atmosphere and ocean, enhanced nutrient (PO43⁻ and SO42⁻) influx from continental weathering, sustained oxygenic photosynthesis and primary productivity recovery, and facilitated ocean stratification, with an anoxic, ferruginous deep layer and an oxygenated surface where the IFs formed. Meanwhile, CH4 emissions into the atmosphere likely contributed to ice sheet melting or sustained the waning phase between Sturtian glacial episodes. b, c Under these conditions, metal-driven anaerobic oxidation of methane (AOM), dissimilatory iron reduction (DIR), and dissimilatory manganese reduction (DMR) occurred within anoxic sediment porewater (Eqs. 1–4). These processes involved the reduction of Fe(OH)3 and MnO2 formed in the upper oxic water column, coupled with varying degrees of methanogens and anaerobic methane-oxidizing archaea (ANME) activity, as well as organic matter oxidation, syntrophic interactions with dissimilatory Fe3+ and Mn4+-reducing bacteria, leading to the release of dissolved Fe²⁺ and Mn²⁺ into porewater. Subsequently, the reaction of Fe(OH)3 with Fe2+ led to the formation of magnetite. During these processes, ANME and methanogens preferentially absorbed Ni, Co, Zn, HREE, and light Ni isotopes, which were later released into porewater and incorporated into magnetite. Meanwhile, biologically produced HCO3⁻ mixed with seawater-derived HCO3⁻, interacting with Ca, Mg, Fe, and Mn cations, led to the formation of 13C-depleted Mn-rich carbonates. The positions of the IFs are schematic. The palaeogeographic framework follows Fig. 1a and reflects previously discussed provisional constraints (see Fig. 1a caption, main text and SI).

References

    1. Hoffman, P. F. et al. Snowball Earth climate dynamics and Cryogenian geology-geobiology. Sci. Adv.3, e1600983 (2017). - PMC - PubMed
    1. Sun, R., Grasby, S. E., Shen, J., Xiao, J. & Yin, R. Climate/ocean dynamics and possible atmospheric mercury depletion events during the Late Sturtian deglaciation. Chem. Geol.598, 120830 (2022).
    1. Li, M. et al. Deglacial volcanism and reoxygenation in the aftermath of the Sturtian Snowball Earth. Sci. Adv.9, eadh9502 (2023). - PMC - PubMed
    1. Lechte, M. A. et al. Subglacial meltwater supported aerobic marine habitats during Snowball Earth. Proc. Natl. Acad. Sci. USA116, 25478–25483 (2019). - PMC - PubMed
    1. Zhao, Z. et al. Active methanogenesis during the melting of Marinoan snowball Earth. Nat. Commun.12, 955 (2021). - PMC - PubMed

LinkOut - more resources