

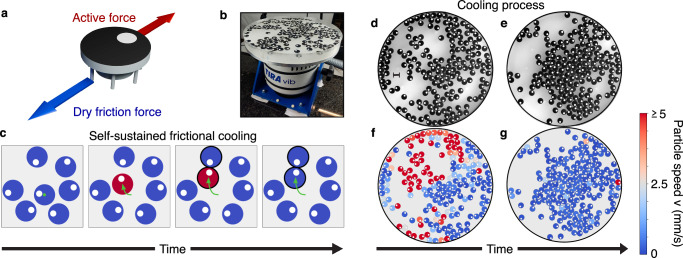
Self-sustained frictional cooling in active matter
- PMID: 40770188
- PMCID: PMC12328619
- DOI: 10.1038/s41467-025-62626-9
Self-sustained frictional cooling in active matter
Abstract
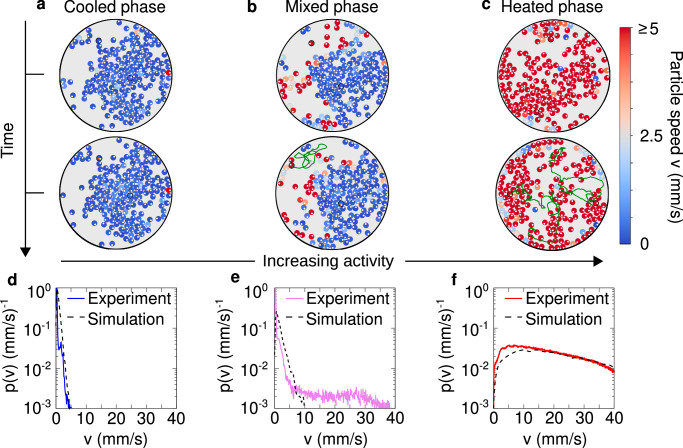
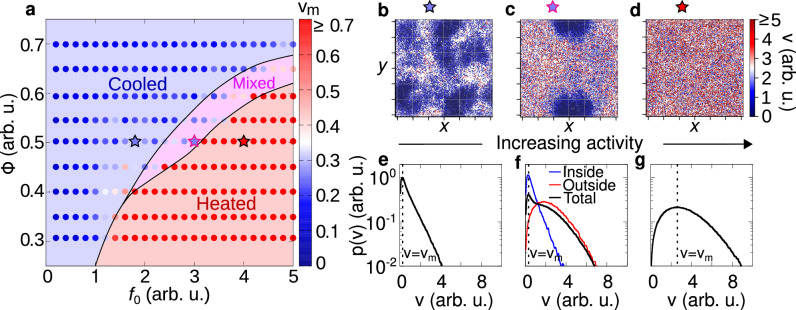
Cooling processes in nature are typically generated by external contact with a cold reservoir or bath. According to the laws of thermodynamics, the final temperature of a system is determined by the temperature of the environment. Here, we report a spontaneous internal cooling phenomenon for active particles, occurring without external contact. This effect, termed self-sustained frictional cooling, arises from the interplay between activity and dry (Coulomb) friction, and in addition is self-sustained from particles densely caged by their neighbors. If an active particle moves in its cage, dry friction will stop any further motion after a collision with a neighbor particle thus cooling the particle down to an extremely low temperature. We demonstrate and verify this self-sustained cooling through experiments and simulations on active granular robots and identify dense frictional arrested clusters coexisting with hot, dilute regions. Our findings offer potential applications in two-dimensional swarm robotics, where activity and dry friction can serve as externally tunable mechanisms to regulate the swarm's dynamical and structural properties.
© 2025. The Author(s).
Conflict of interest statement
Competing interests: The authors declare no competing interests.
Figures


References
-
- Bloch, I., Dalibard, J. & Zwerger, W. Many-body physics with ultracold gases. Rev. Mod. Phys.80, 885–964 (2008).
-
- Bloch, I., Dalibard, J. & Nascimbène, S. Quantum simulations with ultracold quantum gases. Nat. Phys.8, 267–276 (2012).
-
- Georgescu, I. 25 years of BEC. Nat. Rev. Phys.2, 396 (2020).
-
- del Campo, A. & Seong-Ho, S. Universal symmetry breaking passes the superfluid test. Nat. Phys.20, 1523–1524 (2024).
-
- Simbierowicz, S., Borrelli, M., Monarkha, V., Nuutinen, V. & Lake, R. E. Inherent thermal-noise problem in addressing qubits. PRX Quantum5, 030302 (2024).
Grants and funding
LinkOut - more resources
Full Text Sources
